HAL Id: hal-01593719
https://hal.archives-ouvertes.fr/hal-01593719
Submitted on 18 Jul 2018
HAL is a multi-disciplinary open access
archive for the deposit and dissemination of
sci-entific research documents, whether they are
pub-lished or not. The documents may come from
teaching and research institutions in France or
abroad, or from public or private research centers.
L’archive ouverte pluridisciplinaire HAL, est
destinée au dépôt et à la diffusion de documents
scientifiques de niveau recherche, publiés ou non,
émanant des établissements d’enseignement et de
recherche français ou étrangers, des laboratoires
publics ou privés.
Assessment of flushing methods for the removal of heavy
chlorinated compounds DNAPL in an alluvial aquifer
Julien Maire, Antoine Joubert, Delphine Kaifas, Thomas Invernizzi, Julien
Marduel, Stéfan Colombano, David Cazaux, Cédric Marion, Pierre-Yves
Klein, Alain Dumestre, et al.
To cite this version:
Julien Maire, Antoine Joubert, Delphine Kaifas, Thomas Invernizzi, Julien Marduel, et al.. Assessment
of flushing methods for the removal of heavy chlorinated compounds DNAPL in an alluvial aquifer.
Science of the Total Environment, Elsevier, 2018, 612, pp.1149-1158. �10.1016/j.scitotenv.2017.08.309�.
�hal-01593719�
Assessment
of
flushing
methods
for
the
removal
of
heavy
chlorinated
compounds
DNAPL
in
an
alluvial
aquifer
Julien Maire
a, Antoine Joubert
b, Delphine Kaifas
c, Thomas Invernizzi
b, Julien Marduel
b, Stéfan Colombano
d,
David Cazaux
e, Cédric Marion
e, Pierre-Yves Klein
c, Alain Dumestre
b, Nicolas Fatin-Rouge
a,⁎
a
Institut UTINAM, Université de Bourgogne Franche-Comté, 16 Route de Gray, 25000 Besançon, France bSERPOL, 2 Chemin du Génie, 69633 Vénissieux, France
c
Sol Environment, 22 Rue Lavoisier, 92000 Nanterre, France d
BRGM, 3 Avenue Claude Guillemin, 45060 Orléans, France e
Inovyn, Avenue de la République, 39500 Tavaux, France
Immiscible mobilization and foamflushing were assessed as low surfactant consuming technologies, for the en-hanced recovery of dense non-aqueous phase liquid (DNAPL) residual at a site contaminated by heavy chlorinated compounds. Preliminary experiments in well-controlled conditions demonstrated the phenomena involved in these remediation technologies and their limitations. Furthermore, we characterized the technologies according to by their surfactant consumption (per kg of DNAPL recovered) and thefinal DNAPL saturation reached. Surfactant foamflushing (SFF) produced lower DNAPL saturation than immiscible mobilization, thanks to its higher viscosity. However, its efficiency is strongly correlated to the pressure gradient (▽P) used during injection, and that is limited by risks of soil fracturing. The two technologies were tested infield cells (10 m × 10 m × 10 m) delimited by cement/ bentonite walls anchored in the clayey substratum. The deepest soil layer was the most contaminated. It was com-posed of silt-sandy soil and had an average hydraulic conductivity of 10−4m s−1. Field results show that we should now modelflushing fluid propagation to design efficient set-ups for recovering the displaced DNAPL.
like chemistry, pharmacy and agriculture (Académie des Sciences, 2000; Hildenbrand et al., 2016, 2015). COCs are widespread contami-nants in soil and groundwater because of their low degradability and, for the lightest and most polar compounds, their relatively high water solubility. The presence of dense non-aqueous phase liquids (DNAPLs) of COCs in these media is the result of spillages. These DNAPLs percolate to the aquitard because of their high density and low solubility. As the free phase moves downwards, it leaves behind a discontinuous residual phase of compounds in the contaminated soils. There, DNAPL droplets are trapped by capillary forces in narrow soil pores. However, the water permeability of the contaminated strata increases as water satu-ration. Pure and residual phases feed plumes of dissolved COCs for the long term, which may prevent water use because of drinking water and indoor air standards (Ireland Environmental Protection Agency, 2014; WHO, 2010).
Source zones of COCs are a serious environmental liability, since they are challenging to remediate (Interstate Technology and Regulatory Council, 2002; Stroo et al., 2012). Pump and treat (PT) technology is commonly used for DNAPL treatment, but typical recovery rates do not exceed 60% even at their highest values (Interstate Technology and Regulatory Council, 2002). Indeed, because of DNAPL's high density, low solubility and high interfacial tension with water (γow), PT is not
ef-fective for mass removal (National Research Council, 1994). Older PT technology has progressively moved from targeting source zone con-tainment to remediation through the surfactant-enhanced aquifer re-mediation (SEAR) approach, whereas in the meantime in situ chemical oxidation (ISCO) or reduction (ISCR) or biodegradation have been de-veloped for plume treatment of non-volatile COCs (Scherer et al., 2000). Surfactantflushing is used to manage low saturation index of the organic phase i.e. the residual phase. Surfactantflood increases the DNAPL removal through three mechanisms: 1) mobilization owing to γowreduction that arises when surfactant concentration (CS) is lower
than its critical micellar concentration (CMC), 2) emulsification, like microemulsion phases for CS~ CMC and 3) dissolution of contaminants
into micelles that arises when CSexceeds the CMC-value in pores (Paria, 2008; Rosen, 2004). Mobilization starts when the sum of viscous and buoyancy forces exceeds the capillary forces of the contaminated medi-um (Duffield et al., 2003; Jeong, 2005; Li et al., 2007; Pennell et al., 1996). However, this strategy is controversial because of the risks asso-ciated to the uncontrolled sinking of DNAPLs beyond the influence zones of extracting wells and penetration in less permeable zones (Rathfelder et al., 2003; Robert et al., 2006). Microemulsions with sizes about 100 nm are smaller than the average pore sizes of permeable soil material and travel quite freely. However, to produce them in situ requires tedious lab work to build up the required complex phase dia-grams and often needs the addition of large amounts of inorganic salts (Martel et al., 1993; Szafranski et al., 1998). Moreover, the low surfac-tant to COC ratio (typically ranging from 15 to 30%) may lead to dense plume sinking beyond the influence of extracting wells (Oostrom et al., 1999; Robert et al., 2006). Finally, dissolving COCs in micelles is unpopular, because of the large amounts of surfactant required, consid-ering the low surfactant solubilization capacity values (Butler and Hayes, 1998; Damrongsiri et al., 2010) and the huge amount of highly contaminated wastewater with water stabilized pollutants that requires the use of costly purification technologies (Ahn et al., 2010, 2008, 2007; Lee et al., 2005; Sabatini et al., 1998).
The limitations of the above technologies for soilflushing are ac-knowledged (Atteia et al., 2013; Szafranski et al., 1998; Taylor et al., 2001), because of the reasons given and soil anisotropy (both in terms of geology and pollution). The need for increased viscous pressure of the injected phase to overcome trapping forces is well documented and has boosted the use of polymer solutions and surfactant foams (SF) in enhanced oil recovery processes (Jeong, 2005; Lake, 1989). The basic concept for making in situ mobility control with foams is to inject gas with a surfactant solution. Many studies report fundamental knowl-edge about mechanisms involved in foam generation and propagation
in pores of homogeneous and heterogeneous soils (Bertin et al., 1998; Kovscek and Radke, 2009). Foam in porous media appears as gas bub-bles separated by thin liquidfilms (lamellae) blocked at pore throats. These lamellae must stretch to go through pores or break, opposing re-sistance to gasflow. This gives an important apparent viscosity to the foam that divertsflow from big pores to smaller ones. Hence, foam can be used in two ways:firstly, as a blocking agent. Foam is used to block high permeability zones to improve treatmentfluid sweeping in low permeability zones; or, secondly, as a mobility control agent. Foam is used as the treatmentfluid, since it will propagate at the same velocity in all permeability zones (Bertin et al., 1998; Khatib et al., 1988). However, this approach is less popular than injecting a polymer solution, because foam's mobility is less predictable. Nevertheless, SF is potentially more efficient than polymer flushing to remove non-aqueous phase liquids and significant progress has been made in the last decade.
In situ environmental remediation (ISER) using foam has similarities with EOR, but also major differences: on the one hand, EOR takes place thousands of meters below ground surface (bgs) and average recovery yields reach only 20–40% (Muggeridge et al., 2013); on the other hand, ISER occurs only some meters bgs and remaining contaminants should be at the ppm level or less (Kilbane et al., 1997). Hence ISER is more challenging, requiring low pressure injection to avoid soil fractur-ing (about 100 kPa m−1of depth (“Hydraulic Fracturing Technology Technology Evaluation Report”, 1993)) while requiring better sweeping efficiency. In previous articles (Maire et al., 2015; Maire and Fatin-Rouge, 2017), authors proved the efficiency of SF flushing to mo-bilize a DNAPL pool of heavy and biorecalcitrant COCs ahead of recovery wells in a saturated soil with minimal dissolution and low pressure gra-dient (▽P). The surfactant alternating gas (SAG) mode of injection was selected to avoid soil fracturing. The SAG technology is recent and most of the literature still describes the use of co-injection process (Shokrollahi et al., 2014). SAG aims to maintain good foam injectability where continuous gas and solution injection (pre-made foam or co-injection foam) can lead to blockage (Blaker et al., 2002). During this process, solution and gas slugs are injected alternately. This process al-lows for a strong foam front (required to avoid gravity override) and low▽P for propagation because foam between front and injection well foam collapses during gas injection (Farajzadeh et al., 2015). The gas and solution slugs' ratio is the most critical parameter for a success-ful SAG (Salehi et al., 2014). It should befinely tuned for each applica-tion to avoid thefingering of weak foam through strong foam front.
The need to document and quantify how new DNAPL treatment technologies perform has been stated repeatedly since the early nineties. This study investigates the use of SFflood to remove a residual phase of heavy and recalcitrant chlorinated compounds from a contam-inated alluvial aquifer. To the best of our knowledge, the onlyfield as-sessment of foam ISER used a SAG process to generate foam in an anisotropic geology (Hirasaki et al., 1997). Foam was used as a blocking agent that was formed in the most permeable horizon to divert a surfac-tant solution to a less permeable horizon where the DNAPL was. Our ap-proach uses the foam differently, as the mobile phase for pure phase COCs recovery in a homogenous horizon. Here, we have compared the SFflood performance with some surfactant flood technologies well-known both at lab- andfield-scales.
2. Materials and methods 2.1. Study site
The Tavaux site is a large chloralkali chemical plant located in the center-east of France. From the 1980s to 2007, a historical DNAPL pool of several hectares was physically confined by pumping while migration was monitored. The DNAPL rapidly migrated from a landfill and reached a static state within a shallow water-table sandy aquifer at top of a 1. Introduction
Chlorinated organic compounds (COCs) have been released for decades into the environment because of use in anthropogenic activities
clayey substratum 10 m bgs. The DNAPL pool thickness was observed to be from 20 cm to 150 cm according to substratum morphology.
In the context of the SILPHES project, four concrete cubic cells were dug above the DNAPL source zone, confining a part of the DNAPL pool thanks to cement/bentonite walls (trenches of mixed soils).
2.2. Chemicals
We used dihexylsulfosuccinate (DHSS) as the surfactant (Aerosol MA-80, Cytec, anionic, 80%, CMC = 1.5% of commercial product or 1.2% DHSS). It was used as received from the producer. It was primarily selected for its ability to make foam when foam is generated in porous medium using the SAG process. It was also able to efficiently lower the interfacial tension between DNAPL and water (γow). Consequently, we used it to mobilize the residual
DNAPL phase at lab- andfield-scales.
2.3. Lab studies
2.3.1. Soil, water and contaminant
The soil was collected at the study site, upstream from the contami-nated area, in the same alluvial geological layer as the one in which the DNAPL laid. The raw soil was sieved under running water to collect a se-lected fraction between 0.08 and 2.5 mm for the experiments. The po-rosity of the selected material was 35%, its intrinsic permeability was 40μm2. The natural organic content of the soil was found to be
insignificant.
The ionic composition of water is known to affectγow. Hence, for
lab-trials to be representative of field conditions, an artificial groundwater was prepared by dissolving 0.039 g of MgCl2 and
0.914 g CaCl2in 1 l of deionized water, based on the ionic balance
of the site's groundwater. Surfactant solutions were prepared with this artificial groundwater.
Soil samples were contaminated by the black DNAPL pumped from the site. The DNAPL density was 1.6 g cm−3. Its main components were hexachlorobutadiene (58%), hexachloroethane (16%), perchloro-ethylene (8%), and pentachlorobenzene (3.5%). Additional information about soil and contaminant characteristics can be found elsewhere (Maire et al., 2015).
2.3.2. Interfacial tension measurement
The IFT between DNAPL and aqueous phase (γow) was measured for
DHSS solutions with concentration varying from 0 to 1.5% by the pen-dant drop method. Details are given elsewhere (Maire and Fatin-Rouge, 2017).
2.3.3. Immiscible mobilization experiments
A vertical glass column (L = 9 cm, i.d. = 2.5 cm,Fig. 1) wasfilled with a known amount of DNAPL (15 ml). Dry soil was added and compacted into the DNAPL so that the soil was fully saturated with DNAPL. Sincefield objectives were to extract the DNAPL at the deepest point of the clayey substratum, the main driving force being gravity, we decided for lab experiments to hold the 1D-column vertically and inject solution at the top while recovering DNAPL at the bottom. The cell out-flow was directed to a phase separator to quantify the amount of DNAPL recovered. Several DHSS solutions with concentration varying from 0 to 1.5% were injected successively. Each solution was injected until the amount of DNAPL recovered stopped increasing, with a minimum of 10 PV. Solution injection was carried out using two syringe pumps (Pilot A2, Fresenius). Injection Darcy's velocity (U) was set to 1.25 × 10⁻⁴m s−1(Upore= 3.58 × 10⁻⁴m s−1) to match the expected
injection velocity used infield-tests.
2.4. Field tests set-up
2.4.1. Flushing with groundwater and with surfactant solutions
One of the four cells was used to assess immiscible mobilization by surfactantflushing on DNAPL impregnated sands at the bottom of the aquifer (Fig. 2). Thefirst treatment step initiated in this cell was “up-welling” PT, described by (Cazaux et al., 2014).“Up-welling” PT consists in pumping groundwater in the central recovery well (HDPE, d = 170 mm), creating a hydraulic pressure decrease, and reinjecting this water at the bottom of the four wells (HDPE, d = 80 mm) located in each corner of the cells, creating a hydraulic pressure increase and a convective hydraulic pressure toward the recovery well. Packers were settled in the injection wells 9 m bgs and water pumping in recovery well was also settled in this horizon to force, as far as possible, water cir-culation at the bottom of the aquifer. The waterflow was fixed around 5 m3h−1. This recirculating configuration aimed at accumulating all free mobile DNAPL in the recovery well equipped with a 2.5 m deep sed-iment trap anchored into the clayey substratum. Therefore, the accumu-lated DNAPL was pumped by a pneumatic device. In one month, free mobile DNAPL was pumped using this up-welling PT technology up to a technical limit (asymptotic recovery was reached) ending thefirst treatment step.
Then surfactantflushing was launched to decrease the residual DNAPL as far as possible. A dosimetric pump for surfactant injection was added to the pumping and reinjection system used for the up-welling PT technique and the waterflow was decreased to 2 m3h−1.
Water table and DNAPL interface variations were measured and record-ed using pressiometric probes (VEGAWELL 52 model).
2.4.2. Surfactant foamflushing
Another cell, also pre-treated by up-welling PT using the technique described above, was used to test SFflushing technology on DNAPL im-pregnated sands at the bottom of the aquifer. The SFflushing treatment consisted in injecting a surfactant solution and gas using the SAG meth-od described in previous articles (Maire et al., 2015; Maire and Fatin-Rouge, 2017). Injection was carried out between 9 and 9.5 m
bgs, which corresponds to the DNAPL impregnated sands layer, using four sleeve pipes and packers. The sleeve pipes were situated around the recovery well, about 3 m from it. Water table and DNAPL interface were measured as reported inSection 2.4.1.
3. Results and discussion 3.1. Lab-scale results 3.1.1. Immiscible mobilization
3.1.1.1.γowchange with surfactant concentration.Fig. 3reports the effect
of surfactant concentration on the lowering theγowbetween DNAPL
and artificial groundwater. The γowwas 34.3 ± 4.8 mN m−1in the
ab-sence of surfactant. Increasing surfactant concentration led to a logarith-micγowdecrease (γow(C) =−22.951 ∗ log(C) + 1.2945, R2= 0.99).
For C = 1.5%, theγow-value could not be measured by the pendant
drop method, because it was too low. It was approximated to be 1 mN m−1.
3.1.1.2. DNAPL extraction as a function of DHSS concentration.Fig. 4 re-ports the DNAPL saturation afterflushing with different surfactant concentrations.
The injection of 10 PV of artificial groundwater without surfactant was equivalent to the PT recovery process. A large amount of DNAPL was released from the DNAPL saturated soil during the recirculation of 4first PV of water. After that, recovery did not change. At the end of this injection, DNAPL saturation (SDNAPL) was 0.33 ± 0.03. This residual
saturation agrees with typical residual saturation observed after a PT treatment, known to be inefficient for total DNAPL removal (Interstate Technology and Regulatory Council, 2002).
Increasing surfactant concentration further decreased SDNAPL. For
each concentration increase, the organic phase was released during thefirst 4 to 6 PV of solution injected then recovery did not further evolve. Experimental data was successfullyfitted by using a logarithmic function:γow(C) =−0.0704 ∗ log(C) + 0.2264 (R2= 0.99). According
to that logarithmic function, at CMC value, SDNAPLshould be lowered to
0.23 without increased dissolution.
Finally, the injection of a solution with a surfactant concentration of 1.5% (above CMC) did not significantly improve DNAPL recovery (SDNAPL
= 0.22 ± 0.04). Moreover, significant DNAPL dissolution began since the outflow's aqueous phase was observed to change from clear to milky brown.
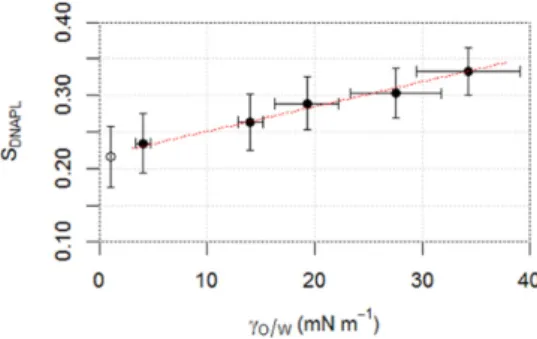
A linear relationship (SDNAPL= 0.0034∗ γow+ 0.2169, R2= 0.99)
was observed betweenγowand equilibrium SDNAPL(Fig. 5). According
to this relationship, SDNAPLis not expected to decrease below 0.217
whenγow= 0. However, theoretically, atγow= 0, all capillary forces
trapping DNAPL droplets should be released, and only solutionflow and buoyancy forces should act on droplets mobilization. In this exper-imental set-up, since the injection is descendant and DNAPLs are denser than water, we would expect a total theoretical DNAPL recovery atγow
= 0. Previous work reported the complete removal of PCE from a soil column mostly by immiscible mobilization using a surfactant solution (Pennell et al., 1996, 1994).γowwas 0.09 mN m−1. However, to reach
such a lowγow, surfactant concentrations above CMC were used in
that work. Authors report that it led to an increase of DNAPL solubility from 200 mg l−1in water to 71,720 mg l−1. Authors also observed the formation of a macroemulsion. In these conditions, it can hardly be com-pared to mobilization when surfactant concentration is below CMC since other mechanisms occur. We assume that the difference we ob-served here is due to the fact that surfactant solution was injected in oil-wet soil, initially fully saturated with DNAPL. Hence surfactant
Fig. 2. Field set-up for surfactantflushing with GW recirculation and SF flushing.
Fig. 3. Variations ofγowwith DHSS concentration in lab-tests. The dotted line is the logarithmicfit of experimental data. γowcould not be measured accurately for [DHSS] = 1.5%.
Fig. 4. Equilibrium DNAPL saturation after flushing with different surfactant concentrations. Dotted line is logarithmicfit of experimental data.
solution must have percolated through the soil with afingering behav-ior (μwaterb μDNAPL) and not all the DNAPL was contacted by surfactant.
This preferential surfactant solutionflow was visually observed by other authors (Jeong, 2005) who studied TCE mobilization by surfactant solu-tion in a glass micromodel (γow~ 5 mN m−1). Because of the
preferen-tial pathways, they were not able to lower DNAPL saturation below 41% after 25 PV of solution injected.
For every surfactant concentration assessed, capillary, bonding, and total trapping numbers (NCa, NBand NT) were calculated (Table 1).
The capillary number relates viscous to capillary forces:
NCa¼ Uμ= γð owcosθÞ ð1Þ
where U is the Darcy's velocity of solution,μ the solution's viscosity and θ the contact angle between the two phases on the solid. Solution vis-cosity was considered to be water's visvis-cosity. The bonding number re-lates buoyancy to capillary forces:
NB¼ Δρgkkrw= γð owcosθÞ ð2Þ
whereΔρ is the density difference between the two phases, g is the gravitational constant, k is the intrinsic permeability of porous medium and krwis the relative permeability of the aqueous solution. The relative
permeability for water was retrieved from desaturation curves on this soil (Colombano et al., 2017). The total trapping number relates viscous and buoyancy forces to the capillary forces acting to retain DNAPL drop-lets. Considering the experimental set-up used at the lab scale, the fol-lowing relationship holds:
NT¼j NBþ NCaj ð3Þ
Pennell et al. (1996)report NCabeing 0.4 to 4.7-fold the value of NB
depending on surfactant formulation. Here, NCais 1.5 to 2.5-fold
superi-or to NBindicating that viscous forces dominate over buoyancy forces
during the experiments.Pennell et al. (1996)showed that a critical value for NT(between 2 × 10⁻⁵and 5 × 10⁻⁵) had to be reached to
ini-tiate DNAPL mobilization. However, their experiments started with an initial SDNAPLof 0.11 (1.0 here); consequently, a correlation between
NTand mobilization at initial SDNAPLN 0.11 cannot be determined from
their work. They report SDNAPLto decrease to 0.10 at NT~ 3 × 10⁻⁵, to
0.04 at NT ~ 10−4and to 0.01 at NT~ 1 × 10⁻³. Here NTincreased by
40-fold with surfactant concentration up to 2.15 × 10⁻⁴. However, SDNAPLonly decreased from 0.33 to 0.22 in the meantime. Thefinal
saturation is higher than that observed by the authors for similar NT.
Hence it seems to confirm the assumption that DNAPL recovery was here limited by preferentialflow of surfactant solution.
By modifying the surfactant formulation, better results could be ob-tained. Some authors used polymer to increase viscous pressure and sweeping efficiency of surfactant solutions to improve DNAPL mobiliza-tion (Longino and Kueper, 1999; Martel, 1998). However, our goal here was not to obtain total DNAPL removal since assessment of zero-valent iron injection was planned after this treatment. The objective was to as-sess whether it was economically interesting to inject a low amount of surfactant before iron injection. Indeed, it did release of a part of the trapped DNAPL and reduce the amount of iron needed. Lab results show that surfactant solution at a concentration near CMC should be used on thefield since it would be able to maximize DNAPL recovery while not dissolving or emulsifying DNAPL. However, since thefinal DNAPL saturation only decreased with log(CS), economic efficiency
de-creases while treatment objectives increase. Therefore, a lower DHSS concentration of 1% was recommended to be used on thefield. 3.1.2. Comparison to otherflushing treatments
This process was compared to results obtained for otherflushing treatments assessed by authors with the same soil and contaminant.
Fig. 6reports the different experiments. Each one is represented by two points: saturation at the beginning and at the end of the experi-ment. Experiments are ordered on the y-axis according to the surfactant consumption. There were slight protocol variations between the exper-imental series, which are reported inTable 2.
As stated before, PT does not require surfactant and reduced SDNAPL
from 1 to 0.33. The high amount of DNAPL being removed with no sur-factant makes this process to seem economical. However, it is inefficient to recover DNAPL droplets trapped in narrow pores by capillary forces. This spread DNAPL residual contaminates groundwater for decades. Hence, PT cannot be considered to be a complete treatment technology. This treatment was used infield preparation, to remove high amount of DNAPL with reduced cost, before more technical treatments were assessed.
Immiscible mobilization by loweringγowwith surfactant
concentra-tion below CMC, further reduced SDNAPLby 33% (0.22) during IM1. This
technology did not require much surfactant (0.10 to 0.46 kg kg−1of re-covered DNAPL) but it was not able to bring DNAPL saturation below 0.22 with these experimental conditions. Results show that viscous forces are too low to allow for good contact with DNAPL, leading to fingering (Jeong and Corapcioglu, 2005) and irreducible DNAPL satura-tion. Moreover, despites its ability to mobilize DNAPL with low surfac-tant consumption, this technology did not receive much interest because gravity will make the released DNAPL to sink. That limits its use to sites where subsurface characterization ensures that uncon-trolled mobilization of DNAPL can be contained. Here, the accurate to-pological characterization of the site geology in the source zone area showed the presence of an impervious clayey substratum on which
Fig. 5. Relationship betweenγowand equilibrium DNAPL saturation.
Table 1
Capillary, bonding, total trapping numbers and DNAPL saturation for lab-scale experiments. [DHSS] (%) 0 0.075 0.15 0.3 0.75 1.5 NCa× 10−6 3.68 4.46 6.58 8.93 31.3 125a NB× 10−6 1.49 2.11 3.34 5.15 20.6 90.0a NT× 10−6 5.17 6.57 9.92 14.1 51.8 215a SDNAPL 0.33 0.30 0.29 0.26 0.23 0.22 a
DNAPL accumulated. Hence, we decided to assess this remediation tech-nology atfield scale.
Higher surfactant concentrations were used at the lab scale to assess “micellar solubilization” technology (MS1 & MS2). Low residual satura-tions were reached for MS1 (0.008), but it required a lot of surfactant (3.9 kg kg−1). Moreover, those results were obtained in a favorable set-up. The 1D column was held vertical and injection was ascendant, meaning that surfactant solution was forced to circulate through the DNAPL even if the DNAPL sunk. This treatment was also assessed with horizontal injection to better mimicfield conditions (MS2). At surfac-tant contact, DNAPL residual quickly sunk down to the bottom of the cell, where it formed a DNAPL pool. This is a known drawback of micel-lar solubilization: the dissolution process is the most efficient at high surfactant concentration (CS), but it also extremely reducesγow, causing
an uncontrolled downward migration of DNAPL. After the DNAPL pool formed, a surfactant solution was circulating at the top of the cell. The exchange surface between DNAPL and the surfactant solution was lim-ited to the pool surface. Hence, dissolution efficiency was much lower: surfactant consumption was 14 kg kg−1to reach a DNAPL saturation of 0.02. A review of data fromfield applications even reports surfactant consumptions up to 200 kg kg−1of DNAPL removed (Atteia et al., 2013). This costly and risky process was not assessed at thefield scale. Different types of foam were assessed. Thefirst type was premade before injection. They required a high pressure gradient (1.02 MPa m−1) to propagate into the soil but DNAPL extraction was ex-cellent (Final SDNAPL= 0.008) with the lowest surfactant consumption
(0.009 kg kg−1). This is by far the most efficient process. Other advan-tages were: 1) no excessive DNAPL dissolution since CS~ CMC, 2) low
volume of solution at outflow and 3) fast and controlled foam propaga-tion with low sensitivity to soil anisotropy (Khatib et al., 1988).
However, such high pressure gradients cannot be used in shallow soils since it may lead to soil fracturing and heaving. SAG foam was used next since its propagation required a lower pressure gradient. Un-fortunately, process performance was shown to be directly dependent on injection pressure, demonstrating that viscous pressure is a critical parameter for DNAPL recovery (Maire and Fatin-Rouge, 2017). Foam injected with a pressure gradient of 90 kPa m−1brought DNAPL satura-tion down to 0.08 with a surfactant consumpsatura-tion of 0.15 kg kg−1. Sur-factant consumption was similar to the immiscible mobilization process while the lowerfinal DNAPL saturation was reached when foam was used. As visually observed in micromodels (Jeong and Corapcioglu, 2005), loweredγowis not sufficient for DNAPL removal.
The viscosity of the injectedfluid should also be high to limit preferen-tialflow and increase DNAPL removal. Foam does not only reduce γow.
In addition, pore throats blocked by lamellae give foam an important
apparent viscosity (up to billion times the gas viscosity alone). High vis-cosity foam is needed for high DNAPL removal; however, it requires high pressure to propagate. Therefore, low∇P SFF cannot be considered as a self-sufficient process to achieve remediation since final SDNAPLis
still high.
A hybrid technology was then developed for shallow soils where high pressure foam cannot be used (Maire and Fatin-Rouge, 2017). It combines two treatments. First, low pressure foam is injected to ef fi-ciently recover a major part of the DNAPL. Then, a micellar solubilization treatment is applied by injecting high concentration surfactant into the volume of soil occupied by foam. It led to afinal DNAPL saturation of 0.01, like micellar solubilization. It gets the benefits of the foam process listed above. Moreover, during the second part of the treatment, foam was demonstrated to enhance micellar solubilization. Gas bubbles cre-ated in pore bodies during foam injection reduced the DNAPL relative permeability. It prevented droplets from falling, since as shown by
Pennell et al. (1996), gravity forces have less effect on DNAPL mobiliza-tion when permeability is reduced. Since DNAPL did not sink, it main-tained a high exchange surface with the solubilizing solution. DNAPL dissolution was fast and efficient. Surfactant consumption was N10 times lower (1.04 kg kg−1) than for micellar solubilization treatment.
The downside of the foam technology is the critical tuning needed for injection parameters and formulation to get the highest foam viscos-ity while maintaining the injection pressure below soil's maximal ad-missible pressure (Maire et al., 2015; Maire and Fatin-Rouge, 2017). Both are required to ensure the best DNAPL extraction without risk of soil fracturing and heaving.
The foam process was selected to be assessed atfield-scale. Low pressure SFF was used (SAG). However, the selected process to com-plete DNAPL elimination was not micellar solubilization. As for the field cells where immiscible mobilization was assessed, we decided to complete COC's removal using zero valent iron.
To summarize, experimental data for mobilization experiments were added tofigures from a previous publication (Maire and Fatin-Rouge, 2017) (Fig. 7). These and previous results from authors are plot-ted against a theoretical curve (Lake, 1989). It relatesfinal SDNAPLto
cap-illary number. Though different treatment processes were involved, all those points (except hybrid treatment where micellar solubilization was involved) can be joined and show the same trend as the theoretical curve. Final DNAPL saturation shows to be a logarithmic function of cap-illary number. The shift observed between the theoretical curve and ex-perimental data is due to different pore size distribution (Lake, 1989). First PT treatment is ineffective at reaching DNAPL saturation below 0.3. It is unable to release trapping forces in thefiner pores. Residual sat-uration can be lowered by loweringγow(increase NCa), but residual
Table 2
Experimental conditions.
Experiment Column orientation Surfactant Injection mode Injection velocity (m s−1) ▽P (kPa m−1) Reference Micellar solubilization (MS) MS1
1D, horizontal Tergitol 15-S-9 10% No foam, constantflow 5.0 × 10⁻⁵ 1.3a
(Maire and Fatin-Rouge, 2017)
MS 2 1D, vertical, ascendant flow
Tergitol 15-S-9 5% No foam, constantflow 6.7 × 10⁻⁴ 17a (Maire et al., 2015)
Low P SFF + MS 1D, horizontal DHSS 4% then Tergitol 15-S-9 10%
SAG, constant pressure Variable 90 (Maire and Fatin-Rouge, 2017)
Immiscible mobilization IM 1
1D, vertical, descendant flow
DHSS, 1.2% No foam, constantflow 1.3 × 10⁻⁴ 3.1a
This work IM 2 1D, vertical, ascendant
flow
CAPB/SDS 9:1 0.05% No foam, constantflow 6.7 × 10⁻⁴ 17a (Maire et al., 2015)
Low P SFF 1D, horizontal DHSS 4% SAG, constant pressure Variable 90 (Maire and Fatin-Rouge, 2017)
High P SFF 1D, vertical, ascendant flow
CAPB/SDS 9:1 0.05% Premade foam FQ = 95%, constantflow
6.7 × 10⁻⁴ 1020 (Maire et al., 2015) PT 1D, vertical, descendant
flow
No surfactant No foam, constantflow 1.3 × 10⁻⁴ 3.1a This work
a
saturation remains above 0.2. To further increase NCaand decrease
SDNAPL, with comparableγowreduction, the viscosity of the injected
fluid must be increased. Low pressure foam with moderate viscosity can lower SDNAPLto 0.08. To reach almost complete DNAPL removal,
more viscous foam can be injected, lowering SDNAPLto 0.01. When
shal-low soil is contaminated, shal-low pressure foam can be folshal-lowed by micellar solubilization to reach 0.01 saturation.
3.2. Field-scale results
3.2.1. Flushing with groundwater and with surfactant solutions
Fig. 8describes the evolution ofγowand the water/DNAPL interface
altitude in the recovery well as a function of the volume of water reinjected (VP).
Pore volume was estimated at 180 m3considering a measured po-rosity of 20%. The initial DNAPL thickness in the cell was around 55 cm above clayey substratum (average thickness of the 4 piezometers and the recovery well). The estimated amount of DNAPL in the cell was 10 m3.
According to lab results, 6.6 m3of DNAPL should have been pumped
during up-welling PT. However, only 1 m3of DNAPL was recovered. One
cause could be the aclinic substratum topography. Indeed, preliminary geophysical data and drillings showed high frequency variations in the substratum altitude. The difference of clayey substratum altitude be-tween the four corners of the cell was about 30 cm. Moreover, the recov-ery well was not located in the deepest part of the cell. Therefore, it is difficult to be sure that all DNAPL was pumped as DNAPL could have moved preferentially near to piezometer B where the clay altitude was the lowest and which was further from the recovery well than A or D piezometers (Fig. 2).
Afirst injection of 200 l of surfactant was done at 0.08% volumet-ric concentration for 1.7 PV. The concentration was lower than lab recommendations because of high surfactant viscosity in field
conditions, which limited its injectionflow. γowdecreased from
37.2 to 15 mN m−1whereas no significant evolution of DNAPL thick-ness was observed in the recovery well.γowwas lowered more than
expected from lab work for this surfactant concentration, probably because of differences in ionic composition of water. After surfactant injection, recirculation was maintained. One PV later after surfactant injection stopped,γowslowly increased. It was attributed to
degra-dation/dilution/adsorption processes. However, at the same time, DNAPL thickness started to increase continuously in sediment trap.
The inertia observed between the end of surfactant injection and the beginning of DNAPL accumulation in the sediment trap can be ex-plained by preferentialflow of surfactant solution in the cell. Even if packers had been installed in the lowest part of the 4 piezometers, those were screened from the bottom up to 4 m depth andfilling mate-rials between tube and aquifer allowed surfactant to pass through upper aquifer layer, which was more permeable. This low surfactant solution velocity in the deepest layer might haves caused two effects: 1)γow
de-creased more slowly in the deepest strata than the upper one and DNAPL might not have been totally contacted by surfactant solution. 2) Water velocity was too low in the deepest strata to push the released DNAPL ahead to the recovery well.
A second surfactant injection phase (200 l) was carried out at 0.5% volumetric concentration after 6.5 PV recirculation, to theoreti-cally lowerγowto 8 mN m− 1(Fig. 3).γowimmediately decreased
after starting this new injection. However,γowdid not decrease
below 15 mN m− 1. This value was identical to thefirst injection, even if surfactant concentration was doubled. Inefficiency of the second injection to lowerγowcould be due to a decrease of water's
salinity during recirculation. Initially, water between 0 and−8 m had an average conductivity of 1.4 mS cm−1, while average conduc-tivity was 3.3 mS cm−1between−8 and −10 m. Water was pumped around−9 m. Hence, water reinjected initially had a higher salinity helping forγowreduction. Then, because of water recirculation in all
cellule height, salinity could have been averaged by mixing. This decrease of salinity in theflushed layer could have decreased the efficiency of surfactant flushing test.
After 10 PV, DNAPL thickness in recovery well has continuously in-creased up to 1.5 m above the initial height. It represents 35 l of DNAPL accumulated in the sediment trap. The surfactantflushing test had to be stopped after 10 PV, but the DNAPL thickness in the recovery well was still increasing.
As the second surfactant injection was launched while the effect of thefirst trial had not finished, the effect of the second injection cannot be clearly discriminated from the effect of thefirst injection. Hence, we might suppose that the 35 l of DNAPL recovered were only due to thefirst 200 l of surfactant injected. The surfactant consumed would be in that case: 3.12 kg kg−1. But for all reasons described in the above discussion, it cannot be clearly established that all surfactant flushed the entire volume of impregnated soil and that all DNAPL re-leased was captured by the recovery well. Hence, this consumption is probably overestimated.
At the end of the surfactantflushing test, no DNAPL was observed in the injection wells. However, soil cores that were drilled in the cell re-vealed the presence of DNAPL droplets at sampling points (Fig. 2).
Laboratory results predicted a residual SDNAPLof 0.27 ifγow
de-creased to 15 mN m−1. Theoretically, 0.6 m3of DNAPL were expected
to be released and accumulated near the recovery well. However, only 35 l were collected (1.2% of the expected amount). This amount is prob-ably underestimated since tests had to be stopped though DNAPL was still accumulating in the sediment trap. However, it seems hardly cred-ible that it could have reached 0.6 m3.
This low recovery probably has the same causes as the delay betweenγowdecrease and DNAPL accumulation. In addition, another
hypothesis could be that significant DNAPL volume could have been released by interfacial tension decrease but, as for PT, released residual might have turned into pools in topographic recesses.
Fig. 7. SDNAPLvs. NCafor mobilization experiments using water alone, surfactant solution, low and high▽P foams and low ▽P foam completed by micellar solubilization. Curve is theoretical data from (Lake, 1989).
Fig. 8. Evolution of DNAPL height in the recovery well (full line) and interfacial tension (dashed line) duringfield SEAR.
Finally, methodologic differences between lab- andfield-scales could explain moderate success on thefield. Lab experimentation was performed in 1D with recent pollution of sieved and disturbed soil. Even though permeability was similar, porosity was higher than for un-disturbed soil. Hence, capillary forces trapping the DNAPL were lower and the later might have been easier to mobilize, but it should not have impacted results to such an extent and, as stated before, numerous factors changed when upscaling from a 1-D model soil column to a 3-D pilot scale in real conditions.
The high frequency variation of clayey substratum could be a limit of the test and of the surfactantflushing application. More technical limi-tations (bad control of solutionflow) could be addressed with an adapted injection set-up.
3.2.2. Flushing with surfactant foams
In this cell, the estimated amount of DNAPL initially in place was 8.3 m3. During up-welling PT, 7.6 m3was recovered.Fig. 9shows how
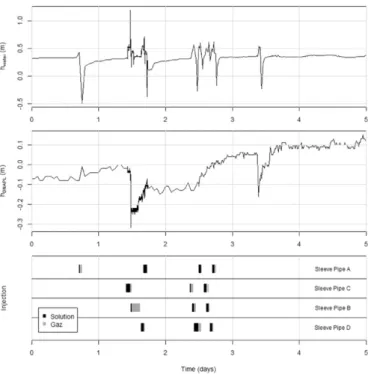
the pressiometric probe signals changed in the recovery well during the foam injection test. The probes signals seem to be correlated with the different injection phases (liquid and gas) and with the injection cy-cles. Probe signal recordings showed varying water table and DNAPL in-terface height during injections that then stabilized until the next injection cycle. The same trend was observed in every piezometer.
The variations in pressure measured by sensors seem to indicate foam formation. Indeed, those sensors measure the water pressure head at two depths to monitor the water table and DNAPL heights (based on density). Since the foam is less dense than water the pressure above the sensor should decrease when it reaches the recovery well. So, pressure sensors should register decreases in water table and DNAPL height. We assume that is what we observed here in the recovery well. Indeed, the foam injection in tube A during day 1 did influence the water table signal briefly but did not influence the DNAPL height sig-nal. Therefore, we assume that foam had not reached the recovery well yet, and that only non-stabilized gas had. By contrast, during day 2, the injection in pipe C caused a substantial pressure reduction as measured by the two sensors. We concluded that foam had reached the recovery well since the very low foam density (~ 100 kg m−3) strongly affects the pressure sensors measurements. The way the signal slowly returned
to the baseline between days 2 and 3 could indicate foam destabilization in wells and/or DNAPL accumulation. When injections started again on day 3, the pressure recorded by the deepest sensors gradually increased. At the end (day 5), the pressure sensed by the deepest sensor was higher than the initial pressure. We assume that this is because of the presence of DNAPL in the recovery well. However, a mix of DNAPL, water and foam must coexist in the well, and because of the foam's low density, we assume that the amounts of DNAPL calculated from the pressure measurements are substantially underestimated. There-fore, it appears that pressure measurements were not pertinent to quantify mobilized DNAPL during SFF. Those measurements should be confirmed by direct measurements of DNAPL heights using bailers.
In the cell used to assess surfactantflushing, no foam was injected, only solution. There, pressure data did not show significant water table variations. This emphasizes the assumption that the signal peaks observed here are due to gas and foam reaching the wells. These data are also correlated with visual observations of foam exiting wells during foam injection.
Sleeve pipes were drilled half way between the cell's walls and the recovery well (Fig. 2). Since foam is known to develop radially around injection wells, DNAPL was pushed by foam not only to the recovery well but also to the cell's corners. Even if pressure measurements are not pertinent enough for quantitative measurement, pressure sensors indicated that DNAPL height increased by 15 cm in PzA, 1 cm for PzB, and 6 cm for PzB and PP. That agrees with substratum topography. PzD and PzA were the deepest points known in the cell. So, this indicates that DNAPL accumulated at the deepest points of the cell. The sleeve pipes positioning was not optimal for DNAPL gathering in the central re-covery well.
Moreover, for technical reasons, it was not possible to inject into all four sleeve pipes simultaneously to gather DNAPL in the recovery well and piezometers. We injected into the sleeve pipes two by two. That means that mobilized DNAPL movement could not be controlled to make it converge to extraction points. It probably moved back and forth as injections happened in different sleeve pipes. These set-up flaws should be addressed to maximize DNAPL recovery.
In spite of that, we did observe process efficiency in the field. Core soil samples were obtained three weeks after the foam injection test, at various points of the cell. Foam was observed in the soil samples (Fig. 10) and at various depths, specifically in the targeted sand layer but also in the upper sandy gravel layer. This proved that injection with the SAG method successfully formed foam in thefine sand strata that was the treatment's target. The presence of foam in soil three weeks after injection also proved that the foam had a relatively long life-time in the soil.
Finally, whereas DNAPL droplets were still visible at the bottom of soils cores in the cell treated by surfactantflushing, no DNAPL droplets were seen in the cores drilled in the cell treated by SFF (Fig. 10). This might indicate that the foam was effectively able to push the DNAPL droplets, as observed at the laboratory scale.
Fig. 9. Variation of the water table level and DNAPL interface level in the recovery well during the foam injection test. The spike during day 3 is due to water injection for pipes
After this foam injection, we plan zero-valent iron injection. It should benefit from the persistent presence of foam, as was observed for solubilization (Maire and Fatin-Rouge, 2017). Foam gas bubbles re-duced permeability in thefine sand strata and the sand and gravel strata above. This should help with targeting iron's delivery to thefine sand strata.
4. Conclusions
Immiscible mobilization and surfactant foamflushing for the recov-ery of DNAPL residual were compared at lab- andfield-scales and showed very different behaviors. Well-controlled conditions in lab ex-periments improved our understanding of the phenomena involved in DNAPL residuals recovery and the associated risks. For immiscible mo-bilization, despites the benefits of γowreduction and decreasing
capil-lary trapping of DNAPL, the substantial residual limit saturation (~0.2) seems hard to overcome in the absence of solubilization. This limit would be the result offingering and surfactant's preferential flow paths due to its insufficient viscosity. By contrast, surfactant foam flush-ing showed high efficiency since viscous forces where high while γowis
decreased. Thefinal residual DNAPL saturation decreased with log(▽P) or log(NCa).
However, the optimal results obtained in well-controlled conditions do not reflect the DNAPL recoveries in field-tests. The gap between lab-andfield-tests results from poor understanding of local characteristics atfield-scale and of technologies used. These demand expertise, specific equipment and modelling. Moreover,field-tests also require time and monitoring to reach optimal conditions.
The use of immiscible mobilization in real conditions requires the preliminary characterization of substratum properties (at least topology and downward hydraulic conductivity) to set recovery wells at the low-est topographic points and anticipate and prevent complications. More-over, stratification phenomena (geological and hydrodynamical) induce preferential pathways for theflushing fluid and reduce the treatment efficiency. In contrast, SF flushing was shown to be less sensitive to het-erogeneity. However, it requires modelling for the propagation of SAG foams to set up an efficient design for the recovery of the displaced DNAPL.
Acknowledgements
This project was carried out as a part of the SILPHES project funded by the French Environmental Agency (ADEME).
Special recognition is made to Roger Jacquet for his assistance and discussions throughout this project. Additional thanks to Aurélien Triger from Sol Environment for his technical contribution.
References
Académie des Sciences, 2000. Pollution localisée des sols et sous-sols par les hydrocarbures et solvants chlorés. Ed TEC & DOC.
Ahn, C.K., Kim, Y.M., Woo, S.H., Park, J.M., 2007. Selective adsorption of phenanthrene dis-solved in surfactant solution using activated carbon. Chemosphere 69:1681–1688.
http://dx.doi.org/10.1016/j.chemosphere.2007.06.018.
Ahn, C.K., Kim, Y.M., Woo, S.H., Park, J.M., 2008. Soil washing using various nonionic sur-factants and their recovery by selective adsorption with activated carbon. J. Hazard. Mater. 154:153–160.http://dx.doi.org/10.1016/j.jhazmat.2007.10.006.
Ahn, C.K., Woo, S.H., Park, J.M., 2010. Selective adsorption of phenanthrene in nonionic-anionic surfactant mixtures using activated carbon. Chem. Eng. J. 158:115–119.
http://dx.doi.org/10.1016/j.cej.2009.12.014.
Atteia, O., Del Campo Estrada, E., Bertin, H., 2013. Soilflushing: a review of the origin of efficiency variability. Rev. Environ. Sci. Biotechnol. 12:379–389.http://dx.doi.org/ 10.1007/s11157-013-9316-0.
Bertin, H.J., Apaydin, O.G., Castanier, L.M., Kovscek, A.R., 1998. Foamflow in heteroge-neous porous media: effect of crossflow. Soc. Pet. Eng. 4.http://dx.doi.org/10.2118/ 56009-PA.
Blaker, T., Aarra, M.G., Skauge, A., Rasmussen, L., Celius, H.K., Martinsen, H.A., Vassenden, F., 2002. Foam for gas mobility control in the Snorre field: the FAWAG project. SPE Reserv. Eval. Eng. 5:317–323.http://dx.doi.org/10.2118/78824-PA.
Butler, E.C., Hayes, K.F., 1998. Micellar solubilization of nonaqueous phase liquid contam-inants by nonionic surfactant mixtures: effects of sorption, partitioning and mixing. Water Res. 32:1345–1354.http://dx.doi.org/10.1016/S0043-1354(97)00360-6. Cazaux, D., Colombano, S., Joubert, A., Dumestre, A., Lecuelle, G., 2014.Optimized physical
recovery of DNAPL using upwelling technique and geostatistical analysis at largefield scale. BATTELLE Chlorinated Conference Proceedings, Monterey, California, USA.
Colombano, S., Davarzani, H., van Hullebusch, E.D., Ignatiadis, I., Huguenot, D., Guyonnet, D., Deparis, J., 2017.Drainage-imbibition tests and pumping of heavy chlorinated sol-vents in saturated porous media: measurements and modeling of the effects of ther-mal and chemical enhancement. AquaConSoil Conference, June 26–30 2017, Lyon, France.
Damrongsiri, S., Tongcumpou, C., Weschayanwiwat, P., Sabatini, D.A., 2010. Solubilization of dibutyltin dichloride with surfactant solutions in single and mixed oil systems. J. Hazard. Mater. 181:1109–1114.http://dx.doi.org/10.1016/j.jhazmat.2010.05.129. Duffield, A.R., Ramamurthy, R.S., Campanelli, J.R., 2003. Surfactant enhanced mobilization
of mineral oil within porous media. Water Air Soil Pollut. 143:111–122.http:// dx.doi.org/10.1023/A:1022829204883.
Farajzadeh, R., Eftekhari, A.A., Hajibeygi, H., 2015. Simulation of instabilities and fingering in surfactant alternating gas (SAG) foam enhanced oil recovery. SPE Reserv. Simul. Symphttp://dx.doi.org/10.2118/173193-MS.
Hildenbrand, Z.L., Carlton, D.D., Fontenot, B.E., Meik, J.M., Walton, J.L., Taylor, J.T., Thacker, J.B., Korlie, S., Shelor, C.P., Henderson, D., Kadjo, A.F., Roelke, C.E., Hudak, P.F., Burton, T., Rifai, H.S., Schug, K.A., 2015. A comprehensive analysis of groundwater quality in the Barnett Shale region. Environ. Sci. Technol. 49:8254–8262.http://dx.doi.org/ 10.1021/acs.est.5b01526.
Hildenbrand, Z.L., Carlton, D.D., Fontenot, B.E., Meik, J.M., Walton, J.L., Thacker, J.B., Korlie, S., Shelor, C.P., Kadjo, A.F., Clark, A., Usenko, S., Hamilton, J.S., Mach, P.M., Verbeck, G.F., Hudak, P., Schug, K.A., 2016. Science of the total environment temporal variation in groundwater quality in the Permian Basin of Texas, a region of increasing uncon-ventional oil and gas development. Sci. Total Environ. 562:906–913.http:// dx.doi.org/10.1016/j.scitotenv.2016.04.144.
Hirasaki, G.J., Miller, C.A., Szafranski, R., Lawson, J.B., Akiya, N., 1997. Surfactant/foam pro-cess for aquifer remediation. Proceedings of International Symposium on Oilfield Chemistry. Society of Petroleum Engineershttp://dx.doi.org/10.2118/37257-MS. Hydraulic Fracturing Technology Technology Evaluation Report.
Interstate Technology and Regulatory Council, 2002.DNAPL Source Reduction: Facing the Challenge. Interstate Technology and Regulatory Council.
Ireland Environmental Protection Agency, 2014.Drinking Water Parameters: Microbio-logical, Chemical and Indicator Parameters in the 2014 Drinking Water Regulations.
Jeong, S.-W., 2005. Evaluation of the use of capillary numbers for quantifying the removal of DNAPL trapped in a porous medium by surfactant and surfactant foamfloods. J. Colloid Interface Sci. 282:182–187.http://dx.doi.org/10.1016/j.jcis.2004.08.108. Jeong, S.-W., Corapcioglu, M.Y., 2005. Force analysis and visualization of NAPL removal
during surfactant-relatedfloods in a porous medium. J. Hazard. Mater. 126:8–13.
http://dx.doi.org/10.1016/j.jhazmat.2005.06.015.
Khatib, Z.I., Hirasaki, G.J., Falls, a.H., 1988. Effects of capillary pressure on coalescence and phase mobilities in foams flowing through porous media. SPE Reserv. Eng. 3: 919–926.http://dx.doi.org/10.2118/15442-PA.
Kilbane, J.J., Chowdiah, P., Kayser, K.J., Misra, B., Jackowski, K.A., Srivastava, V.J., Sethu, G., Nikolov, D.T., Hayes, T.D., 1997.Remediation of contaminated soils using foams. L. Contam. Reclam. 5, 41–54.
Kovscek, A.R., Radke, C.J., 2009. Fundamentals of foam transport in porous media. In: Schramm, L.L. (Ed.), Foams: Fundamentals and Applications in the Petroleum Indus-try. American Chemical Society, Washington, DC:pp. 115–163http://dx.doi.org/ 10.1021/ba-1994-0242.ch003.
Lake, L.W., 1989.Enhanced Oil Recovery. Prentice Hall.
Lee, M., Kang, H., Do, W., 2005. Application of nonionic surfactant-enhanced in situ flush-ing to a diesel contaminated site. Water Res. 39:139–146.http://dx.doi.org/10.1016/ j.watres.2004.09.012.
Li, Y., Abriola, L.M., Phelan, T.J., Ramsburg, C.A., Pennell, K.D., 2007. Experimental and nu-merical validation of the total trapping number for prediction of DNAPL mobilization. Environ. Sci. Technol. 41:8135–8141.http://dx.doi.org/10.1021/es070834i. Longino, B.L., Kueper, B.H., 1999. Effects of capillary pressure and use of polymer solutions
on dense, non-aqueous-phase liquid retention and mobilization in a rough-walled fracture. Environ. Sci. Technol. 33:2447–2455.http://dx.doi.org/10.1021/es980752h. Maire, J., Fatin-Rouge, N., 2017. Surfactant foamflushing for in situ removal of DNAPLs in shallow soils. J. Hazard. Mater. 321:247–255. http://dx.doi.org/10.1016/ j.jhazmat.2016.09.017.
Maire, J., Coyer, A., Fatin-Rouge, N., 2015. Surfactant foam technology for in situ removal of heavy chlorinated compounds-DNAPLs. J. Hazard. Mater. 299:630–638.http:// dx.doi.org/10.1016/j.jhazmat.2015.07.071.
Martel, R., 1998. Laboratory study of polymer solutions used for mobility control during in situ NAPL recovery. Ground Water Monit. Remediat. 18:103–113.http://dx.doi.org/ 10.1111/j.1745-6592.1998.tb00734.x.
Martel, R., Gelinas, P.J., Desnoyers, J.E., Masson, A., 1993. Phase diagrams to optimize sur-factant solutions for oil and DNAPL recovery in aquifers. Groundwater 31:789–800.
http://dx.doi.org/10.1111/j.1745-6584.1993.tb00852.x.
Muggeridge, A., Cockin, A., Webb, K., Frampton, H., Collins, I., Moulds, T., Salino, P., 2013. Recovery rates, enhanced oil recovery and technological limits. Philos. Trans. R. Soc. A Math. Phys. Eng. Sci. 372.http://dx.doi.org/10.1098/rsta.2012.0320.
National Research Council, 1994.Alternatives for Ground Water Cleanup (Washington, DC).
Oostrom, M., Hofstee, C., Walker, R.C., Dane, J.H., 1999. Movement and remediation of tri-chloroethylene in a saturated heterogeneous porous medium. 1. Spill behavior and initial dissolution. J. Contam. Hydrol. 37:159–178. http://dx.doi.org/10.1016/S0169-7722(98)00153-3.
Paria, S., 2008. Surfactant-enhanced remediation of organic contaminated soil and water. Adv. Colloid Interf. Sci. 138:24–58.http://dx.doi.org/10.1016/j.cis.2007.11.001. Pennell, K.D., Jin, M., Abriola, L.M., Pope, G.A., 1994. Surfactant enhanced remediation of
soil columns contaminated by residual tetrachloroethylene. J. Contam. Hydrol. 16: 35–53.http://dx.doi.org/10.1016/0169-7722(94)90071-X.
Pennell, K.D., Pope, G.A., Abriola, L.M., 1996. Influence of viscous and buoyancy forces on the mobilization of residual tetrachloroethylene during surfactantflushing. Environ. Sci. Technol. 30:1328–1335.http://dx.doi.org/10.1021/es9505311.
Rathfelder, K.M., Abriola, L.M., Singletary, M.A., Pennell, K.D., 2003. Influence of surfactant-facilitated interfacial tension reduction on chlorinated solvent migration in porous media: observations and numerical simulation. J. Contam. Hydrol. 64: 227–252.http://dx.doi.org/10.1016/S0169-7722(02)00205-X.
Robert, T., Martel, R., Conrad, S.H., Lefebvre, R., Gabriel, U., 2006. Visualization of TCE re-covery mechanisms using surfactant-polymer solutions in a two-dimensional hetero-geneous sand model. J. Contam. Hydrol. 86:3–31.http://dx.doi.org/10.1016/ j.jconhyd.2006.02.013.
Rosen, M.J., 2004.Surfactants and Interfacial Phenomena. 3rd ed. Wiley-Interscience, Ho-boken, New Jersey.
Sabatini, D.A., Harwell, J.H., Hasegawa, M., Knox, R., 1998. Membrane processes and surfactant-enhanced subsurface remediation: results of afield demonstration. J. Membr. Sci. 151:87–98.http://dx.doi.org/10.1016/S0376-7388(98)00170-7. Salehi, M.M., Safarzadeh, M.A., Sahraei, E., Nejad, S.A.T., 2014. Comparison of oil removal
in surfactant alternating gas with water alternating gas, waterflooding and gas
flooding in secondary oil recovery process. J. Pet. Sci. Eng. 120:86–93.http:// dx.doi.org/10.1016/j.petrol.2014.05.017.
Scherer, M.M., Richter, S., Valentine, R.L., Alvarez, P.J.J., 2000. Chemistry and microbiology of permeable reactive barriers for in situ groundwater clean up. Crit. Rev. Microbiol. 26:221–264.http://dx.doi.org/10.1080/10408410091154237.
Shokrollahi, A., Ghazanfari, M.H., Badakhshan, A., 2014. Application of foamfloods for en-hancing heavy oil recovery through stability analysis and coreflood experiments. Can. J. Chem. Eng. 92:1975–1987.http://dx.doi.org/10.1002/cjce.22044.
Stroo, H.F., Leeson, A., Marqusee, J.A., Johnson, P.C., Ward, C.H., Kavanaugh, M.C., Sale, T.C., Newell, C.J., Pennell, K.D., Lebrón, C.A., Unger, M., 2012. Chlorinated ethene source re-mediation: lessons learned. Environ. Sci. Technol. 46:6438–6447.http://dx.doi.org/ 10.1021/es204714w.
Szafranski, R., Lawson, J.B., Hirasaki, G.J.H., Miller, C.A., Akiya, N., King, S., Jackson, R.E., Meinardus, H., Londergan, J.T., 1998. Surfactant/foam process for improved efficiency of aquifer remediation. Progr. Colloid Polym. Sci. 111:162–167.http://dx.doi.org/ 10.2118/37257-MS.
Taylor, T.P., Pennell, K.D., Abriola, L.M., Dane, J.H., 2001. Surfactant enhanced recovery of tetrachloroethylene from a porous medium containing low permeability lenses. J. Contam. Hydrol. 48:325–350.http://dx.doi.org/10.1016/S0169-7722(00)00185-6. WHO, 2010. Guidelines for indoor air quality. WHO Guidelineshttp://dx.doi.org/10.1186/