Publisher’s version / Version de l'éditeur:
Canadian Journal of Chemistry, 48, 2, pp. 287-297, 1970-01-01
READ THESE TERMS AND CONDITIONS CAREFULLY BEFORE USING THIS WEBSITE.
https://nrc-publications.canada.ca/eng/copyright
Vous avez des questions? Nous pouvons vous aider. Pour communiquer directement avec un auteur, consultez la première page de la revue dans laquelle son article a été publié afin de trouver ses coordonnées. Si vous n’arrivez pas à les repérer, communiquez avec nous à PublicationsArchive-ArchivesPublications@nrc-cnrc.gc.ca.
Questions? Contact the NRC Publications Archive team at
PublicationsArchive-ArchivesPublications@nrc-cnrc.gc.ca. If you wish to email the authors directly, please see the first page of the publication for their contact information.
NRC Publications Archive
Archives des publications du CNRC
This publication could be one of several versions: author’s original, accepted manuscript or the publisher’s version. / La version de cette publication peut être l’une des suivantes : la version prépublication de l’auteur, la version acceptée du manuscrit ou la version de l’éditeur.
Access and use of this website and the material on it are subject to the Terms and Conditions set forth at
Length change-absorption relations for the water-porous glass system
to -40 deg C
Feldman, R. F.
https://publications-cnrc.canada.ca/fra/droits
L’accès à ce site Web et l’utilisation de son contenu sont assujettis aux conditions présentées dans le site LISEZ CES CONDITIONS ATTENTIVEMENT AVANT D’UTILISER CE SITE WEB.
NRC Publications Record / Notice d'Archives des publications de CNRC:
https://nrc-publications.canada.ca/eng/view/object/?id=cf9251d6-e654-4829-aa93-2ac77a23b3c2 https://publications-cnrc.canada.ca/fra/voir/objet/?id=cf9251d6-e654-4829-aa93-2ac77a23b3c2Length change
-
adsorption relations for the water -porous glass system to -40
"C1
R. F. FELDMANDivision of Building Research, National Researcl~ Council of Canada, Ottatva, Canada
Received August 19, 1969
Adsorption of water has been studied extensively above 0 "C, but the problem of the phase transition of adsorbates in porous materials is presented at temperatures below 0 "C. Experiments that show how phase transitions modify length change - adsorption relationships are described.
Adsorption - length change measurements from - 40 to - 0.5 and isotherms at - 20 and - 0.5 "C were obtained. In another group of experiments different forms of isosteres were also obtained; the principle that water should be allowed t o enter the sample at the low temperature was usually followed. Isotherms and length change - adsorption characteristics below 0 "C are qualitatively similar to those above 0 "C, but a decrease in adsorptive capacity and length change was observed. These results and those obtained from the isosteres lead to the conclusion that capillary condensation and menisci theories are operative and that a solid meniscus exists. I t follows therefore that the saturated vapor pressure of frozen adsorbate is greater than that of bulk ice and that its volumetric expansion on freezing is similar to the bulk phase transition. I t is shown how these phenomena can predict migration of water and generation of pressure within the porous body when it is subjected to cooling and warming cycles.
Canadian Journal of Chemistry, 48,287 (1970)
Adsorption of water and corresponding length change by a number of porous materials (I) have been studied at the Division of Building Research, National Research Council. All previous work was done at normal room temperature condi- tions. Experiments at temperatures below the bulk freezing point are now described.
Adsorption of water at temperatures below 0 "C introduces the problem of the phase transi- tion of adsorbates in porous materials. Unaer- standing of these phenomena can be improved by considering experiments that show how phase transitions modify length change - adsorption relations.
Studies of the freezing of adsorbates (2, 3) present evidence both for and against the theory of capillary condensation and thus for and against explanations of the hysteresis exhibited by adsorption isotherms and the features of expan- sion isotherms (4) based on capillary condensa- tion theory. Other workers (2,5-8) have measured length change during cooling and warming of porous bodies containing different adsorbates and some (7,8), mainly with water as adsorbate, have correlated these length changes with specific heat measurements.
The present experiments include adsorption -
length change measurements from -40 to -0.5 "C and isotherms at -20 and -0.5 "C. In another group of experiments, different forms of isosteres were obtained; in most of these, the water was allowed to adsorb into the sample at
l N R C C No. 11 087.
the low temperature because it was thought that an equilibrium state might be obtained in this way and that other effects, such as migration of water and stresses during freezing, were more likely to occur when cooling had taken place after water had been allowed to enter the sample.
Experimental
Apparatus
A gravimetric adsorption apparatus with metal valves and neoprene O-rings was used. The spiral had a sensi- tivity of 30 cm/g; the extensometer was a modified Tuckerman gauge (7) of sensitivity 2 x lo-=, as cali- brated by the manufacturer. This particular instrument was made of Invar of low thermal expansion, 0.9 x
deg-l. This value was taken into account in the calculation of results.
The volume of the separate cell in which the exten- someter was placed was approximately 200 ml. Pressure was measured by means of a Texas Instruments Bourdon type gauge sensitive t o 1 p. Temperature control of the alcohol baths was maintained to k0.02 "C by propor- tional controllers.
Material
Porous glass (No. 7930) was supplied by Corning Glass Works in the form of 2.5 cm diameter tubes of 0.2 cm thickness. Adjoining samples were cut from the tube for the extensometer and spiral and were thus 0.2 cm thick. The surface area determined by water adsorption was 162 m2/g assuming that each water molecule occupies 10.8 A2; water was purified by freezing and thawing during degassing.
Procedure
The samples both on the extensometer and the spiral were degassed at 150 "C for 24 h before each run. I n addition to the sample mounted on the extensometer, 8 g of sample were included in the cell during determination
288 CANADIAN JOURNAL OF CHEMISTRY. VOL. 48, 1970
of isosteres, so that any adsorbate taken up or given off in the space could be considered as negligible.
Isothermal length change -adsorption curves were determined at -0.5, -20, -31.5, and -40 "C. The samples on the extensometer and spiral were exposed simultaneously to water vapor and allowed to come to equilibrium. At low temperatures more than a week was sometimes allowed; at higher temperatures from 2 to 24 h were allowed. Complete adsorption isotherms were deter- mined at -0.5 and -20 "C, and a partial one at
- 31.5 "C.
Two other experiments somewhat unique in nature might come under the classification of isosteric deter- minations. One allowed the maximum amount of adsor- bate to enter a sample at a particular temperature. When it was certain that no excess adsorbate had deposited in the extensometer cell, the valve was shut and the exten- someter was warmed; in general, 2 to 24 h were allowed for equilibrium per point. The second experiment involved determining curves for maximum adsorption and maxi- mum expansion as a function of temperature, commenc- ing at the low temperature; at each temperature the samples were allowed to come to equilibrium with bulk ice at that same temperature. Great care was taken to ensure that deposition did not occur on the wire holding the sample to the spiral, or on the outer surface of the sample; after each temperature change was effected, the sample was pumped slightly and was then allowed to return to equilibrium. A "cooling-warming" isostere was also measured, in the same manner as other workers (5-8). This experiment served as a useful comparison
l l l l l l l l l l l l l l l l l ~ ~ ~ l ~
v AOSORPTION
-
OLSORPTIOHespecially since the samples used in this work had different surface areas and porosities to the samples of other workers.
Results
( I ) Isothermal Lengtlz Change - Sorption Curues
These curves for -0.5, -20, -31.5, and -40 "C are shown on Fig. 1 (a, b, c, and d), re- spectively. Their main feature is similarity of the curves. OA for all the curves is of similar slope, and all exhibit the flat feature along AB. Sections BC for
-
20, - 31.5, and - 40 are fairly similar, but that for -0.5 is much longer and the extent of adsorption is much higher, 23.35%
compared to 22.15, 21.6, and 21.2% for the -20, -31.5, and -40 "C curves, respectively. Thus, the adsorptive capacity ("apparent saturation" at each temperature) decreases with decreasing temperature, as has been found (2,9,10) for other systems. Length change follows the same pattern as adsorptive capacity, and more detailed results of these features will be presented.One of the reasons for this marked decrease in capacity is, probably, that the effective relative pressure experienced by the sample is less than
FELDMAN: LENGTH CHAN( 3E - ADSORPTION RELATIONS 289 unity. Iftheadsorbed matter retains the properties
of a liquid below 0 "C, then the effective relative pressure experienced by the sample will be (Po(,,,/ Po(,,,), the vapor pressure of bulk adsorbate divided by the vapor pressure of supercooled liquid at the temperature of the sample. This ratio will decrease from unity as the temperature decreases from the freezing point of bulk adsor- bate. This explanation has been given by other workers (9, 10).
Another feature of the curves is the marked hysteresis: it is shallower in Fig. l a than in the others. In Fig. l b the hysteresis, which was ob- tained in two experiments, is an unfamiliar shape, and the loops shown in b, c, and d do not close. The hysteresis, together with AB and BC, was well explained above 0 "C by Amberg and McIntosh (4). The explanation involved the theory of capillary condensation with menisci producing a compressive force onto the substrate. If this is true, one must consider here a solid meniscus with the appropriate forces, since both Antoniou (7) and Litvan (8) have shown that at -40 "C all but two molecular layers (8.9%) of adsorbed water are in a frozen state. This has also been observed for other systems (11, 12). The vertical portion BC of curves of this type has been attributed to the flattening of menisci (4). The maximum weight adsorbed at
-
40 "C (Fig: 1 d) is 21.2%. When 21.2% is adsorbed at -0.5,-
20, and-
31.5 "C (Fig. la, b, and c), the vertical portion BC has not been attained. In Fig. 1, how- ever, the amount adsorbed is recorded as weight, not as volume occupied in the sample, and whereas the pore volume of the sample may be regarded as constant, the average specific volume of the adsorbate may not. Thus at -0.5 "C, 21.2%
has not filled the pores sufficiently to cause flattening of the menisci, while at -40 "C it has. This implies that a change in specific volume of adsorbate may have occurred between these temperatures. If this is due to a phase change of the adsorbate involving an increase in volume, as for bulk water to ice transition, this effect can be explained.One might expect the length change along BC in Fig. 1 (b, c, and d) to approach that of BC in Fig. la, if the adsorbate is frozen and equivalent to bulk ice, since Po(Bs)/Po(Ads.s) will equal unity. (Po(,,, is the vapor pressure of bulk solid and PO(,,,,,, the "saturated" vapor pressure of ad- sorbed solid at the same temperature.) Data
derived from X-ray (13) and calorimetry (7, 8) have suggested, however, that the frozen adsor- bate does not have the properties of bulk ice. In fact Hodgson and McIntosh (6) have made vapor pressure measurements indicating that Po(,,,,,,
> Po(,,, for the water system but that Po(,,, > Po(Ads,s) for the benzene system. These latter results can explain the adsorption isotherms obtained for benzene (6) below its bulk freezing point.
(2) Adsorption Isotherms
Figure 2a illustrates an adsorption isotherm obtained at - 20 "C and a partial one at
-
3 1.5 "C. Both are plotted using Po(,,, as the saturated vapor pressure at the temperature of the sample. The isotherm at - 3 1.5 "C was experimentally determined by allowing a sample at-
31.5 "C to come into equilibrium with an ice source held consecutively at different temperatures, up to-
31.5 "C. The isotherm, although not complete, shows clearly a large hysteresis loop. Since a large portion of the adsorbate is frozen at this temperature, the implication is that a solid meniscus is responsible.Figure 2b shows an isotherm obtained at -0.5 "C and one obtained at -20 "C replotted,
FIG. 2. Adsorption isotherms (a) at - 31.5 and
-
20 "C plotted using Po,,,,; (b) at - 0.5 and -20 "C290 CANADIAN JOURNAL O F CHEMISTRY. VOL. 48, 1970
using a different Po as described below. On super- imposing the isotherm obtained at -20 "C (Fig. 2a) on the isotherm obtained at -0.5 "C, it was observed that the former was considerably dis- torted to the right. In addition, the primary hysteresis at the low pressure end opened at a higher relative pressure (0.6 to 0.53), and at the high pressure end closed at a higher relative pressure (0.96 to 0.84). The flat part of the iso- therm approaching saturation is also consider- ably shortened for the -20 "C isotherm. Po was changed by trial and error until the main charac- terestics of the two curves shifted into position; the value used for Po was 0.879 mm of Hg where
Po(,,, would be 0.776 mm; 0.879 mm is approxi-
mately midway between the supercooled and bulk-solid vapor pressure curve. With this value
for Po(,,,,,, the isotherm can only attain a relative
pressure of 0.873 (see Fig. 3). At this relative pressure on the -0.5 "C isotherm 0.35
%
more water is adsorbed. Again, one can explain these facts by the arguments used above and the assumption that freezing of the adsorbate occurred with an increase in the specific volume.(a) The argument based on that of previous workers (9, lo), but using Po(,,
,,,,
> Po(,,, as, in fact, it has been observed (6), the sample at -20 "C can attain only 0.873 PIP,, and this is one explanation for a decreased adsorptive capac-FIG. 3. Schematic o f chemical potential vs. tempera- ture illustrating adsorbed solid.
ity. It is possible that this concept could also provide an explanation for the drastic change observed in xenon isotherms below the normal freezing point (2). Care must be taken, however, in assessing the vapor pressure measurements of an adsorbed solid. If the solid has a concave inter- face, i.e., concave meniscus, when the measure- ments are made, then a vapor pressure lower than
Po(Ads,s, will result. The results from benzene
isotherms (6), however, can be explained by assuming P O ( A ~ ~ . S ) < P O ~ B S ) .
(b) When the equilibrium vapor pressure of the sample is controlled by a meniscus, it is largely the degree of filling of the capillary, and thus the volume adsorbed, that governs its shape. When freezing has occurred, therefore, and if it involves an increase in volume of adsorbate, one must expect a decrease in the weight adsorbed if the relative vapor pressure remains approximately constant; that this in fact occurs, will be shown in the following sections. This is the second ex- planation for a decreased adsorptive capacity. Figure 3 is a schematic diagram of chemical potential vs. temperature for water; a curve for "adsorbed solid" is drawn in at a constant diff- erence of chemical potential to the bulk solid. There will be further discussion of Fig. 3 in Section 3 of the results.
If it is assumed that two molecular layers will not freeze (7, 8) and that any increase in adsorp- tion in these layers as the temperature is lowered is negligible (Fig. 2b), then the total amount of adsorbate that can freeze or is frozen is 22.15 (maximum adsorbed at
-
20")-
8.9 (2 molecular layers) = 13.25%.
Using the value 0.35 ml per 100 g of sample as the volume change of adsorbate due to freezing, then 13.25 - (0.351~) ml is the volume of unfrozen water at -20 "C for 100 g of adsorbent. This assumes that the density of the unfrozen water that can freeze is 1 g/cc. The specific volume increase on freezing is "y". These values will be referred to again in Section 3a.(3) Maximum Adsorption and Maximum Extension Isosteres
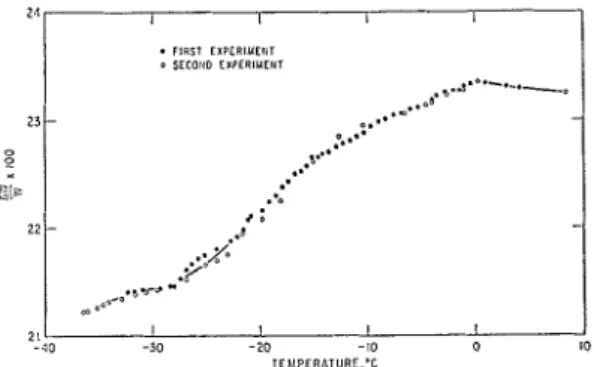
The maximum water adsorbed at various tem- peratures when the sample is in equilibrium with bulk ice at the same temperature, is presented in Fig. 4. The points are obtained from two experi- ments, illustrating reproducibility. At - 36.4 "C, 21.23%, and at 0 "C, 23.35%, of water is ad- sorbed. This increase in adsorptive capacity is
FELDMAN: LENGTH CHANGE - ADSORPTION RELATIONS 291 most probably due to the two effects discussed
above. To learn more about the hen omen on and to provide more convincing evidence for the explanations, however, the two effects should be separated. This can be done with the help of the maximum length change vs. temperature curve presented on Fig. 5, curve I. The change in maxi- mum length, using that at -40 "C as reference, vs. the maximum water adsorbed at each tem- perature is plotted on Fig. 6. Thiscurveiscorrected for the thermal expansion of the dry sample.
One may observe two distinct regions on Fig. 6. The last point on the lower-slope linear section AB is -13 "C. The slope of this section is 0.0095
%
length change per 1%
weight change. Using Fig. la, the length change from 9%
(approximately 2 molecular layers) to saturation (23.35%) is 0.126%; thus, the average length change is 0.0089%
per 1%
weight change. The similarity in slope is the basis for assuming that between -36.4 and-
13 "C, expansion occurs mainly byFIG. 4. Maximum water adsorbed vs. temperature. added water adsorption without much change in the shape or position of the meniscus; this is given by the linear part AB of the curve, and is a manifestation of the decrease of volume of adsor- bate on thawing which was discussed in Section 2b of Results.
To illustrate further (although the following procedure is not possible experimentally), starting at B, with a solid meniscus, further cooling causes more freezing; an increase in volume of the adsor- bate also occurs. To maintain the same relative pressure, some water is desorbed to reduce the volume, resulting in a contraction (an increase in Gibb's surface free energy) as defined by line BA
FIG. 5. Maximum length change curve (I) and warming isosteres; curves 11, 111, and IV.
an approximation because it is only for - 0.5 "C, but the slopes OA on the other curves, Fig. 1 (b,
c, and d), are very similar, so that this approxima- tion is a good one, as the results show.
By assuming constant relative pressure, one assumes that the difference in chemical potential between solid adsorbate and bulk ice is approxi- mately constant between - 13 and -40 "C. (The change in temperature, - 13 to - 40 "C, will alter the difference in chemical potential by lo%.) If - 13 "C is the point where no adsorbed solid meniscus remains in the small pores, then PO(SL) at this temperature should be equal to Po(,,,.,); Po(,s,/Po(,L) at -13 "C should be equal to Po(Bs,/Po(,d,~,, for lower temperatures such as -20 "C. This is approximately correct, as is shown on Fig. 3. Also, above - 13 "C the relative vapor pressure Po(Bs,/Po(sL,, will increase as the temperature increases and the length change and
or as discussed above with regard to the length
FIG. 6. Maximum length change vs. maximum weight change
-
adsorption characteristics on Fig- la. change from - '36.4 to 0 . " ~ . (Corrected for thermal ex- Reference to the characteristics of Fig. l a is only pansion of dry glass.)292 CANADIAN JOURNAL O F CHEMISTRY. VOL. 48, 1970
adsorption should be the result of flattening of menisci. This is shown below.
Before considering BC in Fig. 6, however, one can use some of the data discussed above to cal- culate volume expansion when adsorbed water changes to solid adsorbate. This can be done in two ways
(a) Using the data at the end of Section (2), a t -20 "C 13.25 - (0.35/y)mlisthevolumeof freez- able water per 100 g of adsorbent. The assun~ption that the difference in the maximum adsorbed between -20 and
-
36.4 "C is due to and equal to the volume expansion on freezing, and thus that any increase in the amount adsorbed into the two layers owing to lower temperatures is negli- gible, is still maintained. The value for the difference is equal to 0.92. The specific volume expansion on freezing "y", is therefore equal to 0.92/(13.25 - (0.35/y)). "y" = 0.0959.(b) Recognizing that
-
13 "C on Figs. 4 and 6 separates the two effects leading to increased adsorption with temperature, the weight change between A and B on Fig. 6 is taken and is 1.53%.
At B (- 13 "C) the maxinlunl adsorbed is 22.76%.
Subtracting the two molecular layers and accepting the assunlptions of (a) above and that all the adsorbate is liquid at - 13 OC, gives a value of 0.110 for the specific volume expansion.These calculations have similar weaknesses. If the assumptions concerning the two molecular layers are not correct, the value may differ in either direction. If less than two molecular layers remain unfrozen, the value for the expansion on freezing will be lower. On the other hand, if the amount adsorbed in the two molecular layers increases with decrease in temperature, then the value will be greater. Constancy of relative pres- sure between
-
13 and -40 "C also might not be conlpletely correct. The significance of these calculations, however, lies in the fact that both values are not far removed from that for normal water-ice transition. This is in contrast with Antoniou's calculations (7), which give a value 1/40 of the value for freezing to bulk ice. Antoniou concluded that the solid adsorbate was very different from bulk ice. Whereas some properties of the solid adsorbate and bulk ice d o differ, it is now clear that the volume expansion of adsorbed water during transition to adsorbed solid is not too different from that of the bulk transition. Further discussion of the results obtained by earlier workers (6-8) will be made later.Referring again to Fig. 6, the total A(AL/L) per unit weight change from B to C is 0.0635. The slope ofthe top portion of BC on Fig. l a is 0.0558. This comparison strongly suggests that BC on Fig. 6 or from - 13 to 0 "C on Fig. 5 is due to an increase of the relative pressure on warming as P,(Bs,/Po(sL, approaches unity. Within the context of the capillary condensation theory, expansion is due to the flattening curvature of the menisci. Using the same argument as above and the same assuruptions, one should be able to predict approximately, from the data on Fig. 4, the region BC of the isotherm a t - 0.5 "C on Fig. 2b. Thus, at - 13 "C, ~ h e r e P ~ ~ ~ ~ , / P , ( , ~ , is0.881, the Awvs. T plot on Fig. 4 would predict adsorption to be 22.76, whereas on the isotherm it is 22.54%. This assumes that there is no ice in the small pores at
-
13 "C; and that the Aw vs. T curve is the point on the isotherm at each temperature; so that in referring to the - 0.5 isotherm one would not expect exact agreement.(4) " Wort7zing" Length Change Isosteres
The role of the volume change when the adsor- bate freezes is thus very important. It would be instructive to observe the length changes that occur during the transition. This has been attempted ( 6 4 but most of this work involved "loading" samples a t the warm condition and then performing "cooling and warming" cycles (referred to later as "cooling-warming" isosteres). It is expected that some undesirable features can occur during this experiment: (a) movement of water out and back in the sample, since the sam- ple a t 0 "C contains illore water than it would a t lower temperatures; (b) stress in the sample as a result of expansion and freezing. The result would leave the sa~nple in an undefined state and the length changes would be difficult to interpret. This will be referred to again in Section (5).
T o avoid this, it was decided to load the sam- ples a t the low temperature and warm them. The transition would result in a decrease in volume of adsorbate and an increase in adsorptive capac- ity. These samples should thus remain well defined with respect to the ALIL vs. A W/ W plots on Fig. 1.
Figure 5 shows warming isosteres, curves 11, 111, and IV. They contain, as is evident from the graph, the maximum amount that can be ad- sorbed a t - 36.2, -27.6, and -20.1 "C; that is, 2 1.23,21.52, and 22.15
%,
respectively. The threeFELDMAN : LENGTH CHANGE - ADSORPTION RELATIONS 293 curves show very large shrinkages starting
directly as warming proceeds, although for curve I1 the initial rate of shrinkage is very low. Shrink- age is complete at approximately - 12,
-
10, and - 11.5 "C for curves 11,111, and IV, respectively. This is not too far off the temperature obtained from Fig. 6, especially for curves I1 and IV. If shrinkage is a result of transition, and this is shown at the end of the section, then the transition for this sample occurs between approximately -36.2 and - 12 "C. Calorimetric data on other samples by Antoniou (7) suggest that it occurs between - 32 and - 5.5 "C, and by Litvan (S), between -22 and - 7 "C. The maxima for heat curves for both were about - 12 "C. These results were obtained on the basis of the "cooling- warming" isosteres and, as shown by Antoniou (7), samples from the same batch show consider- able variation. Results in the previous section and those on Fig. 5 suggest that the transition range for the sample used here occurs at lower tempera- tures than the samples of the above workers.When transition was completed, the three curves were continued to approximately 0 "C and beyond for curve 11. At this point, the exten- someter cell was opened and the samples were exposed to water vapor at saturation conditions, resulting in an expailsion back to the "maximum length change vs. temperature" curve. This expansion amounted to 0.15
%
for curve 11. Its magnitude, together with the fact that the samplecontained 21.23% water, leads one to suspect that the expansion is related to BC on the length change - sorption characteristics of Fig. la and that shrinkage of curves 11, 111, and IV is related to the volume effect on thawing of the adsorbate and menisci.
Assuming that this is the case, an explanation can be given that agrees with other data. As tem- perature is increased, thawing occurs even at
-
35.5 "C, and a decrease in volume of adsorbate takes place. Unlike the "inaximum length change" isostere, curve I, Fig. 5 , where more adsorbate is available, none is available in this experiment and the adsorbate recedes in the capillary, leading to a change curvature and contraction. Thus, as curves 11, 111, and IV move toward higher tem- peratures, they are, in fact, travelling on the desorption part of an isotherm. The actual details, even on a macroscale, of how the change of the solid meniscus takes place are difficult to con- ceive. Even though it seems reasonable to assume that thawing first occurs near the adsorbent sur-.,
faces, what occurs when there is a mixture of both liquid and solid adsorbate in an adsorbent is difficult to say. It is possible that the strange nature of the desorption of Fig. l b is a result of this. Nevertheless, Fig. 7 illustrates what occurs when the "warming isosteres" are measured.On the left of the figure is the length-weight change plot at -40 " C , curve V, and on the right the same plot at -0.5 "C, curve VI. Figure 5 is
032 - J -
-
-
-
I
I
I
I
I
I
- 40 - 30-
20 -10 0 E x I00 T E M P E R A T U R E , O Cfi
x I00 W WFIG. 7. Explanation for warming isosteres. I is maximum length change curve; 11,111, and IV warming isosteres; V and VI length vs. weight change curves; and VII thermal expansion of dry glass.
294 CANADIAN JOURNAL OF CHEMISTRY. VOL. 48, 1970
reproduced in the middle, and the thermal expan- sion of the dried sample is below. The latter curve, corrected for the Invar extensometer, gives a thermal coefficient of 4.3 x deg-' com- pared with the value of 5.0 x deg-' obtained by Antoniou. Note that curve VI com- mences at the end of this thermal expansion curve. A, B, and C are marked at the beginning of curves 11, 111, and IV, and where they would be at the top of the length-to-weight change curve, curve VI. A, B, and C are also drawn over from the end of curves 11,111, and IV to the desorption part of curve VI. These are again marked A, B, and C, so that length change AA, BB, and CC marked adjacent to curve VI represent the actual contraction that occurred during the warming isosteres. An independent confirmation of the fact that the contraction is, in fact, movement on the desorption curve can be obtained from prior knowledge of water content of the sample at A, B, and C, respectively, before the start of the experi- ment. These are marked on curve VI as WA, WB, and WC; as can be seen, they predict approxi- mately the positions of A, B, and C after contrac- tion. The actual values are given in Table 1.
TABLE I
Comparison of contraction from warming isosteres and isotherms
Contraction determined Maximum Weight Actual from iso- saturation put on contraction therm data
"C % % %
- 20 22.15 0.025 0.022
-27.6 21.52 0.059 0.056
-36.2 21.23 0.081 0.096
I t is clear from these results that the observed shrinkages are a result of the recession of menisci owing to decrease in volume of adsorbate with melting in the small pores.
( 5 ) "Cooling- Warming" Length Change Isosteres
As stated previously, this experiment probably leaves a saturated porous system in an undefined state, but because of its practical importance (it is the kind of treatment a material will receive in nature) and because many measurements of this type have been made previously (2,5-8) and have been correlated with calorimetric measurements (7, 8), it was deemed necessary to perform this
experiment to provide comparison with previous results and to compare present results with those of experiments of Sections (1-4). It is thought that a satisfactory explanation can now be pro- vided for the "cooling-warming" isosteres.
The "maximum length change" isostere is plotted on Fig. 8, curve I (see also curve I on Fig. 5). Curve I1 is the "cooling-warming" isostere; for convenience it is divided in characteristic regions similar to those of Antoniou (7) and will be discussed accordingly. Curve 111 is the thermal expansion of the dry glass.
FIG. 8. 'LWarming~ooling" isostere (11) and maxi- mum length change 0 ) curves. Curve I11 is thermal expansion of dry glass.
The isostere is very similar to Antoniou's second one (7); most of the features are present, the difference being that they are displaced to lower temperatures. The expansion on the cooling (CD) curve (attributed to freezing) is displaced from the range
-
13 to-
17 "C to the range -25 to -34.5 "C. The shifting of effects to lower temperatures for this sample has already been mentioned, and variation within one batch has been noted by Antoniou (7).Region A-B
This region of low contraction is similar to the thermal contraction of the material. No hump was observed at B, as it was by other workers (2, 7), but it is thought that some freezing commences at this point (-4.5 "C) in larger pores of the sample.
Regions B-C and C-D
A linear contraction is observed down to -25.0 "C; this curve is parallel to that of the
FELDMAN: LENGTH CHANG .E - ADSORPTION RELATIONS 295 "maximum length change" isostere, curve I,
down to - 13 "C. The reason for expansion in the
latter curve has been shown to be due to readsorp- tion of water and flattening of menisci. Con- versely, contraction BC is considered to be due to removal of water from the pores after ice has formed in larger pores at -4.5 "C; this effective decrease in relative pressure is the same as was previously discussed in Section (3) of Results.
Two further pieces of evidence prove conclu- sively that water migrates from the sample on cooling: (a) "cooling-warming" isosteres ob- served by Litvan (8) on a sample containing different water contents have shown BC very prominently at saturation; at all other water contents lower than saturation, region BC had vanished; (b) during the measurement of the isostere in the present work, it was observed, on the warming part of the cycle just beyond F, that the intensity of the image in the optical lever of , , the extensometer had dimmed somewhat; closer examination showed some hemispherical drops of ice on the mirrors; beyond G, the image became gradually brighter until at - 3 "C, ice had disappeared. This point will be referred to again in this section, but it appears that the effect was not previously recorded because length measure- ments had been made either in a calorimeter, where no visual observation could be made, or in an enclosed cell containing a capacitance type extensometer.
The results of curve I were obtained by always bringing the sample into equilibrium with bulk ice at the same temperature. For the present experi- ment, curve I1 (cooling), the ice formed at
-4.5 "C is not necessarily bulk ice but ice at a
higher chemical potential produced either by pressure caused by the walls of the larger capillary or by a convex curvature of the ice, as discussed by Everett (14). This would explain why curve BC is displaced from curve I, and will also be dis- cussed again. The fact that curve I1 (cooling), continues down to - 2 5 "C without apparent freezing in the small pores is probably due to supercooling. It has been established in previous sections that thawing in the small pores took place between - 3 6 to - 13 "C. The cross-over
with curve I seems to confirm supercooling. Other work (15) indicates that one form of ice will not necessarily nucleate another form from super- cooled liquid. This can explain the fact that along CD, where freezing occurs, each point represents
an apparent equilibrium; the frozen adsorbate might exist in domains, each with different prop- erties. The expansion along CD, however, should not be used for a calculation of the volume change on freezing. As much water has moved into bigger pores or out of the sample, it is not known how much water has frozen along C D and some ex- pansion of the frozen adsorbate could have taken place along the spaces vacated by water. In addition, the high stress against the pore walls resulting from freezing has probably caused some damage to the sample. It is also possible that in this region, CD, some readsorption of the expelled water into the small pores can take place because (PO(BS)/PO(SL))T < ( P ~ ( ~ ~ ) / P ~ ( ~ d s . ~ ) ) ~ ; i.e.,
the effective relative vapor pressure has increased.
Region D-E
It appears that from D at -34.5 "C to E at - 36.6 "C no more freezing takes place because
the sample now shrinks at the same rate as curve 111.
Region E-F
At first the cooling curve, DE, is followed, but there is later deviation. Previous experiments suggest that some thawing and readsorption of adsorbate that had left the samples has taken place, but because of the stressed state of the sample and the frozen adsorbate one cannot tell from the isostere what is occurring.
Region F-G
A slight contraction is first observed, followed by an expansion in excess of the thermal expan- sion of the dry material. F G approaches close to BC without any contraction. It is believed that further thawing takes place along FG, and that at G, which is at - 13 "C, thawing of the adsorbate
in the small pores is complete. The location of G and the slope of G H to follow confirms this in relation to the other isosteres discussed. Further reference to F G and the hysteresis will be made.
Region G-H
It has a slope very similar to the same region of curve I, and the conclusion is that the water expelled on cooling re-enters the sample, owing to a permissible increase in the relative vapor pressure of the adsorbate in the sample and a flattening of the menisci. The sample is now in equilibrium with bulk ice, which was observed to be present but disappeared completely at the end of this region between - 4 and - 3 "C. As the
296 CANADIAN JOURNAL OF CHEMISTRY. VOL. 48, 1970
bulk ice, G H should be coincident with curve I in this temperature range. Discussion of regions H K and KL will show that it would be if no irre- versible damage occurred to the sample. The point H is already above that of region AB, indi- cating damage.
Regions HK, KL, HL, and L M N
H K might first indicate that AB is being repro- duced, but if the sample is in equilibrium with bulk ice, curve I should be followed and HK, a region of low expansion, does not conform to curve I. If damage to the sample did occur, how- ever, its porosity might increase and all the water available might re-enter it at -3 "C. Further expansion along H K is the thermal effect only. This was checked by allowing the sample at -0.5 "C t o be exposed to saturation conditions. As it had already been saturated at the beginning of the experiment, no expansion should occur. Expansion K L did occur, however, so that if more adsorbate had been available G H would have extended along HL and LM.
The curve GHLM is very similar to curve I. If it were brought down by an amount due to irre- versible damage, i.e., from L to'curve I, the point G would almost meet curve I at - 13 "C, as is expected. If a line is drawn between F and this new point for G, it can be seen that there should have been a contraction in this region where thawing took place. A few further points can be elaborated in view of the above explanations:
(a) region AB on the cooling cycle is not repro- duced on warming; it is probably the result of a supercooling effect followed by the formation of strained or curved ice in large pores;
(b) it is possible that there were no obvious heat effects between -5 and 0 "C in the calori- metric results (7, 8) because (i) all the bulk ice that vacated the sample had re-entered (in this case at
-
3 "C) the pores before 0 "C owing to increased porosity resulting from damage to thesample; and (ii) re-entrace takes place almost linearly between
-
5 and 0 "C, as is shown in Fig. 4;(c) the hysteresis between the cooling and warming cycle can be attributed to supercooling and damage to the sample; if no damage occurred, the hysteresis effect would still be evident due to supercooling;
(d) it is now thought that irreversibilities ob- served in Fig. 1 (b, c, and d) are due to damage occurring during desorption ;
(e) a comparison of "cooling-warming" isosteres obtained by various authors would be helpful in throwing light on some of the phenom- ena associated with this isostere.
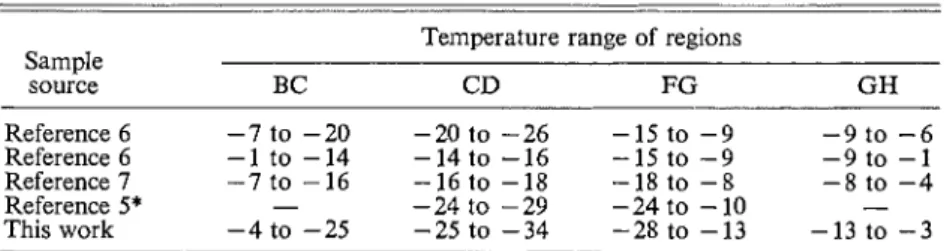
Table 2 gives the temperature ranges of the various regions, as labelled by Antoniou (7) and referred to in Fig. 8. Examination of Table 2 reveals a variation in all ranges for all samples. For example, in some cases it appears that the two effects of thawing, i.e., thawing in small pores and thawing outside, leading to readsorption, may be partially overlapped. It seems especially true for samples 1 and 3. If this is the case, it will partly explain why the calorimetric heat maxima for different water contents do not shift as they appear to for benzene (6). It is surprising for two conditions, saturation, and moderately under- saturated. For other samples this may not be the case.
Discussion
Most of the observations in the present and related experiments could be explained by the capillary condensation theory extended to the solid adsorbate. It does not mean, however, that the Kelvin equation can be applied quantitatively in this region, and it is not suggested. Similarly, the fact that the Clausius-Clapeyron extension of the Kelvin equation does not predict freezing in small pores does not mean that the assumptions TABLE 2
Temperature range of regions from several samples Temperature range of regions Sample source BC CD FG GH Reference 6 -7 to -20 -20 to -26 -15 to -9 -9 to -6 Reference 6 -1 to -14 -14 to -16 -15 to -9 -9 to -1 Reference 7 -7 to -16 -16 to -18 -18 to -8 -8 to -4 Reference 5* - -24 to -29 -24 to -10 - This work - 4 t o - 2 5 - 2 5 t o - 3 4 - 2 8 t o - 1 3 - 1 3 t o - 3 'Not saturaled.
FELDMAN : LENGTH CHANG iE - ADSORPTION RELATIONS 297 made for the Kelvin equation above freezing are
invalid. As discussed by several authors (7, 16), adsorbate, even 50
A
from the surface, is affected by surface forces; but whereas this effect may be negligible after two molecular layers with regard to vapor pressure as a function of radius of menis- cus predictions, it is not negligible with regard to the freezing phenomenon.The results for the length change isotherms of xenon (2) and benzene (6) were not readily ex- plained. The behavior of xenon may be regarded as an exception; above freezing it stands apart from many other absorbates with regard to the relation of Gibbs free energy and length change (17). It has been concluded that it is not satisfac- tory to assume that y (the change in surface energy) is generally approximately equal to 7c (spreading pressure) for all adsorbates and tem- peratures (18). The explanation for xenon does not seem applicable to benzene; the expansion for the first two molecular layers of the isotherm, as with water, is similar at all temperatures.
Any clarification that these experiments give of the adsorption-extension phenomenon below 0 "C i's helpful in understanding the deterioration of building materials from exposure to tempera- tures below 0 "C. It appears that the mechanism of the movement of water from small pores to large ones, causing large pressures, is valid. This has been discussed by Everett (14) in thermody- namic terms, by Penner (19) in relation to soils, and by Powers (20) in relation to hydrated cement and concrete. These mechanisms should be especially pertinent when thick samples are used. The movement of water out of small pores will not be as easy and ice will more readily accumulate in the large pores, causing great pressure. As may be seen in these experiments, water can come out of a thin sample, or onto its surface, where it forms bulk ice and stress will be avoided. This occurred down to -25 "C. A solution to the problem is to prevent large amounts of water that may be held by capillary condensation from entering the material. There is evidence that surface coatings that change the contact angle may be helpful.
Conclusions
( I ) The isothermal length change - adsorption curves can be explained below 0 "C by the capillary condensation and menisci theory. Because of these and other results a solid meniscus is postulated.
(2) A decrease in adsorption capacity is ob- served with decrease in temperature owing to two effects : (a) a reduction in the effective relative vapor pressure to which the sample is exposed due to the fact that Po(,,,, the saturated vapor pressure of the unfrozen adsorbate in the sample is greater that Po(,,, at the same temperature; and (b) a volumetric expansion of adsorbate on freezing that is quantitatively similar to the bulk water - bulk ice transition.
(3) The higher vapor pressures of sample with respect to bulk ice are due to (a) supercooled liquid vapor pressures; and (b) vapor pressure of frozen adsorbate greater than that of bulk ice. (4) The effects in (2) above cause length changes during measurement of isosteres owing to move- ment of water out of and back into the sample, and to the development of pressure when adsor- bate freezes.
The author wishes to acknowledge many helpful dis- cussions with Mr. P. J. Sereda and Dr. G. G. Litvan. Thanks are also due to Mr. S. Dods and Mr. H. Slade for help with the experimental work.
1. P. J. SEREDA and R. F. FELDMAN. Appl. Chem. 13, 150 (1963).
2. G. LITVAN and R. MCINTOSH. Can. J. Chem. 41, 3095 (1963).
3. B. R. PURI, Y. P. MYER, and D. D. SINGH. Trans. Faraday Soc. 53, 539 (1957).
4. C. H. AMBERG and R. MCINTOSH. Can. J. Chem.
30, 1012 (1952).
5. C. HODGSON and R. MCINTOSH. Can. J. Chem. 37, 1280 (1959).
6. C. HODGSON and R. MCINTOSH. Can. J. Chem. 38. 958 (1960).
7. A. A. ANTONIOU. J. Phys. Chem. 68, 2754 (1964). 8. G. G. LITVAN. Can. J. Chem. 44, 2617 (1966). 9. C. H. AMBERG, D. H. EVERETT, L. H. RUITER, and
F. W. SMITH. Proc. 2nd Intern. Conf. of Surface Activity. Butterworth Scientific Publications, London, 1957.
10. A. V. KISELEV and V. V. KULICHENKO. Zh. Fiz. Khim. 29, 663 (1955).
11. J. A. MORRISON and L. E. DRAIN. J. Chem. Phys.
19, 1063 (1951).
12. J. A. MORRISON. L. E. DRAIN. and J. S. DUGDALE. Can. J. Chem. 30, 890 (1952). '
13. V. S. BRAZHAN. Kolloid. Zh. 21, 645 (1959). 14. D. H. EVERETT. Trans. Faraday Soc. 57, 1541
(19611.
\ - - --,.
15. G. KARAGOUNIS. Helv. Chim. Acta, 36, 282, 1681 (1953); Helv. Chim. Acta, 37, 805 (1954).
16. D. M. ANDERSON. J. Colloid Interface Sci., 25, 174 (1967).
17. P. J.'SEREDA and R. F. FELDMAN. The solid-gas
interface. Vol. 2. By E. A. Flood. Marcel Dekker, New York. 1967. Chap. 24. p. 729.
18. J. C. ERIKSSON. Surface Sc. 14, 221-246 (1969). 19. E. PENNER. Proc. Intern. Conf. on Low Temp. Sci.
Sapporo Japan, 1966; Vol. 1, Part 2, 1401 (1967). 20. T. C. POWERS. J. Amer. Conc. Inst. 16, 245 (1944).