Saudi Arabia: too big to hedge?
Bachelor Project submitted for the degree of
Bachelor of Science HES in International Business Management by
Ariana JUSUFI
Bachelor Project Advisor:
Robert PILLER, Lecturer
Geneva, the 4th of June 2018
Haute école de gestion de Genève (HEG-GE) International Business Management
Declaration
This Bachelor Project is submitted as part of the final examination requirements of the Haute école de gestion de Genève, for the Bachelor of Science HES-SO in International Business Management.
The student accepts the terms of the confidentiality agreement if one has been signed. The use of any conclusions or recommendations made in the Bachelor Project, with no prejudice to their value, engages neither the responsibility of the author, nor the adviser to the Bachelor Project, nor the jury members nor the HEG.
“I attest that I have personally authored this work without using any sources other than those cited in the bibliography. Furthermore, I have sent the final version of this document for analysis by the plagiarism detection software stipulated by the school and by my adviser”.
Geneva, 31st May 2018
Acknowledgements
First and foremost, I would like to express my sincere gratitude to my professor and advisor Mr Robert Piller. I would like to thank him for his availability and support. Through my major, he has provided me with great insight on commodities trading in general a well as on the oil industry. His knowledge and his critical thinking have been a great asset. Many thanks to him.
I would like to thank particularly Mrs Antoinette Esposito for sharing her knowledge on derivatives accounting with me as well as Mr Frédéric Ruiz for his precious opinion and expertise. I also take this opportunity to express my gratitude to all the lecturers who indirectly contributed to my project by sharing their knowledge with me throughout my studies at the Haute Ecole de Gestion de Genève.
Last but not least, I am thankful to my family and friends who always support me throughout each step of my life. Their support is invaluable.
Executive Summary
As oil prices reached low levels in 2016, many countries dependent on oil revenues experienced significant budget deficit. Saudi Arabia, for which oil revenue accounts for more than 80% (FETEHA, 2017), chose to implement a fiscal reform to reduce its oil dependency by creating other sources of income through the diversification and the liberalization of the country.
Although fiscal reform is a good strategy for the long run and for the country in general, the solution does not take into account the price risk; a risk the national oil company will always have to face.
This research paper will describe the financial instruments available on the market to mitigate price risk. It examines the distinctive characteristics and lay out the similarities and differences in order to allow the reader to have a good understanding about the derivative instruments.
Moreover, this research paper will analyze the Hacienda Hedge – the biggest oil trade on Wall Street as well as three companies’ hedging strategies in order to define their practices. On top of that, Equinor – the Norwegian Oil Company was also investigated. My objective was to determine whether or not Saudi Arabia could have its national oil company – Saudi Aramco – hedging its production. The feasibility of such transactions was assessed by considering the derivatives market size as well as the power of Saudi Arabia within the global oil market. Saudi Arabia being considered as a price maker, a question arisen to know if there would be a counterparty taking the other side of the transaction, if any. Lastly, the hedging practices which were analyzed documented recommendations for potential hedging strategy.
This study comes to the conclusion that Saudi Aramco should hedge part of its production. The company should implement a strategy to lock in their revenues especially with the rise of the shale industry. The oil market will be well supplied for the coming years meaning that the price could possibly remain at low levels as OPEC cut-back measure to increase oil price is not sustainable by all the members and it reduces only OPEC’s market share. The analysis based on Equinor has shown that the implementation of a government pension fund would be an opportunity to consider in the long run but would require a change in the structure of the company.
Contents
Saudi Arabia: too big to hedge? ... 1
Declaration ... i
Acknowledgements ... ii
Executive Summary ... iii
Contents ... iv
List of Tables ... v
List of Figures ... v
1. Introduction ... 1
1.1
Saudi Aramco ... 2
1.1.1
The company ... 2
1.1.2
Organization of Petroleum Exporting Countries (OPEC) ... 4
1.1.3
Comparison to Petroleos Mexicanos (PEMEX) ... 6
1.2
Derivatives ... 8
1.2.1
Types of instruments ... 9
1.2.2
The potential risks ... 19
2. Analysis ... 20
2.1
Research methodology ... 20
2.2
Study of derivatives ... 20
2.2.1
The market size ... 20
2.2.2
PEMEX & the Hacienda Hedge... 23
2.2.3
EOG Resources Inc. ... 34
2.2.4
British Petroleum Plc (BP) ... 38
2.2.5
Equinor ... 41
3. Discussion ... 43
4. Conclusion ... 47
Bibliography ... 48
Appendix A: Financial derivatives table ... 53
Appendix B: PEMEX Derivatives use 2015 - 2018 ... 54
List of Tables
Table 1 Comparison of PEMEX & Aramco ... 6-7
Table 2 Call option similes ... 16
Table 3 Put option similes ... 16
Table 4 Exchange-traded futures and options ... 21
Table 5 Global OTC derivatives market ... 22
Table 6 Pemex’s consolidated results ... 24
Table 7 Production/Hedging size comparison 2009-2016 ... 27
Table 8 Hedging Program 2001-2017 ... 28
Table 9 Brent crude oil price 2008-2017 ... 29
Table 10 Options calculations on Pemex’s 2008-2009 deal ($) ... 30
Table 11 Options’ purchase 2009-2010 ... 32
Table 12 Counterparties intervening in 2009-2010 hedging program ... 32
Table 13 EOG Derivatives contracts 2013 – 2014... 35
Table 14 EOG Derivatives contracts - Annual report 2016... 36
Table 15 EOG Derivatives contracts- Annual report 2017... 37
Table 16 Derivatives instruments at fair value on 31st December 2017- 2016... 38
Table 17 BP Derivatives assets and liabilities by maturity... 39
Table 18 Derivatives assets and liabilities by hierarchy level ... 40
List of Figures
Figure 1 Aramco’s Global and Domestic Operations ... 2Figure 2 Aramco’s crude oil production, reserves and exports ... 3
Figure 3 February 2018 crude oil production ... 5
Figure 4 Forward schema ... 11
Figure 5 Futures schema ... 11
Figure 6 Swaps schema ... 14
Figure 7 Options diagram ... 18
Figure 8 Mexican oil hedging 2009-2016 ... 26
Figure 9 Hedging Program Cost in Million USD 2001-2017 ... 27
Figure 10 Maya-Brent-Arab crude oil differential ... 31
Figure 11 EOG’s crude oil production 2013 - 2017... 34
1. Introduction
From 1970-1972 to 2011-2013, the price of oil recorded an astonishing increase of 886 percent (AGUILERA, RADETZKI, 2016, p.11). Like any other market, the oil market is influenced by supply and demand. Over the years, events such as the embargo on the United States of America (USA) concerning the Yom Kippur War, the Iran-Iraq war as well as the Arab spring has greatly influenced the price of the commodity.
Mid-2014, the global oversupply led to a decrease in price. No country was willing to cut production to foster the price of oil; the price went from a peak above $115/barrel in June 2014 to under $35/barrel at the end of February 2016 (ROGOFF, 2016). In May 2018 Brent oil price hit $80.00 per barrel and generally oil prices have been floating around $70/barrel since (OIL PRICE, 2018).
As a result, oil producing companies have been suffering from lower revenues and hence losses. Countries such as Venezuela, Kuwait and Saudi Arabia but not limited to, are highly dependent on oil revenues and are suffering the consequences of lower oil prices
(AGUILERA, RADETZKI, 2016).
Saudi Arabia, for which oil revenue accounts for more than 80% of the country’s income, experienced significant deficit in its budget. Its budget deficit in 2016 accounted for 12.8% of Gross Domestic Product (GDP) and 8.9% in 2017.The country still plan to run a deficit of 7.3% of GDP in 2018 (FETEHA, 2017). According to the International Monetary Fund , an oil price of $105.60 is needed to balance the budget which is roughly double of current price level (THE WORLD BANK, Unknown publication date). As low oil prices greatly impacted Saudi’s economy, the country implemented a fiscal reform in which it wishes to diminish its oil dependency by creating other form of revenue for the government such as VAT, and through the liberalization and the diversification of the country.
While some countries implemented fiscal reform, Mexico and some private-owned oil producers have been implementing hedging strategies to minimize their risks and secure revenues. This is the reason why I have chosen this subject. In financial instruments I see a tool which a country such as Saudi Arabia should not neglect due to its high dependency. I believe Saudi Arabia should implement a hedging strategy and tackle the price risk which it is inevitably subject to, assuming that it is a viable option.
The objectives of this paper are to look at the different hedging strategies available for oil-producing companies. In the first part, I will present Saudi Aramco, the OPEC and
make a comparison of the Mexican state-owned oil producing company PEMEX and Saudi Aramco. I will follow with the introduction of derivatives and expose the theoretical aspects of derivatives instruments. In the second part, I will analyse three companies’ financial reports to understand their hedging strategy. The companies chosen are PEMEX –including the Hacienda hedge, EOG Resources – a shale company and BP - a supermajor in oil & gas production. I will also look into the Norwegian oil company Equinor as the company walked Saudi Armaco’s path in 2001 by going partially public. The purpose of the analysis is to understand the strategies available to Saudi Aramco and evaluate the feasibility of a hedging strategy. Because of the importance of Aramco’s production and their position in the oil market, the question of the possibility for the company to hedge will be a crucial one to answer.
1.1 Saudi Aramco
1.1.1 The company
Saudi Aramco (Aramco) is the state-owned oil producing company of the Kingdom of Saudi Arabia (KSA) founded in 1933 through a concession with the Standard Oil Company of California (Socal). The company is headquartered in Dhahran (KSA). Aramco is engaged in hydrocarbons exploration, production, refining, distribution and marketing. The company has grown to be the top world exporter of oil and natural gas. It is a vertically integrated energy company employing more than 65’000 people worldwide (SAUDI ARAMCO, 2016).
As per Figure 1, we can see that Aramco is active in three major global markets; North America, Asia and Europe with 13 global offices around the three regions. R&D center/technology offices are all located outside of Saudi Arabia within the three regions. Inversely, all shipping terminals, refineries and bulk plants are located within the country. Aramco possesses multiple joint ventures in the global markets (Houston, Maastricht, Alexandria, etc.)
Aramco’s 2016 Annual Review (Figure 2) presented a slight increase in production of 300’000 barrels a day amounting to 10.5 million barrels per day (mmbpd). Its crude oil and condensate reserves increased as well to 260.8 billions barrels representing 21.9% of world’s proven reserves (OPEC, 2017). Aramco experienced a rise in its crude oil exports; from 2’603 to 2’799 million barrels in 2016. Two third of its exports are headed to Asia, 15.8 percent to the USA – despite the rise of the shale industry, 11.3 percent to Europe and 6.2 percent to other countries. The exports amounted to $136 billion, representing 20 percent of the world crude oil exports (WORKMAN, 2018). There is no information available on financial results in the company’s annual review.
Figure 2 Aramco’s crude oil production, reserves and exports
1.1.2 Organization of Petroleum Exporting Countries (OPEC)
OPEC is a permanent and intergovernmental organization created in 1960 at the Baghdad Conference by Saudi Arabia, Iran, Kuwait, Iraq and Venezuela. Throughout the years, the five founding members were joined by ten other countries: Qatar, Libya, United Arab Emirates, Algeria, Nigeria, Ecuador, Angola, Gabon and Equatorial Guinea. Indonesia joined the organization as well in 1962 but suspended its membership in November 2016. Today, OPEC’s headquarters are located in Vienna, Austria.
The objective of the organization is “ to coordinate and unify the petroleum policies of its Member Countries and ensure the stabilization of oil markets” (OPEC, 2018) which involves the creation of a steady supply of petroleum to the consumers in general and a reasonable return on capital to the producers.
The influence of Saudi Arabia within the organization has been unchallenged. Due to its large crude oil production capacity, Saudi Arabia is the only country having a large excess capacity available to face market interruptions and demand surges. Over the years, Saudi Arabia has softened the impact of critical oil supply interruptions such as during the Iran-Iraq war, the invasion of Kuwait and the Venezuelan crisis of 2003 (AGUILERA, RADETZKI, 2016).
We can understand the importance of stable oil markets for Saudi Arabia due to their dependency on oil. Saudi Arabia’s oil policies have always been towards maximization and sustainability which was easy when the country could play a leverage role in the oil sector.
The objective of the OPEC is at stake today due to two main reasons which make Saudi’s excess capacity advantage less attractive: the rise of the shale industry and Russia and ARAMCO’s IPO.
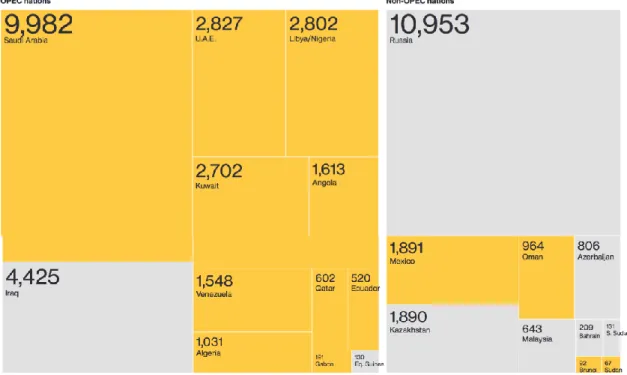
Back in January 2017, OPEC members and their allies started to cut their production to support the recovery of the oil price. While it is easy for Saudi Arabia to fill the gap in production to meet world demand it is much harder to implement a strategy to cut world production. Most of the OPEC countries have followed through the plan in which 21 countries are attempting to reduce production by almost 1.8 million barrels a day (WINGFIELD, DODGE, SAM, 2018). Figure 3 shows the production in thousands of barrels a day for February 2018. While Saudi Arabia, the UAE, Libya/Nigeria, Kuwait, Angola, Qatar, Ecuador, Algeria, Gabon have met or exceeded the cutback target Iraq and Equatorial Guinea did not meet the requirements. Venezuela has cut back its production notably, reaching the cutback target on an average of 212% since January
2017. However, the cut in Venezuelan production is unintentional and due to an economic crisis.
Figure 3 February 2018 crude oil production (mbbld)
Source: Bloomberg “OPEC Oil Cuts Deepen”
Non-OPEC countries, however, have not been cutting production efficiently. Only Mexico, Oman, Brunei and Sudan have reached the cutback target. On the run to be world’s leading producer, Russia did not achieve the cutback targeted by producing 10’953 thousand barrels a day; 12% more than the quantity agreed. Nevertheless, OPEC countries cutbacks were positive. From January 2018 to April 2018 cutbacks averaged 156%. OPEC’s allies, however, did not reach the target with an average of 74% over the same period. Altogether, OPEC countries compensated the lack of cutbacks from their allies thanks to the Venezuelan crisis. We see that it takes more than the OPEC countries, and especially Saudi Arabia, to affect prices nowadays. On the other side of the world, the USA has been pumping more oil than ever, undermining OPEC’s practices to create a supply shortage (SMITH, 2018). USA’s ascendance can explain Russian production as both are competing for the world’s leading producer rank.
The second reason lies with Aramco’s IPO, explaining OPEC’s cutbacks (SMITH, 2018). The IPO was initially planned for earlier this year and has been postponed to 2019. The IPO lead to rethink OPEC oil policy. If listed, the company will have to take into account the interests of investors and will be scrutinized by anti-trust legislation (EL GAMAL,
LAWLER, 2017). In the United States, anti-trust legislation prohibits price-fixing and Aramco could be accused of such if the country follows the OPEC policy of adjusting output to manage price.
The example of Equinor -former Statoil- is a good illustration of the path that Aramco is planning to follow. Equinor has been listed in New York and Oslo since 2001 and owned by the Norwegian government which has a stake of 67%. Since its listing, the company has refrained from joining any international steps related to regulation of oil outputs. Aramco’s leaders have met with Equinor to talk over the best approach to restructure Aramco’s operations and prepare the IPO (EL GAMAL, LAWLER, 2017).
Saudi Arabia is at the moment still a member of the OPEC but due to those two important points, one could wonder if the OPEC is not about to lose the precious influence of one of their founding member in a foreseeable future.
1.1.3 Comparison to Petroleos Mexicanos (PEMEX)
Petroleos Mexicanos (PEMEX) is the Mexican state-owned oil producing company. The company headquartered in Mexico city is also engaging in the exploration, production, refining and marketing of oil and gas. Pemex operates principally in Mexico, America (North, Central, South) and Europe. In terms of production, Mexico experienced some decrease in production over the years due to a natural decline in matured fields. In 2017, two significant discoveries have been made in Mexico, one offshore by private companies as Mexico changed its fiscal reform in 2013 and one onshore discovered by PEMEX. The latter giving hope for a recovery in PEMEX’s production. (PARASKOVA, 2018)
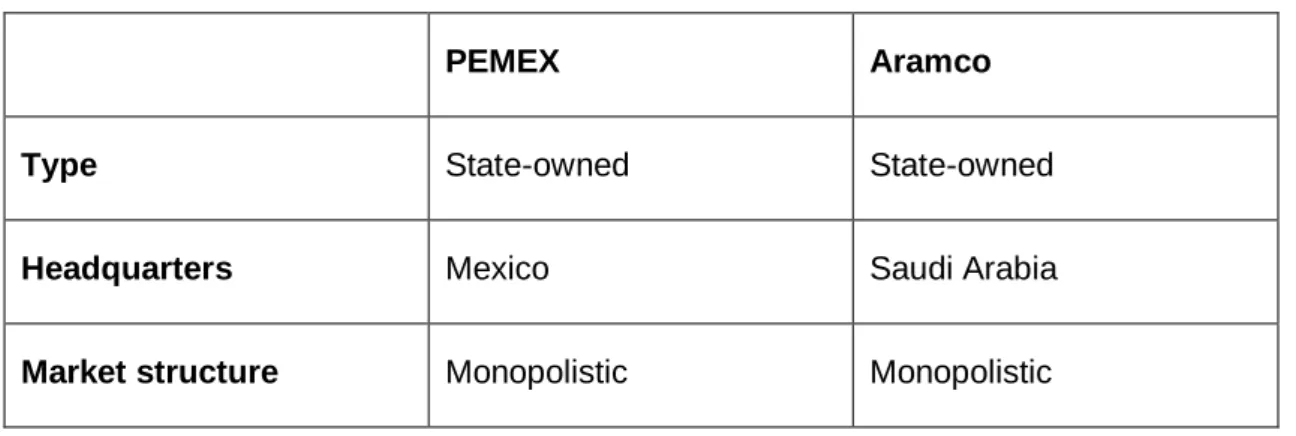
The table below shows the similarities and differences of the two companies. The information and figures were found on PEMEX’s and Aramco’s official website.
Table 1 Comparison of PEMEX & Aramco
PEMEX Aramco
Type State-owned State-owned
Headquarters Mexico Saudi Arabia
Activity Exploration, production, refining, marketing
Exploration, production, refining, distribution, marketing
Region Mexico, America (North,
Central, South), Europe
Asia, North America, Europe
OPEC Member No Yes
Listed company No No - IPO by the end of
2018 for 5%
Oil production 2016 2.154 mmbpd 10.5 mmbpd
Reserves 2016 9.762 billions barrels 260.8 billions barrels
Exports 2016 1’194 thousand barrels 2’799 millions barrels
Type of crude Maya, Isthmus, Olmeca
Heavy crude oil (50%) Medium crude oil (35%) Super light (25%)
Arabian
Super light crude oil Light crude oil
Petroleum fiscal regime Concessionary since 2013 Go-it-alone strategy
Both companies display several similarities; they are state-owned, monopolistic and non-listed. The definition of their activities is similar with the exception of PEMEX not stating distribution as an activity. PEMEX is more active in the West region of the globe with Mexico, America and Aramco in the East region with Asia. Mexico is not an OPEC member, it is however an ally to the OPEC members.
The main difference to highlight for the purpose of the upcoming analysis is the production size; Aramco’s production is almost 5 times bigger than PEMEX’s which will most likely oblige us to take a different approach to a possible hedging strategy.
In terms of crude oil, Maya crude, which is the most common crude oil produced by PEMEX is a heavy crude (high density) that needs special refineries to be pre-treated.
Isthmus crude oil is a medium crude and Olmeca a light crude oil. Arabian crude oils are mainly of high standards and are considered light and super light crude oil. The Sulphur content in Aramco’s crude is also lower than in PEMEX’s making it a sweeter type of crude.
The fiscal regimes of each country, i.e. the set of laws, regulations and agreements governing the profits derived from petroleum exploration and production are different as well. Saudi Arabia has a go-it-alone strategy. It means that the country has chosen to develop its domestic resources on its own. The government formulates and finances an investment program which is executed through the National Oil Company, Saudi Aramco. Saudi Aramco exploits their resources base as a mean of supporting the domestic economy and as a tool to sustain the country’s supply. This strategy can create an under-investment situation, potentially generating stagnation in growth capacity as well as inability to maintain or increase production capacity. This situation happened to Mexico. who has changed its fiscal model in 2013 for a concessionary regime resulting in a narrow opening on its oil & gas sector for international players. It was made through restrictive terms of risk service contracts. It was an crucial change for Mexico who could not allocate large capital in exploration. Opening the oil market to international players allows opportunities for experimentation and innovation. Norway adopted an hybrid solution of NOC (Equinor) and IOC combined. The fiscal reform (Energy Reform) became a law in August 2014 in Mexico (DANIEL, KEEN, MCPHERSON, 2010)
1.2 Derivatives
Financial products, especially derivatives, are generally perceived negatively by the public opinion, particularly when the word “speculation” is employed. Most of the time, when we see a topic on derivatives in the newspapers, it is associated with tremendous losses and scandals – Enron in 2001, Lehman Brothers 2008. But without them, the industrialized world as we know it could not be absorbed by the financial markets. The origins of are related to the development of commercial operations and they date back to very old times. Interest rate swaps, commodity derivatives and currency structured products which we know today are the offsprings of old business practices (PALANIAPPAN, 2017). Trading was a conventional practice and people were exchanging goods and services before the invention of money. One would barter goods it had in excess for goods it lacked (BURN-CALLANDER, 2014). Non-perishable items such as grains or wine were used as a storing value.
Around 4500 BC, the people of Sumer, a region of ancient Mesopotamia – today’s Iraq and Kuwait used clay tablets to represent commodities and recorded delivery dates for traded goods. This practice bears a certain resemblance to futures contracts. (PALANIAPPAN, 2017)
The first example of a derivative transaction was recorded in Aristotle’s work around 600 BC, in ancient Greece, by Thales of Miletus who became the world’s first olive oil derivatives trader. Thales was challenged by an ancient question “If you are so smart, why aren’t you rich?” and so he used his knowledge of astronomy to predict good olive crops in the coming season to become rich. He positioned himself to profit from the rising price of oil; he invested the little money he had to reserve each olive oil press so that he would benefit from its exclusive use during harvest time. When the harvest came, Thales’ predictions became fulfilling and, as he had the monopoly over the production of olive oil, he could charge high price for olive oil which was in high demand. The contract he had made with the owner of the press was in substance, no different from today’s derivatives. It could have been either an option or a forward depending on the terms. By reserving each olive oil press, Thales gave a deposit which entitled him to the use of the press at harvest time. If it was only a right and not an obligation this transaction could have been called an option. If on the other hand, he would have had to pay for the olive oil press at harvest time whether he made a use of it or not, this would have been called a forward. (CHATNANI, 2010)
In the same way, the Athenians used shipping contracts in which they specified the pricing, the type of commodity and its volume as well as a period of time. The practice comes is familiar to forwards contracts. In Medieval Europe, the use of “fair letters” during the Champagne fairs was of a great improvement for trades. They acted like a promise of payment with people buying at one fair and promising to pay at a later one. The Champagne fairs acted like a clearing house settling debits and credits at the end of each day (PALANIAPPAN, 2017).
As demonstrated through common old practices, the evolution of humanity brought the evolution of the financial world, leading us to the financial products we know today.
1.2.1 Types of instruments
The basic idea of derivatives is that traders, producers or consumers want to insure themselves against a risk. On the other hand the counterparty must be willing to take on that risk. In this context, we can therefore talk about risk transfer; the risk being transferred from the seller to the buyer or vice versa.
Derivatives are financial instruments dealing with assets. Hence, they do not perform by themselves, but according to the asset, called the underlying, from which the price derives. A financial derivative can be very broadly defined as a contract whose value depends on the value of an underlying asset.
We can distinguish two types of underlying:
Commodity underlying
Financial underlying
Agricultural, Metals, Energy, …
Publicly traded stock, stock market index,
exchange rate
In this paper, we will look at off-balance sheet instruments such as forwards, futures, options and swaps used to manage financial risk on a commodity underlying. Appendix A sums up the four instruments in a table.
1.2.1.1 Forwards
A forward contract is a private agreement between two counterparties, namely the buyer and the seller, to trade an asset on a specified date in the future. The price is fixed at the time of the conclusion of the contract for a delivery in the future. A forward contract is an Over-The-Counter (OTC) traded derivatives with customized terms and features. The downside to such agreement is that one party may fail to honor its commitment and so each party is taking the credit risk of the other counterparty.
There are two forms of settlement in a forward contract: physically-settled and cash-settled contract. In a physically-cash-settled contract, the seller has to deliver the contract’s specified quantity and the buyer has to pay the agreed price. In a cash-settled contract, no asset is delivered. The spot price of the asset at maturity is compared to the contract’s price and the party loosing must compensate the party gaining for the difference. If the spot price is higher than the contract price, it means that the contract price is more advantageous for the buyer so the seller has to compensate him. Inversely, if the contract price is higher than the spot price, the buyer has to compensate the seller for the difference.
Forwards are generally settled physically and thus require delivery as illustrated in Figure 4 with the example of a wheat farmer. A common motivation to enter into a forward contract is to hedge an existing market exposure which means reducing the cash flow uncertainty arising from the market exposure. The farmer is concerned about the price of wheat in three months’ time, when his crops will be harvested. The farmer is exposed to the risk of declining prices. By entering in a three-month forward contract as a seller,
the farmer can lock-in a price and therefore avoid price fluctuations by securing his cash flow.
The buyer of the forward contract will have the opposite price exposure; he is concerned by the rising price of wheat. It might be an agribusiness which needs wheat as an input in its production and would like to lock-in a price at which it could purchase wheat.
Figure 4 Forward schema
1.2.1.2 Futures
Futures contracts are essentially like forward contracts but standardized and traded on an organized exchange. As seen under the forward section, forward contracts terms are set consensually by the buyer and the seller. In futures contract, the exchange determines all the terms except for the price. The exchange determines the commodity underlying the contract, the quantity of one contract, the delivery date, the grade/minimum quality of the commodity, the delivery point and the currency. Buyers and sellers submit their orders to the exchange and indicate the number of contracts they would like to buy or sell. The exchange then matches the orders. In Figure 5, we clearly see that there is no connection between the buyer and the seller. Orders are made to the organized exchange and payment are made through it as well.
In substance forwards and futures have the same function but the exchange lay important differences.
By its standardization, futures contract generally do not provide a good hedge as customizable forward contracts unless the hedging needs coincide with the terms of the standardized contracts.
Under a forward contract, each party takes on a
counterparty risk. In a futures contract, the exchange guarantees performance of the contract, which means that the exchange becomes counterparty to the buyer and to the seller. This makes it less riskier than a forward; a process is called novation process. The exchange takes on the credit risk through the clearing house. The clearing house is therefore the intermediate to all futures transactions.
To guarantee the performance of the contract obligations, the clearing house has a risk management system which requires each party to deposit a margin. The margin resembles to a “good faith” deposit and serves as a collateral.
The minimum level for the initial margin and the maintenance margins are set by the exchange. At the opening of the contract, each party has to deposit an initial margin which usually represents 10% of the contract value in a margin account. As the clearing house completes mark-to-market calculations every day, margin accounts are debited/credited accordingly. If the futures price rises (falls), the buyer has made a paper profit (loss) and the seller a paper loss (profit); the payment of paper profit/loss is made through the margin. If the loss incurred sets the margin account at a level lower than the maintenance margin, the clearing house sends a margin call to the party concerned. The party concerned has to restore the margin account up to the initial margin the same day to keep the position open.
Through futures contracts, the hedger eliminates the risks. But in reality, it is difficult to eliminate all risks. To eliminate all risks, one would need the futures contract to match perfectly with its physical contract: the quantity, the precise date, the underlying, the quality. If we consider the precise date, a futures contract is subject to a delivery period before which the hedging position needs to be closed or else the contract will turn into a physical contract. The position needs to be offset during the trading period, before the expiry, which usually occurs a month prior to the delivery date. This creates a mismatch calendar wise. The hedge cannot cover a specific contract period. All risks can therefore not be eliminated, the hedger will be facing what we call the basis risk. The basis risk is
the difference between the spot price of the asset hedged and the futures price. It is represented by the widening or narrowing of basis from the moment the hedge is put into place until it is closed.
In the eventuality the asset hedged is similar to the one in the futures contract, the basis risk would equal zero at the expiration of the futures contract. During the hedging period, the basis can be either positive or negative. If the basis is positive, meaning that the spot price is higher than the futures price, the market is said to be in backwardation. If the basis is negative, meaning that the spot price is lower than the futures price, the market is said to be in contango.
If however, the asset hedged is different than the underlying of the futures contract, we are in a situation of cross hedging. In a cross hedging situation, the basis will never equal zero, even at the expiration. The basis can be reduced by finding a futures contract which is highly correlated to the asset hedged. High correlation will result in a lower basis and improved hedge effectiveness. It is important to note that the spot price and the futures price are positively correlated. Futures hedging works to bring a zero-zero sum. In a declining market, a producer who is long physical and short futures, would incur a loss on the spot market when selling physical and a gain on futures when buying back futures. Gains/losses can be made through the basis. When offsetting a hedge, a producer has to go long futures i.e. buy back the same position. If the basis is the same when the hedge is lifted, the producer incurs no gain/loss. However, if the basis is lower, the producer ends up with a higher net price (WISNER, HOFSTRAND, 2015).
1.2.1.3 Swaps
Swaps, like forwards, are OTC contracts. Swaps are effectively portfolios of forwards. In a forward contract, the counterparties commit to a single trade. In a swap, the counterparties commit to multiple trades over several dates in the future. Swaps are financially settled, no physical commodity is delivered. As a bilateral agreement, they are a substitute for futures contracts which allow for a better hedge. They rely on the exchange pricing to define the financial arrangement. The pricing can also be based on trade journal references such as Platts. The attraction of swaps is that basis risk can at times be zero, as OTC contracts can often price against the same price reference as the physical. For example, FOB Gasoil Amsterdam quote against gasoil has a correlation of at 99.9%1.
1
The counterparty risk of the swap can be transferred to a clearing house. The transaction would then be called a cleared swap. A cleared swap benefits from the intermediation of the clearing house but is not executed on the exchange (THE ICE, 2011).
Most commonly used swaps are interest-rate swaps and currency swaps. Commodity swaps involve the exchange of the difference between a specified fixed price and the actual floating price of a commodity.
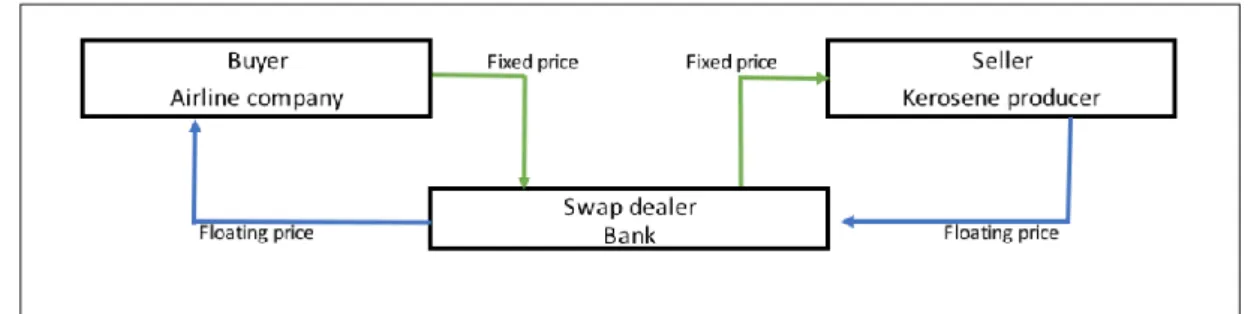
Let us consider the case an airline company, which buys kerosene on an ongoing basis. To reduce the risks related to the price, the company could enter in a forward contract for each payment or, to facilitate the transaction, the company could use swaps to hedge the stream of payments. In a swap, the counterparties set the estimated amount, the maturity of the swap, the payment dates, the floating price ( market price) and the fixed price.
Figure 6 Swaps schema
Figure 6 shows the structure of a swap but it does not represent the cash-flows. In reality the difference is calculated between the fixed price and the variable price and only the counterparty owing money to the other makes a payment. The seller of the commodity, is said to be the seller of the swap and therefore pays the floating price; he wants protection against a falling price. The buyer of the commodity however is seeking protection against a rising price and pays a fixed price. When entering into a swap contract, the swap value is zero, which means that there are no cost to enter into the contract. The changes in prices over the time period will drive the swap value negatively or positively.
In a commodity swap, only one party pays the cash settlement at maturity date.
If the fixed price is higher than the floating price, then the buyer has to pay the cash settlement to the seller.
If on the other hand the fixed price is lower than the floating price, the seller has to pay the cash settlement to the buyer.
In the previous section about futures, we defined basis risk and how it influences a hedge with a futures contract. In crude oil markets, there are three primary types of basis risk: locational basis risk, product/quality basis risk and calendar basis risk. Each of these can be hedge with a basis swap. It is very common for producer to enter into basis swaps on quality basis risk for example. It is the perfect combination to eliminates the risks due to the standardization of the futures.
1.2.1.4 Options
An option is also contract between two counterparties and can be OTC or exchange- traded. An option provides a sort of financial insurance. As the name suggests, options are characterized by optionality. The buyer of an option acquires a right to - buy or sell – a determined quantity of a good at a specified time and at a determined price called the strike price. The buyer is also referred to as the holder of the option or is said to be long. The buyer has the right to exercise at any time up to the expiry date under an American option and under a European option the exercise can only take place at the expiry date. To acquire this right, the buyer pays a premium. The seller on the other leg of the contract has the obligation to - buy or sell - under the conditions set, should the buyer exercises his right. In return, he receives the premium. The seller is also called the writer of the option or said to be short.
The value of the premium has two components: the intrinsic value and the time value. The intrinsic value is represents the difference between the market value and the strike price; it can never be negative. The time value is influenced by the residual maturity and the volatility of the commodity. The further the expiration date of the option is, the greater the risk but the greater the flexibility to act. As we get closer to the option’s expiry, the temporal value diminishes. On expiry date, the time value equals to zero.
A call option premium will be more expensive if the market price is high, the strike price is low, the residual maturity is long and the volatility is high.
A put option premium will be more expensive if, the market price is low, the strike price is high, the residual maturity is long and the volatility is high.
1.2.1.4.1 Two types of option
Call option:
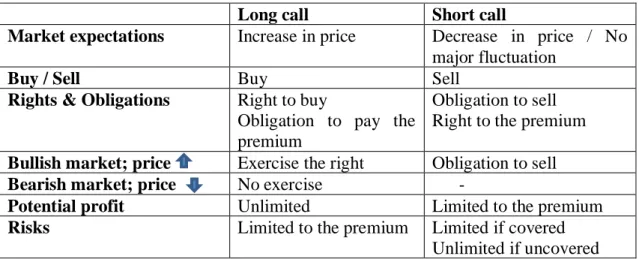
In this context, the buyer is said to take a long call. His market expectations are bullish; he expects the price of the commodity to increase. To acquire his right to buy the commodity at a certain price in the future, the buyer pays a premium to the seller. The
seller on the other hand, has the obligation to sell the commodity if the option is exercised. The buyer will exercise his option if the market price increases. His potential profit is unlimited (as per the commodity price).
Table 2 Call option similes
Long call
Short call
Market expectations
Increase in price
Decrease in price / No
major fluctuation
Buy / Sell
Buy
Sell
Rights & Obligations
Right to buy
Obligation to pay the
premium
Obligation to sell
Right to the premium
Bullish market; price
Exercise the right
Obligation to sell
Bearish market; price
No exercise
-
Potential profit
Unlimited
Limited to the premium
Risks
Limited to the premium
Limited if covered
Unlimited if uncovered
Put option:The buyer takes a long put. His market expectations are bearish; he expects the price of the commodity to decrease. Like in the call option, the buyer pays the premium to acquire his right to sell and the seller receives the premium. The buyer will exercise his option if the market price decrease below the strike price. His potential profit is – strike price minus the premium –and his risk is limited to the premium.
Table 3 Put option similes
Long put
Short put
Market expectations
Decrease in price
Increase in price / No
major fluctuation
Buy / Sell
Buy
Sell
Rights & Obligations
Right to sell
Obligation to pay the
premium
Obligation to buy
Right to the premium
Bullish market; price
No exercise
-
Bearish market; price
Exercise the right
Obligation to buy
Potential profit
Limited to
strike price - premium
Limited to the premium
Risks
Limited to the premium
Limited to
1.2.1.4.2 Four strategies
Long call
A wheat consumer is concerned that the price of wheat will rise due to a supply shortage caused by dry weather for example. He buys an option:
1 call wheat $300.00 June 2017 $15.00 (American)
It is a long call which allows for the purchase of wheat at $300.00 until June 2017. To acquire this right, he pays $15.00. The buyer makes a profit when the price of wheat is higher than the strike price plus the premium ($300.00+$15.00 = $315.00). The potential profit is said to be unlimited; the higher the market price – the higher the profit. At the expiry, if the price is below $315.00, the buyer will not exercise and his maximum loss is the premium ($15.00).
Long put
A wheat producer is concerned the price of wheat will fall due to over-supply for example. He buys an option:
1 put wheat $300.00 June 2017 $15.00 (American)
It is a long put which allows for the sale of wheat at $300.00 until June 2017. To acquire this right, the buyer pays $15.00. The buyer makes a profit when the market price is below the strike price – the premium ($300.00 - $15.00 = $285.00). As the market price falls, the profit increase. Above $285.00, the buyer makes a loss however limited to the premium.
Short call
A wheat producer is concerned the price of wheat will fall. He sells an option: 1 call wheat $300.00 June 2017 $15.00 (American)
It is a short call which obliges the producer to sell wheat at $300.00 if the option is exercised by the buyer. The producer realizew a benefit if the market price is below the strike price + the premium ($300.00 + $15.00 = $315.00) at the expiry date as the buyer would not exercise under those circumstances. The maximum benefit is the premium ($15.00). In the eventuality the buyer exercise the option, the producer has the obligation to sell wheat at $300.00.
Short put
A wheat consumer is concerned the price of wheat will increase. He sells an option: 1 put Wheat $300.00 June 2017 $15.00 (American)
It is a short put which oblige the consumer to buy wheat at $300.00 if the option is exercised by the buyer. The seller’s potential profit is limited to the premium and risks are limited to the strike price minus the premium ($300.00 - $15.00 = $285$).
Figure 7 shows the options diagram for the four types of strategies described above. Figure 7 Options diagram
The diagram illustrates the limitation in profit for a long put and a short call; one is limited to the strike price minus the premium and the other one to the premium. The long call offers a possibility of unlimited profit as the latter would rise up with the market price. The riskier option of all is consequently the short call with an unlimited potential loss if the transaction is undertaken uncovered. The others are limited to the premium or to the strike price minus the premium.
Holding a call option therefore provides an insurance to the holder against an increase in the price of the commodity while allowing the holder to take advantage of price decreases. There are thus no real alternative to options, as the other instruments fix a price without providing optionality to act. However, it involves an up-front costs of buying an option (premium) to compensate against the optionality to exercise.
1.2.2 The potential risks
We find three factors which need to be taken into account when evaluating the risks of derivatives usage; leverage, volatility and liquidity.
Leverage is a great “factor” in derivatives instruments which creates a good potential for large gains but it does also leverage a losing position if the market moves in the wrong direction.
Volatility adds up to the leverage effect. If the underlying asset displays high volatility and unexpected price movements, the effects of leverage will amplify the movements under the derivative contracts leading possibly to larger losses.
Volatility accompanies liquidity. If the market is not liquid enough, it makes it harder to exit a position and it therefore increases the risk of the position. Liquidity facilitates the distribution of financial risk to market participants who are more able to bear the risks or are willing to take them on.
2. Analysis
As seen in the derivatives section, derivatives are useful instrument to manage risks. They can be used to hedge an existing market exposure (futures & forwards), to obtain downside protection from an exposure without giving up the upside potential (options) and to transform the nature of an exposure (swaps).
2.1 Research methodology
To undertake the analysis, the resources used are primary and secondary researches. Both researches provided me with quantitative and qualitative data.
For primary research, I used company financial reports to see what were the hedging practices in place, if existing, and to understand the managerial decision taken. Quantitative data was collected from Auditoria Superior de la Federacion, a Mexican government website, the Petroleos Mexicanos, Saudi Aramco’s, EOG Resources’, BP’s, Equinor’s as well as the Bank for International Settlements’ websites. Some quantitative information was also gathered from secondary resources such as Bloomberg website or platform.
The websites listed above were also used for qualitative data about companies. I have additionally collected information in press articles, principally to gather information about the Hacienda Hedge. Concerning the theoretical aspect of my thesis, I read books and reports.
2.2 Study of derivatives
2.2.1 The market size
Despite the general negative opinion about financial derivatives, financial derivatives are widely used. Derivative markets are often estimated at $1.2 quadrillion at high-end (CHANG, 2017), exchange and OTC combined, however some analysts believe the figure is vastly overstated. Figures in tables below have been retrieved from the Bank for International Settlements to assess the size of the market.
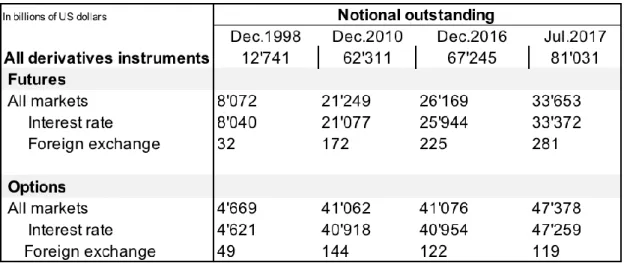
Table 4 and 5 describe the size of the world derivatives market. The first table represents the notional outstanding on standard exchanges. Table 4 only shows futures and options on interest rate and foreign exchange. The Bank for International Settlements did not present any data breakdown per underlying as a result no details were available on commodities contracts as well as no information on the gross market value.
Table 4 Exchange-traded futures and options
Source: The Bank for International Settlements
As of July 2017, the notional outstanding was at $81 trillion ($33 trillion in futures and $47 trillion in options). In over two decades, the notional outstanding has quadrupled. From 2010 to 2017, the size of the exchange has increased by 30% and we have had a shift between the use of futures in 1998 and to the use of options. As of 2010, options are the predominantly used instruments. Over the past years, we have been in a situation of sustained trends on all markets (equity, bonds and commodities) which I believe could explain the shift in utilization. Volatility has decreased in most markets which induce that option premiums are less expensive and therefore more attractive.
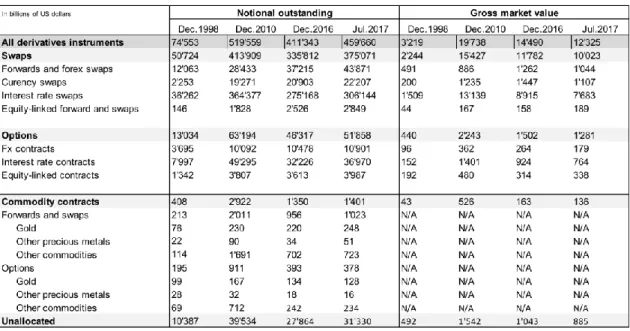
Table 5 shows the notional outstanding in OTC derivatives market amounting to $459 trillions in July 2017; notional amounts represent the face value of the underlying asset. The gross market value represents $12 trillions. Gross market value is a better indication of the actual risk as it characterizes the total value of outstanding contracts. We can see an increase from 1998 to 2010, from a gross market value of $3 trillions to $12 trillions. In over two decades, OTC derivatives market expanded greatly with swaps representing 80% of the market, followed by options (11%). Lastly, we find commodities contracts separately for the purpose of the thesis. The notional outstanding representing $1.4 trillions; $1’023 billions in forwards and swaps and $378 billions in options. Forwards and swaps amounting to $136 billions in gross market value.
Table 5 Global OTC derivatives market
Source: The Bank for International Settlements
As the OTC market involves bilateral agreements, I suspect that the information available are not representative of the actual market size as data is not always available. The figures collected do not come close to the $1.2 quadrillion estimation. I believe calculations were made on the notional amount. OTC and exchange markets combined come to a notional outstanding of $540’690 billions (OTC $459’660 billions + $81’031 billions exchange traded) The result is greater in value than all stock markets combined ($73 trillion) (CHANG, 2017). This amount come close to low-end estimation of $540 trillion as made by analysts. I believe it is more accurate to look at the gross market value. Due to the lack of transparency of the exchange, only OTC gross market is available. However, with a $136 billions of gross market value on commodities contracts only, we can consider that the market is displaying sufficient liquidity
2.2.2 PEMEX & the Hacienda Hedge
The Hacienda Hedge is the largest oil trade made on Wall Street, as stated in Javier Blas’s article “Uncovering the Secret History of Wall Street’s largest oil trade”. Every year since 2008, Mexico hedges a great amount of the country’s production. The decision involves a dozen representatives from three Mexican government ministries and Pemex. It is executed through a couple of oil trading desks such as Barclays, Goldman Sachs, Morgan Stanley, Deutsche Bank. PEMEX buys put options which give them the right to sell oil at a predetermined future price. Their outlook on the market is that the price will drop and they want to be insured against it. This type of deal has been a thinking since the 1980s when Mexico was seeking to stabilize its fiscal stance. It was however undertaken for the first time in 1990 after Saddam Hussein invaded Kuwait. The country did not want to suffer another oil crisis like the one in 1985-86 when Saudi Arabia submerged the market by increasing its production and prices plummeted. After that, Mexico did not enter in a hedging program for years until the early 2000s. (BLAS, 2017).
2.2.2.1 Annual reports
In its annual reports, PEMEX recognizes the use of financial derivatives to manage interest rate risk, exchange rate risk as well as commodity price risk for natural gas. Concerning crude oil, the company states in its Notes to the Consolidated Financial Statements 2008;
“Under its fiscal regime, Pemex transfers most of its risk related to crude oil prices to the Mexican Government. As a consequence, Pemex generally does not enter into long-term hedging transactions against fluctuations in crude oil prices. During 2008 and 2007, Pemex did not enter into any crude oil price hedging transactions.”.
As a result, no evidence of derivatives practice was found in the annexes on crude oil derivatives for those years. In 2009, the company engages in futures contracts (7.15 MMb) and exchange traded swaps (2.86 MMb). In 2010, they used futures for 4.93 MMb and exchange traded swaps for 0.32 MMb as well as in OTC swaps for 0.55 MMb (PEMEX 2010 Annual report, p. 59). In 2011, PEMEX used the same type of derivatives. Regarding annual report 2012, the derivatives products were classified as non-hedging instruments as they do not qualify to the strict requirements of IAS 39 (PEMEX 2012 Annual report, p. 50). After 2013, there is no annual report available in the publication section on Pemex’s website.
As seen in accounting class, under IFRS and US GAAP, derivatives instruments used for hedging purposes are not recorded in the balance sheet. However I read another
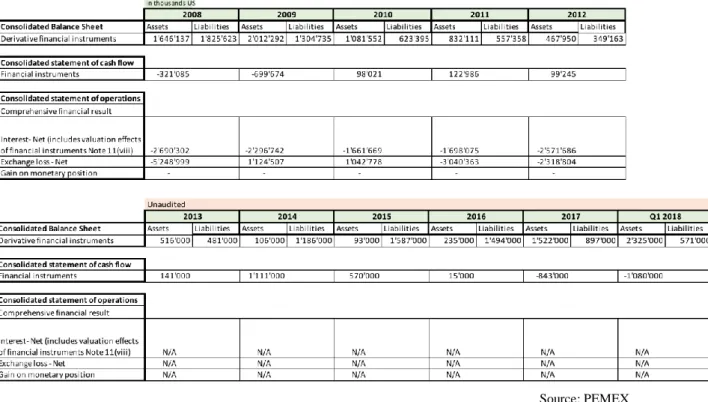
note in the annual reports concerning the differentiation in accounting arising from derivatives used in the purpose of trading and hedging. Financial derivatives recognized in the balance sheet were valued at fair value. Changes in the fair value of derivatives held for trading purposes are recorded in the cash flow results and derivatives used as hedge are recorded in the statement of operations using the fair value method. It is not clear what the criteria are for an instrument to be considered as a hedge. In Table 6, we find the reported financial results of PEMEX expressed in USD. The figures from 2008 to 2012 are audited results. The reports starting of 2013 are unaudited and did not mention any distinction between financial instruments used for hedging and trading. The consolidated statement of operations was not available either.
From 2009 to 2012, PEMEX recorded losses 3 years out of 5. Profits were recorded in 2009 and 2010 for respectively $1’124’507 and $1’042’778 thousand. No further information was found in the details of the transactions.
Table 6 Pemex’s consolidated results
Source: PEMEX
Some unaudited annexes on the financial reports produced for each quarter starting of 2012 revealed information on crude oil derivatives. The company reported crude oil stock market futures, stock market swaps i.e. cleared and OTC swaps. Appendix B is a composition I have made from the annexes on financial reports starting of 2015. The information found shows the utilisation of swaps and futures from 2015 to the first quarter of 2018. Starting of the second quarter of 2017 only, Pemex has been using options.
However, transactions do not correspond to the world’s largest oil trade because of its quantity and no option strategy was recorded before 2017.
The information found is therefore considered as internal practices of PEMEX. From 2012 to 2016, Pemex as a company did not enter in any option contract, failing to predict the drop in price in 2014. It is only when the price started rising again, in the second quarter of 2017, that PEMEX entered into a hedging strategy which included options for $228 million representing 68.7 million barrels as per Appendix B. The hedging program is still on going as per the information gathered for the first quarter of 2018. As seen previously, it comes with no surprise that options are used during high prices to protect against an eventual fall in prices by buying a put option.
From 2008 to 2018, PEMEX is utilizing both markets – spot and futures- and therefore reduces its price risk by being only concerned by the basis risk. The oil market being volatile, limiting the risk to the basis risk is a great way to reduce the financial impact of changing price. The company has also been using swaps. A better way to mitigate risk for PEMEX would have been to enter into a basis swap on top of the futures contracts, in order to mitigate the basis risk.
As a result, no information concerning the largest oil trade on Wall Street was found on PEMEX’s annual reports and annexes which explains why the Hacienda Hedge accounts for Mexico’s profit. The decisions are not internal to the company and the deals are managed on a governmental level even though it is technically PEMEX’s production which is being hedged. It is however notorious that Mexico hedges every year and the information are to be found in the legislature’s annual audit; the “Auditoria Superior de la Federacion” (ASF).
2.2.2.2 Auditoria Superior de la Federacion
In order to better understand the Hacienda Hedge, I looked at the Auditoria Superior de la Federacion (ASF) website in Spanish. Some hedging programs implemented by the country are registered at the ASF. We find information on execution details such as trades date, quantity, cost and even benefits being transferred to the Federal Government.
Figure 8 displays the amount of barrels bought from 2009 to 2016 as part of the Mexican hedging program as well as each deal’s average price. The figures correspond to millions of barrels and US dollars per barrel.
On average, the country has hedged 233 millions barrels per year with average prices higher in 2012-2015 when oil prices were relatively high.
Figure 8 Mexican oil hedging 2009-2016
Source: Secretaria de Hacienda y Crédito Público
With daily production decreasing from 2'601 to 2'154 thousand barrels between 2009 and 2016, the hedging program covers on average 24% of the total production with an average of 233 million barrels per hedging program, i.e. per year as per my calculation in Table 7. In 2009, Mexico hedged about 10% more than its average, as prices were reaching $140.00 per barrel. The hedging program is based on Maya crude, so I have calculated the portion of the deal considering only Maya crude oil production. Mexico hedges about 50% of its Maya crude oil production every year. With options, it is not necessary to hedge the entire production, which is fortunate, as the market would not sustain such a large contract size. The contract size is one of the reason Mexico buys its OTC option through a number of investment bank. The biggest hedging programs were set in 2006 and 2008 for 454 and 435 million barrels respectively. This characteristic is key as to discussing the possibility for Saudi Arabia to enter in such program due to the size of its production. Obviously, this calculation of the hedging amount should not take into account the secured sales nor their proper consumption.
Table 7 Production/Hedging size comparison 2009-2016
Source: PEMEX & Secretaria de Hacienda y Crédito Público
Figure 9 displays the total cost related to the oil hedging program since 2001. The cost has been calculated based on the information found in a report of the “Centro de Estudios de la Finanzas Publicas”. As figures were available in million Pesos, I have calculated the cost and the profit in US Dollars by averaging the annual exchange rate published quarterly on the Bureau of the Fiscal Service – US Treasury Department. The calculations are to be found in Appendix C. Hedging costs vary between $217 million and $1’257 millions.
Figure 9 Hedging Program Cost in Million USD 2001-2017
During the 15 years of the hedging program, Mexico has not exercised its option every time and has only made a profit during three years; 2009, 2015 and 2016 as shown in
table 8 below. The revenues generated in 2009, 2015 and 2016 were respectively of $5.0 billion, $6.5 billion and $2.8 billion. The three-year revenues of $14.5 billion minus the cost of the premium of $11.6 billion comes out to a total profit of $2.8 billion. On a year basis, the average profit is $190 million which is an unneglectable amount. I understand that assessing the benefits for Mexico is more complex than simply looking at the difference in costs and revenues.
Table 8 Hedging Program 2001-2017
Source: Centro de Estudios de la Finanzas Publicas (CEFP)
I have retrieved the price of Brent crude oil since 2008 to 2017 to compare each years strike price with low-high-average prices as Maya crude was not available. We note on table 9 that despite low prices going below the strike price in 2008 and 2014, the option was not exercised as the average was higher than the strike price. In 2009, the low price was higher than the one in 2008, but the average was lower than the strike price of 2019. By looking at the years where options were exercised, we observe that the average price needs to be below the strike price for it to represent low price level i.e. a bearish market. It is not sufficient to have prices drop to really low levels and oscillate at higher heights. Indeed, in the Mexican program, the type of option bought seems to be Asian style put options (BLAS, 2017) which compares the strike price to an average price over a certain period rather than one price at the expiration like in European option. Profitable years for Mexico were represented by low oil prices and preceded high oil prices. The 2009 strike price of $70 was set during 2008, when oil price experienced all-time high. From July to
September 2008, prices moved from $143.68 to $93.52. It is hard to say exactly when the put options were bought, but it was certainly during that period of time. The percentage on high and on average I calculated represents the percentage of the strike price on high and average prices from the previous year. In 2009, it means that if based on $143.68, the strike price represents 48.72% of 2008 high price and 78.72% of 2008 average price. $88.92. 48% does not range in the habitual practice, and is biased by the exceptional high oil price. I believe the strike price usually represents between 67% and 78% of the market price. As the premium is influenced by the strike price as well, it would be more expensive for Mexico if the strike price was high compared to the market price at the time of conclusion. I think strike price are more likely to be set around 70% of the market price i.e. based on high prices. Premiums tend to be more expensive when the strike price is high compared to the market price in put options.
Table 9 Brent crude oil price 2008-2017
Source: Macrotrends
2.2.2.3 The 2008-2009 hedging period
Due to the secrecy of the deal I have not been able to find detailed information about the construction of the Hacienda hedge in 2008-2009. As seen in Table 10, the deal was made through four banks over August and September 2008. Barclays took the biggest part of the deal (220 million barrels) followed by Goldman Sachs (85 million barrels). Deutsche Bank bought 15 million barrels and Morgan Stanley 10 million barrels. As the banks executed the deal, oil prices started falling, reaching an average of less than $55 per barrel in 2009. With an average option price of $70, Mexico was making a great deal. The annual hedge made by the government is composed of a mix of Maya and Brent; a decade ago the Mexican Government locked in the price of WTI but this practice created issues because of the changing relationship between WTI and Maya. As a result, Brent
considered as a world standard has been chosen to be mixed in the deal with 80-90% of Maya crude oil.
Table 10 Options calculations on Pemex’s 2008-2009 deal ($)
Source: BLAS Javier – Bloomberg Markets
When the price dropped under the average strike price, PEMEX exercised their option. By the end of December 2009, the four banks had transferred the balance due to Mexico. Mexico’s revenue on this deal was $5’084’873’500 ($5 billion).
The revenue in the article by Blas Javier for 2009 hedging program was reported in Appendix C to avoid a difference of 223 million dollars. The difference would arise from the exchange rate average calculated in the appendix. The calculations undertaken are of general guidance for the purpose of the thesis. It was therefore not necessary to calculate 2009 revenue.
We note in Table 10 a differential between the strike price of Maya and Brent crude oil. The differential of $18.00 and $20.50 is quite significant (21-24%). The reason for the price difference arises from the difference in quality. Maya crude oil has a 22°API gravity and 3.3 % sulfur (PEMEX, Glossary). API gravity characterized whether the crude oil is light or heavy. At 22°API gravity, Maya crude is a heavy crude. The higher the number, the lighter the crude. We consider crude oil to be light at 30°API gravity (PETROLEUM.CO.UK, 2015). The sulfur content tells us if the crude oil is sweet or sour. The lower the sulfur content, the sweetest the crude oil. A sweet crude oil is easier to refine and safer to extract. Crude oil is considered sour at 0.5% of sulfur content (PETROLEUM.CO.UK, 2015). Maya crude oil is therefore a heavy sour crude oil. As a comparison, Brent crude oil, 38.06°API gravity and 0.37 %. Brent crude oil is a sweet light type. This is the reason why we observe an important differential.
The second reason is locational. Crude oil produced further from market will incur higher transportation costs to get to the market.
In Figure 10, we see that prices of different crude oils move largely in coordination. I have chosen to compare Brent with Arab Light, Arab Heavy and Maya, four different quality of crude oil which illustrates differentials due to quality and location. We can see that Arab light’s curve is closer to Brent’s. The quality of Arab light being 33.4°API gravity and 1.77 % sulfur (MCKINSEY) making it a light but sour crude oil. Arab heavy is a heavy and sour crude oil (27.4°API gravity and 2.80 % sulfur) like Maya crude oil. Compared to Maya crude oil, Arab heavy is indeed less heavy and less sour, as confirmed by the chart.
Figure 10 Maya-Brent-Arab crude oil differential
Source: Oilprice.com
2.2.2.4 The 2009-2010 hedging period
The size of this hedging was of 230 million barrels at an average option price of $56.69. It was of a duration of five months, going from August 2009 to December 2009. To finance the deal, an amount of Pesos 18’000’000’000 (18 billion) was borrowed from the Fondo de Estabilizacion de los Ingresos Petroleros (FEIP). The cost of the premium was of $5.0827/ barrel and involved a cost of $1’171’669’000 (1.1 billions) representing Pesos 15’554’996’200.
Table 11 displays the type of crude, the number of operation needed to concretize the deal, the amount of barrels expressed in million as well as the premium price, the strike price and the total cost in million dollars and pesos. Strike price in the 2009-2010 hedging
program demonstrated as well a differential of 15% (56.00/66.00*100) between Maya and Brent crude oil. The differential was however much lower than the precedent year for unknown reason. Maya premium per barrel on 110 million barrels and 100 million barrels was different. The difference is related to the bank taking the counterparty. It seems that Goldman Sachs has priced a lower premium ($4.8729) on 110 million barrels than JP Morgan and Barclays Capital ($5.318 per barrel).
Table 11 Options’ purchase 2009-2010
Source: Secretaria de Hacienda y Crédito Publico
The information about the 2009-2010 hedging program give us a greater understanding of the structure of the deal. Table 12 demonstrates the number of transaction required to conclude the program. Three trading desks were involved: Barclays, Goldman Sachs, JP Morgan. The deal was split into 43 transactions; Barclays 16 transactions, Goldman Sachs 24 transactions and JP Morgan 3 transactions. This represents an average of 5’348’837 barrels per transaction. On a five-month period, considering that the banks are open Monday to Friday, we have 100 days on which to split 43 transactions; a transaction would have been executed roughly every second day.
Table 12 Counterparties intervening in 2009-2010 hedging program
Source: Secretaria de Hacienda y Crédito Publico
The 2009-2010 options were not exercised but the structure gives us an idea of the procedure of the deal which could be applied to Saudi Aramco’s case. If options were