13th Belgian Day on Biomedical Engineering – joint meeting with IEEE EMBS Benelux Chapter November 28, 2014
TRACKING STRESSED BLOOD VOLUME
DURING VASCULAR FILLING EXPERIMENTS
A. Pironet1, P. C. Dauby1, J. G. Chase2, T. Desaive1
1GIGA-Cardiovascular Sciences, University of Liège, Belgium
2Department of Mechanical Engineering, University of Canterbury, New Zealand
Abstract
A three-chamber cardiovascular system model is used to compute stressed blood volume from filling experiments. As previously observed, stressed blood volume is a good predictor of the change in cardiac output after fluid infusion. Keywords: biomechanics – bioinformatics 1. INTRODUCTION
Total stressed blood volume (SBV) has been associated with the success or failure of fluid resuscitation therapy, which is a treatment to restore cardiac output (CO) in critically ill patients [1]. Current methods to determine SBV involve repeated phases of circulatory arrests followed by fluid infusion. In this work, a model-based method is developed to track SBV during vascular filling experiments.
2. METHODS
A simple cardiovascular system model is used, containing three chambers: the heart, the arterial system and the venous system. The model parameters (including SBV) are identified from hemodynamic experimental data, according to a previously described procedure [2].
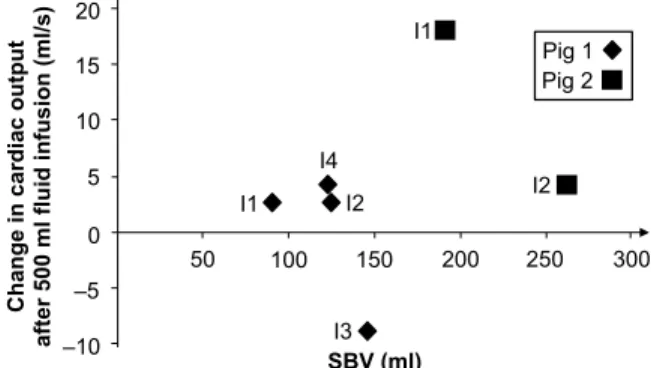
The hemodynamic data were recorded during vascular filling experiments (successive infusions of 500 ml saline solution) on two pigs. The first pig received four infusions (I1 to I4) and the second, two (I1 and I2).
3. RESULTS
Figure 1 shows the measured change in CO after each 500 ml fluid infusion as a function of the SBV value computed by fitting the model to the data. As seen on this figure, neither CO nor SBV changed monotonously during the experiments, underlining the complexity of predicting the effects of fluid infusion.
50 100 150 200 250 300 0 –5 –10 10 15 5 20 SBV (ml) C h an g e in c ar d ia c o u tp u t afte r 50 0 m l fl u id in fu si o n (m l/s ) Pig 2 Pig 1 I4 I2 I1 I3 I2 I1
Fig. 1 – Change in cardiac output after each 500 ml fluid infusion as a function of the identified SBV value.
As observed in humans by Maas et al. [1], the higher the SBV, the lower the increase in CO. However, the response curves seem to be subject-specific, which was not observed by Maas et al. since only one fluid infusion was performed per patient.
4. CONCLUSION
SBV is identified using a simple cardiovascular system model, whose parameters are adjusted to fit data from vascular filling experiments in pigs. SBV seems to be a good predictor of the change in CO after fluid infusion. More experiments are currently being performed to further investigate the effects of vascular filling. References
[1] Maas, J. et al. Bedside Assessment of Total Systemic Vascular Compliance, Stressed Volume, and Cardiac Function Curves in Intensive Care Unit Patients. Anesthesia &
Analgesia, 115(4), 880-887, 2012.
[2] Pironet, A. et al. Model-Based Computation of Total Stressed Blood Volume from a Preload Reduction Experiment. Proceedings
of the 19th IFAC World Congress,