Publisher’s version / Version de l'éditeur:
Vous avez des questions? Nous pouvons vous aider. Pour communiquer directement avec un auteur, consultez la première page de la revue dans laquelle son article a été publié afin de trouver ses coordonnées. Si vous n’arrivez pas à les repérer, communiquez avec nous à [email protected].
Questions? Contact the NRC Publications Archive team at
[email protected]. If you wish to email the authors directly, please see the first page of the publication for their contact information.
https://publications-cnrc.canada.ca/fra/droits
L’accès à ce site Web et l’utilisation de son contenu sont assujettis aux conditions présentées dans le site LISEZ CES CONDITIONS ATTENTIVEMENT AVANT D’UTILISER CE SITE WEB.
Building Research Note, 1973-05
READ THESE TERMS AND CONDITIONS CAREFULLY BEFORE USING THIS WEBSITE. https://nrc-publications.canada.ca/eng/copyright
NRC Publications Archive Record / Notice des Archives des publications du CNRC :
https://nrc-publications.canada.ca/eng/view/object/?id=dfe8c252-423c-4685-9906-31407f3affe3 https://publications-cnrc.canada.ca/fra/voir/objet/?id=dfe8c252-423c-4685-9906-31407f3affe3
NRC Publications Archive
Archives des publications du CNRC
This publication could be one of several versions: author’s original, accepted manuscript or the publisher’s version. / La version de cette publication peut être l’une des suivantes : la version prépublication de l’auteur, la version acceptée du manuscrit ou la version de l’éditeur.
For the publisher’s version, please access the DOI link below./ Pour consulter la version de l’éditeur, utilisez le lien DOI ci-dessous.
https://doi.org/10.4224/40000620
Access and use of this website and the material on it are subject to the Terms and Conditions set forth at
Acoustical investigation of ceiling performance in an open office
ACOUSTICAL INVESTIGATION O F CEILING
PERFORMANCE
INA N
OPEN
OFFICEby
A. C.
C.
Warnock50640
+ C + - CANADASAUE DES
MACK!NES
NsaErnoTs
a
a-
I
0
D A T E ~ ~ ~ N I I I . ~ L E SfiJ
.
-
j - 1ill
-/,*ng Researc
I Ser THl s92 no. 88 c . 2 BrnE - -D l Y l S l O N O F BUILDING R E S E A R C H-
M A T l O M A P R E S E A R C H C O U N C I L O T f A W A C A N A D ANO
B f i
ACOUSTICAL
INVESTIGATION
O F CEILINGPERFORMANCE IN
AN O P E N OFFICEby
A . C . C . Warnock
ABSTRACT
This Note d e s c r i b e s an acoustical investigation of flat ceiling
properties in an open office. The experiments w e r e concerned p a r - t i c u l a r l y with the e f f e c t s of different ceiling materials, baffle c a n -
figurations and screen a r r a n g e m e n t s , The r e s u l t s obtained are
analyzed in terms of articulation index giving a single figure rating t h a t facilitates comparisons. A short theoretical outline of screen-
ceiling interaction emphasizes the i m p o r t a n t c e i l i n g and screen para
-
meters and r e f e r s to areas where new t e s t procedures a r e needed.
INTRODUCTION
The acoustical privacy of an open office i s extremely dependent
on the reflection of sound f r m the ceSling assembly. The experiments
d e s c r i b e d in this Note w e r e designed t o compare the performance of three
t y p e s of ceiling materials used with and without ceiling baffles. T o determine the influence of screen height on the acoustical privacy b e -
hind a screen, two screen heights were used, 4 f t 8 in. and 6 ft. The experiments w e r e designed and carried out by the Building Physics
Section of the Division of Building Research, N . R . C . , in a sixth f l o o r
office of the Kenson Building,Metcalfe Street, Ottawa.
1 E X P E R M E N T A L TECHNIQUE
The privacy conditions in an open office are closely related
to sound propagation in the office space, and can be examined by m a k i n g
the appropriate acoustic measurements.
In
the open air, in the absenceof obstruction and atmospheric disturbances, the sound pressure level
from a continuous s o u r c e w i l l decrease by 6 d B each t i m e the distance
v e r y absorbent r o o m such as an anechoic c h a m b e r , At the
other extreme, in a reverberant space bounded by highly reflective surfaces, one quickly e n t e r s the r e v e r b e r a n t field where the sound
pressure l e v e l does n o t decrease appreciably with distance from
the source.
The objective of an open office i s to approach, as closely
as i s practicable, an open air case, hence the specification of a b s o r -
bent surfaces and furnishings, The propagation experiments described here were intended to measure the effects of ceiling materials, ceiling b a f f l e s m d s c r e e n configurations on the propagation of sound in an
office.
The office used f o r these studies was fairly narrow and, in
an attempt to reduce possible reflections from a nearby wall, the wall
was covered with about 2 in. of glass fibre. The ceiling boards in the office measured 4 f t by 2 f t and w e r e supparted on T - b a r s . Details
of the t h r e e types of ceiling boards u s e d are given in Appendix A. The baffles w e r e simply constructed f r o m piece s of ~ / 4 - i n , plywood measuring
4 ft by 1 f t and covered a n one face with 518-in. g l a s s f i b r e which had
a perforated vinyl facing. W h e n used these baffles w e r e suspended on
hooks from the T-bars with the glass fibre side facing the sound source.
The screens used w e r e cornmercialy manufactured and measured
4 f t 4 in. high, 5 f t wide and 3 in. thick. The bottom edges of the screens
w e r e 4 in. from the floor raising the tops t o a height of 4 f t 8 in. One of t h e screens was modified by clamping to it a piece of 1/8-in. hardboard
which was covered on both s i d e s with 1 1 1 2 in. of g l a s s f i b r e thereby i n c r e a s i n g the aver-all height to
6
f t ,Figure 1 outlines the experimental procedure u s e d in making the continuous sound propagation measurements. The long axis of the
column laudspeaker was placed horizontally in a f u r t h e r attempt t o
reduce the effects of the walls and windows. The recordings w e r e
analyzed in the l a b o r a t o r y an a r e a l time analyzes and the third-octave band levels obtained w e r e t h e n reduced to octave band readings, The results a r e presented and discussed i n the next section.
It is g e n e r a l l y true that t h e r e are several acoustical paths between two points in an office, Continuous measurements d o not separate these paths and give only the total effect produced by all of them.
h
an effort to s o r t out these paths, measurements were madeusing pulse s of sound, It w a s found that if the duration of the pulse
w e r e short enough it was then possible, under appropriate conditions,
t o identify and separate the different components
.
The apparatus used to carry out the pulsed study is shown in
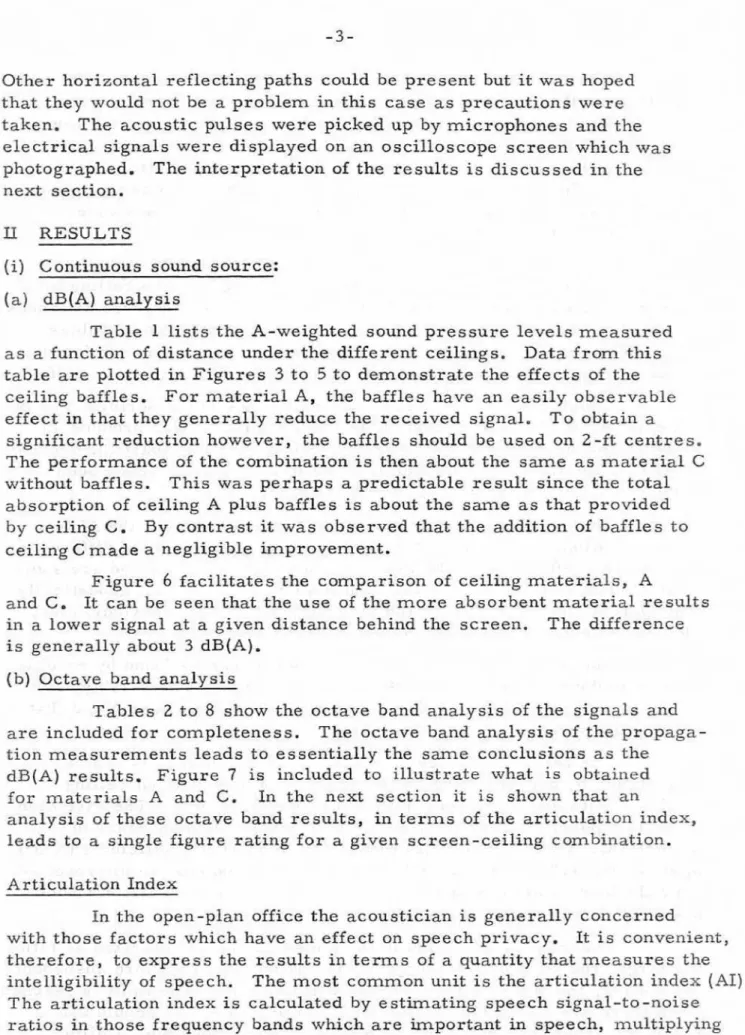
Other horizontal reflecting paths could be present but it was hoped
that they would not be a problem in this case as precautions were
taken. The acoustic pulses were picked up by microphones and the electrical signals w e r e displayed on an oscilloscope screen which was photographed. The interpretation
of
the results i s discussed in thenext section.
U
RESULTS(i] Continuous sound source: (a) dB(A) analysis
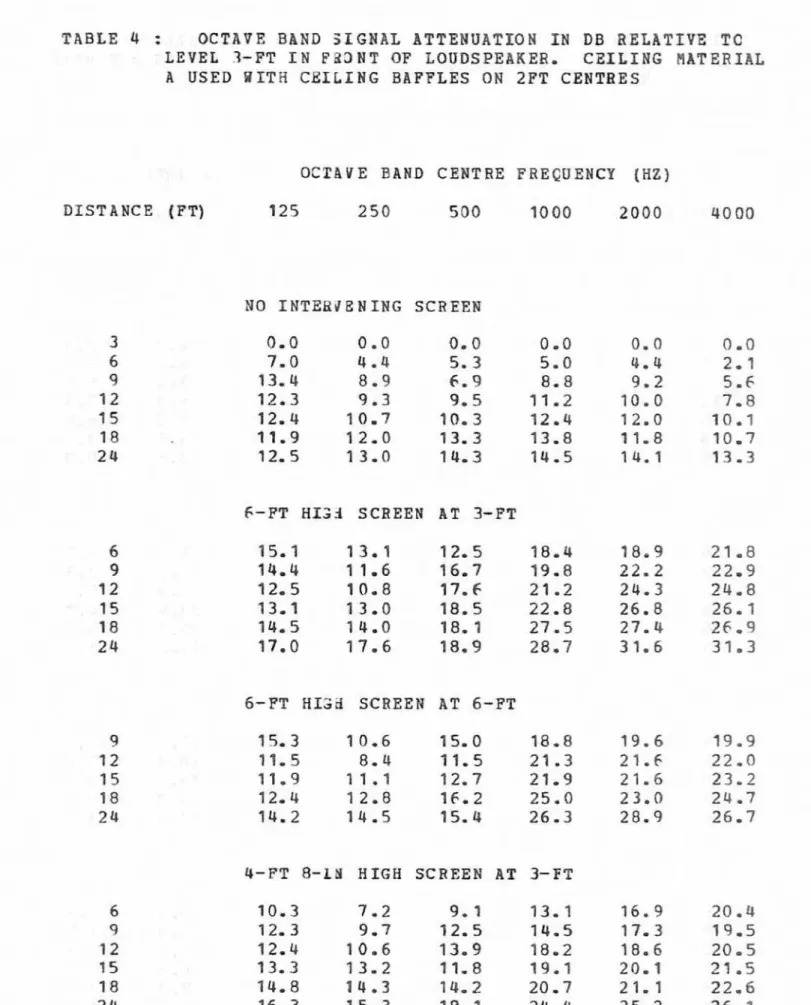
Table 1 lists t h e A-weighted sound p r e s s u r e levels measured
a s a function of distance under the different ceilings. Data f r o m this
table are plotted in Figures 3 to 5 to demonstrate the effects of the
ceiling baffles. F o r material A , the b a f f l e s have an easily observable
effect in that they generally reduce the received signal. T o obtain a
significant reduction however, the baffles should be used on 2-ft centres.
The performance of the combination is then about the sarne a s material
C
without baffles. This was perhaps a predictable result since the total
absorption of ceiling A plus baffles is about the s m e as that provided
by ceiling
C.
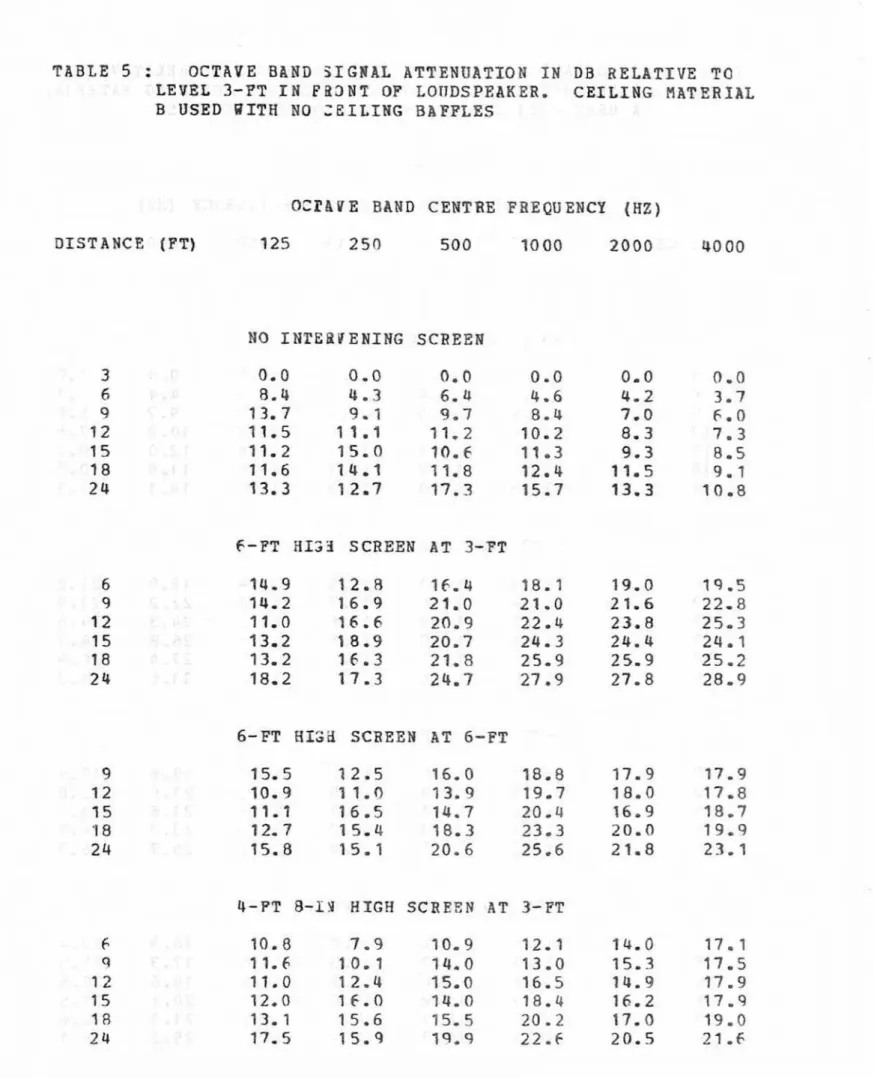
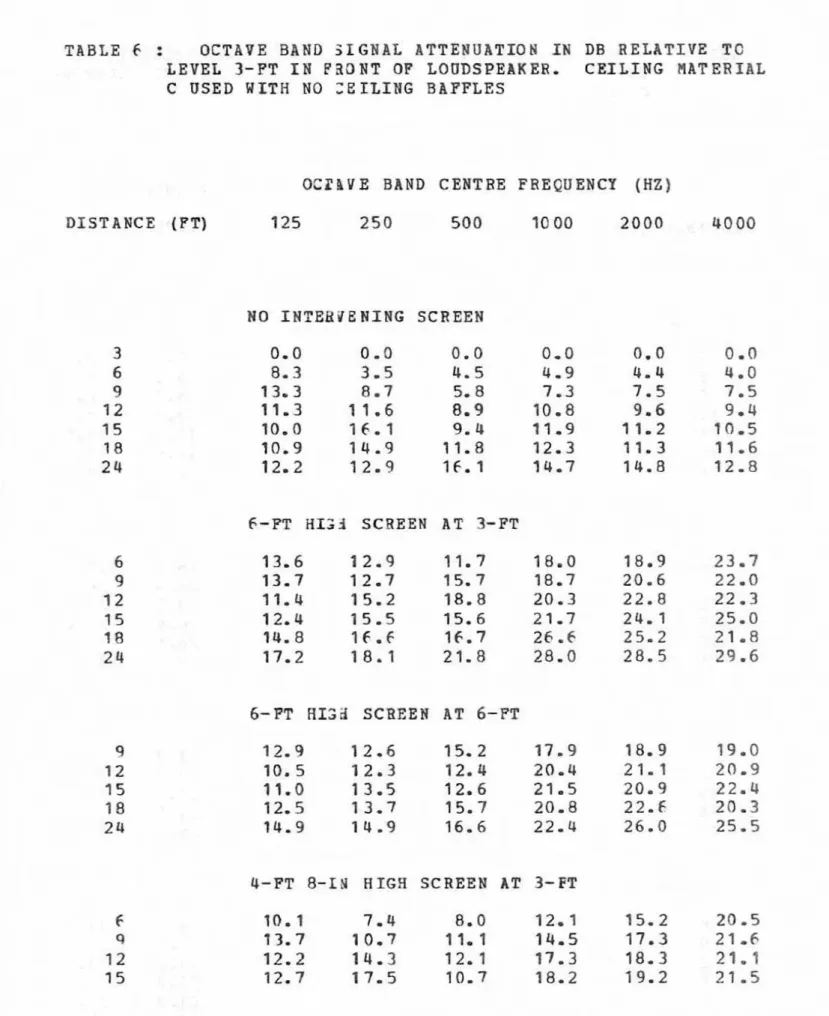
By contrast it was observed that the addition of baffles to ceiling C made a negligible improvement.Figure 6 facilitates the comparison of ceiling materials, A
and
C.
It can be seen that the u s e of the more absorbent m a t e r i a l results in a lower signal at a given distance behind the screen. The differenceis generally about 3 dB(A).
Ebl Octave band analysis
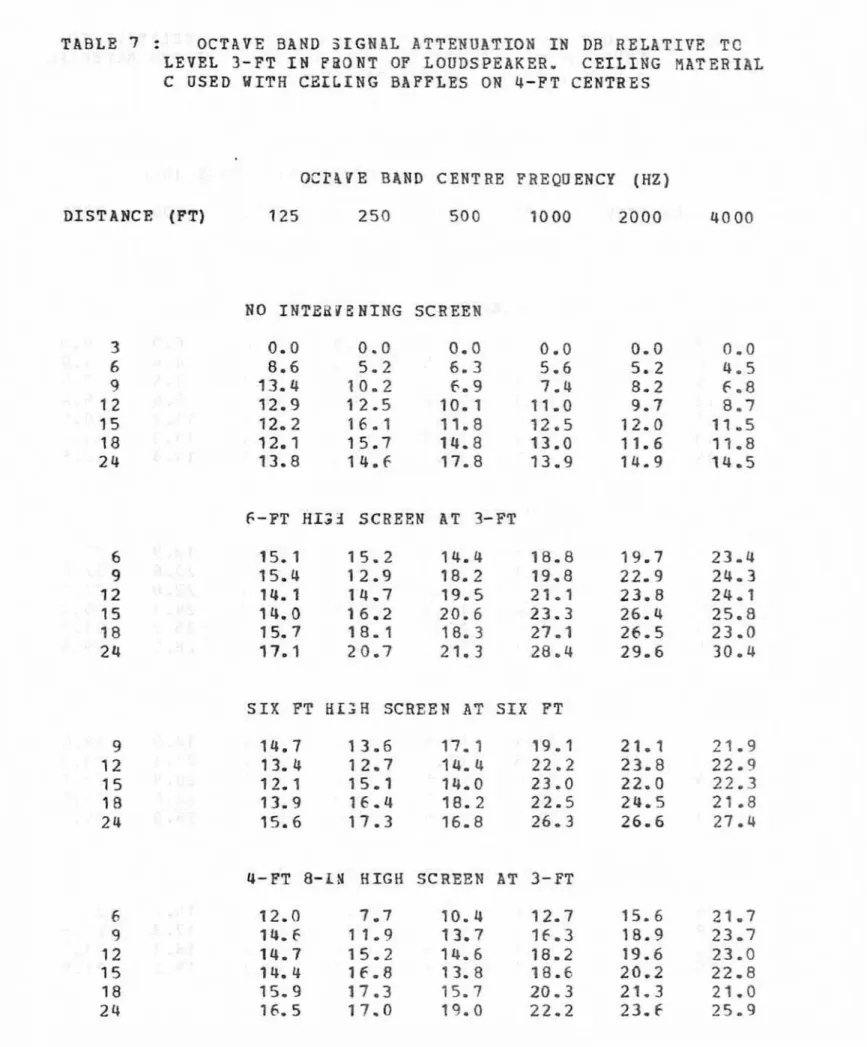
Tables 2 to 8 show the octave band analysis of the signals and
are included for completeness. The octave band analysis of the propaga-
tion m e a s u r e m e n t s leads to essentially the s m e conclusions as the
d B ( A ] results. F i g u r e 7 is included to illustrate what is obtaixled f o r materials A and
C.
In the next section it is shown that ananalysis of these octave band results, in terms; of the articulation index,
Beads to a single figure rating for a given screen-ceiling combination.
Articulation Index
In the open-plan office the acoustician is generally concerned
with those factors which have an e f f e c t on speech privacy, It is convenient, therefore, to express the results in t e r m s of a quantity that measures the
i n t e l l i g i b i l i t y of speech. The most common unit i s the articulation index
(AI).
The articulation index is calculated by e s t b a t i n g speech s i g n a l - t o -noise
the ratios by weighting factors and summing the products [ l ) , The
number resulting from this i s the
A1
and lies between 0 and I . The dependence of sentence intelligibility onA1
i s shown in Figure 8 whereit i s c l e a r that intelligibility increases rapidly
as
A1 increases fromz e r o to 0.40. For acceptable privacy, free f r m distraction, the A1 in a n open office should be l e s s than 0.15. F o r AICO. 3 a decrease in A1 of 0 - 0 5 is very important and produces a decrease i n sentence
intelligibility of about 1570.
The
data tabulated i n T a b l e s 2 to 8 can be used to calculatethe changes in A1 which occur as a result of changes in the ceiling or
screen configuration. These calculations w e r e made for three distances
of interest, viz. 9, 1 2 and 15 f t , and the results a r e given in Tables
9-12. The results are expressed as the improvement over a reference
condition consisting of material A with no intervening screen or baffles. Considering the effects of ceiling baffles on the performance of material A , it can be seen that on 4-Et c e n t r e s the baffles produce an
insignificant decrease in AI. W h e n the baffles are 2 f t apart the decrease
in A1 is quite marked, consistently about 0.1.
A S
has already been pointed out, such changes are very isnportant.The use of baffles with material.
C
a l s o decreases the A1 i n a given situation. In this case the decrease is smaller and the differencesb e t w e e n the 4-ft o. c. and the 2-ft o. c . case are even l e s s and a r e same
-
what random in nature. The fact that material
C
is ahmost acousticallytransparent could account f o r the inconsistency of its behaviour; also, plenum reflections could introduce complications.
The effects of screen s i z e and position can be found b y reading v e r t i c a l l y down a column in Tables
9-LZ.
One finds, predictably, thata 6-ft screen provides more isolation than a 4-ft 8-in. screen and that
moving the s c r e e n closer to the source is also an improvement. The relative efficacy of the three ceiling materials can be
determined by concentrating on the results obtained without ceiling
b a f f l e s . W i t h one exception, material C performs best, The exception
is again a possible manifestation of the acoustical transparency of
material
C ,
C e i l i n g materials with N o i s e Reduction Coefficients ( N R G )approaching 1.0 a r e now readily available and should be an improvement
o v e r the b e s t s y s t e m dealt with here.
It
was not possible t o t e s t such amaterial during the t h e available for this study.
The Information found in the tables can be summarized as follows: the larger the screen, the Larger the insertion l o s s ; the more absorbent
the ceiling, the better a given screen will perform. The limit is reached
when there are no flanking reflections. In practice, one should use a
baffles can be used to improve a reflective ceiling but, when used, they need be spaced s o closely that they become economically unfeasable.
T h e y can also slightly improve a m o r e absorbent ceiling; again, however, benefits cannot be justified economically since highly
absorbing materials are easily available and are probably m o r e effective.
j i i ) Pulse M e a s u r e m e n t s
F i g u r e 9 illustrates the electrical signals produced by the r e c e i v i n g microphone shown i n F i g u r e 2. The figure caption identifies
the e x p e r b e n t a l conditions, It i s clear that there a r e several sources
of reflection which complicate the trace,
From a knowledge of the path l e n g t h s in F i g u r e 2 the time
d e l a y between two corresponding points on the diffracted pulse and the pulse reflected from the ceiling can be evaluated. G i v e n the value of the time delay, i t i s then p o s s i b l e t o delineate the expected
ceiling pulse. In a f e w c a s e s the stmilarity between the pulse shapes was close enough to allow identification of the ceiling pulse by d i r e c t
oh servation. T h i s permitted the verification of the calculated time
delays. With this knowledge in mind, it b e c m e s , in theory, a
s t r a i g h t f o r w a r d task t o m e a s u r e the amplitude of the diffracted signal
and the ceiling reflection signal. Unfortunately, i n m a n y c a s e s , the ceiling reflection signal was extremely distorted a s a result of i n t e r
-
ference e f f e c t s . This resuLted in a large spread of values obtainedf o r the ceiling reflectionmeasurements. The values o b t a i n e d f a r the d i r e c t and diffracted pulse s behaved in a more predictable fashion
and the results obtained f o r these pulses are displayed in F i g u r e 10.
These results a r e the average of the values obtained under all
ceiling conditions. A s expected, the d i r e c t pulse decreased 6 dB f o r
each doubling of distance from the source, The small screen has an
i n s e r t i o n l o s s about 1 0 d B less than that of the l a r g e s c r e e n . Theory,
discussed l a t e r , predicts a larger value but this discrepancy is probably due to the relatively l a r g e s i z e af the source.
T h e results for the reflected ceiling pulses a r e shown in
F i g u r e 11. The scatter in these measurements was v e r y large and i s
n o t shown here. Upon exarmination same inconsistencies w e r e v e r y quickly discovered, Figure 1 l ( a ) s e e m s t o show, in contradiction t o F i g u r e s l l h - d , that baffles on 4-ft centres are about as effective as
those an 2 - f t centres. Comparison of the levels of the pulse diffracted
around the small screen with the levels of the ceiling bounces leads
t o t h e conclusion that the ceiling material and baffle configuration are
not important. T h i s i s c o n t r a r y to the continuous sound r e s u l t s and t o theoretical considerations. Because sf these and o t h e r discrepancies
ink r e sting, a r e not reliable for quantitative information,
UI
THEORETICAL CONSLDERATIONSSound, at the i m p o r t a n t speech frequencies, reaches the other side of a screen in various ways:
i) by direct transmission through the screen, ii) by diffraction a r o u n d the screen,
iii) by reflection from the ceiling,
iv) by reflection from vertical flanking surfaces.
Considering first the d i r e c t transmission, it i s shown i n
standard texts ( 2 ) that the transmission loss far sound waves normally
incident on a solid wall is
T L (dB)
=
- 2 8 . 6 -C 20 log Mf w h e r e M = rnass/unit area in lb/ft2f
=
frequency in Hz,The reduction of a
signal
caused by diffraction around a semi-infinitescreen is given by ( 3 ) ( 4 ) ,
IIL /dB)
-
20 log N r - , 0 2The distances A , B , and d are shown i n Figure 2. The distance d is the
difference between the path taken by the diffracted wave and that taken
by the direct wave.
In Figure 12 the i n s e r t i o n l o s s due to diffraction for two semi- infinite s c r e e n s is compared with the attenuation of signals propagating through the screen.
It
i s quite clear from this figure that the loss dueto transmission through the screen i s easily made negligible f o r typical screen heights by using an acoustically opaque material with a surface d e n s i t y of 1/4 ib/ft2 or greater as a membrane t o separate the layers
of absorbing material,
Because the diffraction loss is g r e a t e r f o r higher screens that a x e occasionally used, the mass per unit area of the separating membrane
m u s t be i n c r e a s e d .
If
one adopts as a c r i t e r i o n the requirement that the. transmission loss should be about6
d B
greater than the diffraction 10s s at 1 0 0 0 Hz, then the surface density of the screen membrane shouldsatisfy
W i t h t h i s condition met the screen will perform close to the limit
A theoretical consideration of specular reflection from a flat,
absorbing ceiling is straightforward. Referring again to F i g u r e 2, the
reflected signal arriving at the microphone i s smaller because of
absorption and because of the longer path length travelled; in fact, the attenuation relative t o the direct signal is
20 log Z G / ~
-
1 0 logpwhere p i s the reflection coefficient of the ceiling at the particular £re
-
quency and angle of incidence considered,
En o r d e r to demonstrate the effects af ceiling absarptioiz on
screen performance, Figure 1 3 has been constructed, This figure
shows the variation of articulation index as a function of ceiling re-
flectivity calculated at the l i s t e n e r ' s position when a screen is inter-
posed halfway between listener and talker. F o r the purpose of t h i s figure a background noise of 48 dB(A) has been assumed. Table 1 3
shows the voice levels, noise levels and diffraction Ioase s used i n
the calculation of the articulation index, The talker -1i stene r separa
-
t i o n assumed was 12 E t and the ceiling height was taken as
9
ft. The absorption coefficient was assumed t o be equal En all bands.Specular reflection from vertical surface s can a l s o create problems. Vertical s u r f a c e s are usually treated w i t h an absorbing
Sayer. A short study of the effectiveness of different treatments is
described in another Note ( 5 ) .
IV
CONCLUSIONSThe following conclusions can be d r a w n f r o m this study:
1 . Assuming a screen constructed in accordance with the r e c o m -
mendation made in the previous section, the larger a screen, the greater i t s insertion loss.
2. The ceiling system in an open office should have a reflection
coefficient low enough t o permit the screens to perform close to their
rnax'lmurn, diff raction-limited capahilitie s
.
The simple st way ofachieving this condition for a flat ceiling i s to use highly absorbent
ceiling boards. Ceiling baffles are not recommended except possibly
as a way of improving the performance of a poor ceiling.
V
F U T U R E
W O WThe t h e o r e t i c a l discussion of screen performance under an absor -
bent ceiling emphasizes the need for further work in the field. At this
writing, flat and caffe red ceiling systems are tested in reverberation
chambers where the absorption coefficient averaged over -all angles is measured. It would be m a r e appropriate to have a t e s t procedure
where the reflection coefficient is measured as a function of frequency and angle.
If
such a t e s t were available it would also be possible to deal with those ceiling systems which are composed entirely ofab sorbent baffles suspended f r a m exposed ductwork.
At present, screens are typically rated in terms of their surface absorptiorr {averaged at the N o i s e Reduction Coefficient).
It
might a l s o be relevant to introduce a simple t e s t to measure the insertionloss of screens to ensure that as well as being absorbent they a l s o
have a high enough transmission loss.
REFERENCES
1
.
American National Standard Methods f o r the Calculation of theArticulation Index. ANSI S3.5, 1969.
2. K i n s l e r , L.
E.
and A. R. Frey. Fundamentals of A c o u s t i c s .J.
W i l s y and Sons,1962.
pp 36-140.3 . Maekawa, 2. Noise Reduction by Screens. Applied Acoustics
1 (1968). p 157.
-
4. Noise andVibratianCsntro1. L.L, B e r m e k , Editor, M c G r a w -
Hi11,1971.
p175.
5. Warnock, A.
C.
C . Laboratory h v e stigationof
L o s s of Privacy due to Flanking Transmission by a Column. National Research Council of Canada, Division of Building Research, TechnicalQ) "3 C vl .d Lfl m Ln tn 1 . In m m . I . $ - ! : $ m m m c ' m c m m r - m .--I d A 4 p l d d & + . - I
TABLE 2 : O C T A V E BAND S L G R A L
ATTENUATION
IN
D B RELATIVETC
LEVEL
3-FT IN F 8 3 N T 'OF
LOUDSPEAKER, C E I L I N G llATERIALA USED WITH 3 0 : E I L f N G BAFFLES
O C r a V E B A N D CENTRE FREQUENCY
(HZ)
DISTAffCE
('FT)
325250
5 0 0 1000 2000 40 00N O
INTXBY
Z NIWG SCREEN6 - F T HIS3 SCREEN
AT
3-FT6-FT A l S d SCREEN AT 6 - F T
TABLE 3 : O C T A V E B A N 3
S I G N A L
ATTEWUATIOM I N Dl3 R E L A T I V ETC
LEVEL 3-FTIN
P R D M TOF
LOUDSPEAKER. C E I L I N G AATERLAL AUSED RTTM
CEELIWG BAFFLES ON 4-FT C E N T R E SocrrvE
B A N D CENTRE F R E G U E N C Y(HZ)
D I S T A N C E (FT) 1 2 5 2 5 0 500 10 00 2 0 0 0 40
00
NO I N T E R V E N I N G S C R E E N
6-PT
RIG3
SCREEN AT 3-FTTABLE
4 : O C T R V EB A N D
SIGNAL ATTENUATIOHIN DB
RELATIVET C
LEVEL 3-FT IN P 2 3 N T OF LOUDSPEAKER. C E I L I N G HATERIAL
A USED WITH C E I L I N G BAFFLES O N
2FT
CENTRESO C T h V E BAND CENTRE FRECDENCY {HZ)
DISTANCE {FT) 125
250
5 0 0 1000 2000 40 06HO I N T E B J B N ING SCREEN
6-FT H I S 3 S C R E E N AT 3-FT
6-FT
HISii SCREEN AT 6-FTTABLE
5 : OCTAVE B A H D S I G N A L ATTENUATTDNIN D B
R E L A T I V ETQ
LEVEL 3-PT IN F R 5 N T OF LOUDSPEAKER. C E I L I N G flATERZAL
B USED WITH N O Z E I L I N G BAFFLES
O E r h Y E
B A N D
CENTREFREQUENCY
(NZ)
D I S T A N C E
(FT)
12525fl
5 6 0 1 0 0 0 21300 40 00NO
I N T E R V E N I B G SCREEN6-PT H I S 3 SCREEN
AT
3-FTTABLE 6 : OCTAVE
B A N D
S I G N A L ATTENUATION IN DB RELATIVETG
LEVEE 3-FT IN F 3 O N T OF LOUDSPEAKER, C E I L I N G YATERIAL
C USED
WITH
NO : E E t I N GBAFFLES
O C E n V E
B A N D
CENTRE FREQUENCY(HZ)
DISTANCE(FT)
125 2 5 0 5 0 0 10 00 20004000
H O INTEBPENING S C R E E N 6-FT HI23 SCREEN AT 3-FT6-PT
HLZdSCREEN
AT 6-FT 4-PT 8 - I H H I G H SCREENAT
3-FTTABLE 7 : OCTAVE BANI) 3 f G N A L ATTENIIATIOW
IN
318RELATIVE
T CLEVEL 3 - F T
IN
F B O B T OF LOUDSPEAKER,CEILING
RATERIALC U S E D
WITH
C E L L F N G BAFPXES OR 4-FT CENTRESioCP4VE BaND CENTRE FREQUENCY [HZ]
DISTANCE (FTF 1 2 5 250 5 0 0 1a00 2000 40 00
BO
IWTEBIE AING
SCREEN6-PT HI33 SCREEN AT 3-PT
SIX
FT
81 3 8 SCREENAT
S I X PTTABLE 8 : O C T A V E B A N D S I G N A L A T T E N U A T I O N IN D B RELBTIVE T C LEVEL 3-FT IN F R D M T OF L O U D S P E A K E R . C E I L I N G MATERIAL
C
USEDWITH
C E Z L f N G BAFFLESON
2FT CENTRESO C r I L V E BAWD CENTRE FREQUENCY [ H Z )
DISTANCE (FT) 125 250 5 0 0 10 00 2000 40 00
N O I N T E B J E N I N G SCREEN
F - F T HIZ3 SCREEN AT 3-FT
6-PT HXSil SCREEN AT 6-FT
T A B L E 9
CALCULATED RELATIVE DECREASE I N ARTICULATION INDEX
( W I T H R E S P E C T
T O
CONDITIONS UNDER MATERLAL A W I T H NO I N T E R V E N I N G SCREEN A N D NO CEILING BAFFLES) F O RA DISTANCE
OF
9FT
FROMTHE
LOUDSPEAKERMaterial A NRC 0 . 5 5 2'0.
c .
Reference N o S c r e e n 0-
. 0 4 . 0 1 4-ft 8-in. S c r e e n at3
f t . 2 0 a 19 . 2 8 6-ft Screen at 6 f t .30 31 .36 6-ft s c r e e n at 3 f t . 2 9 3 2 . 4 3 M a t e r i a l B NRC=
0.65 N o B a f f l e s 0.0,24
, 33.46
MaterialG
NRC=
0.85No
B afflc s-
-
-
-
--
.
Q 1 . 2 9 -_ . _ p p p . . 3 4 . 3 9 4'0. c . 0 1 . 3 6 - 4 1.46
2Io. c..
o r
. 3 0 . 4 346
T A B L E 10
CALCULATED RELATIVE DECREASE I N ARTICULATION INDEX
(WITH R E S P E C T T O CONDITIONS UNDER MATERIAL A WITH
NO I N T E R V E N N C SCREEN AND N O CEILING B A F F L E S ) F O R
A
DISTANCEOF
1 2F T
F R O M
THE LOUDSPEAKER..
Material A M a t e r i a l
B
M a t e r i a lC
NRC = 0 - 5 5 NRC
=
0 . 6 5 NRC=
0,85r
No
NoNo
C onditions B a f f l e s 4'0. c . 210. c . Baffles Baffle s 410. c, 2'0, c .
TABLE 1 1
C A L C U L A T E D RELATIVE DECREASE I N ARTICULATION I N D E X ( W I T H
RESPEGT TO CONDITIONS UNDER
MATERIAL A WITH N O I N T E R V E N I N GS C R E E N AND NO CEILING BAFFLES) F O R A DISTANCE: O F 15 F T
TABLE 1 3
SOUND
LEVELSIN
dB USED I N T H E CALCULATIONO F ARTICULATION INDEX BEHIND A SCREEN
/ / / / / / / / / / / / / J / J / / J / / / J / J / / / / / / / / / J / / / / / / / / '
A
I T R U E C E I L I N GA
S U S P E N D E D C E I L I N G F I G U R E 1 M E T H O D U S E D FOR C O N T l N U O U S P I N KN O I S E
P R O P A G A T I O N M E A S U R E M E N T S . S C R E E N S W E R E I N S E R T E D A T D I S T A N C E S O F 3 F t O R 6 F T E . 4 5 0 5 B-
II S U S P E N D E D C E I L I N G / / \ \ COLUMN L O U D S P E A K E R
,'
A,f
+
P O W E R AMP ,I
T O
O S C I L L O S G A T E D S I N E W A V E \ M E A S U R I N G O S C I L L A T O R MI CROPHONE M I C R O P H O N Er
TO O S C I L L O S C O P E F I G U R E 2 C O P E A P P A R A T U S U S E DTO
M E A S U R E P R O P A G A T I O N O F S O U N D P U L S E S A N D T H E P A T H S I M P O R T A N T I N D E T E R M I N I N G THE S C R E E N P E R F O R M A N C EI
4 F T 8 l N . S C R E E N A T 3 F T O N 0 B A F F L E S a 4 F E E T O . C . A 2 O . C . ~ ~ ~ ~M A T E R E A L
A
1
. 5
3
6
1 2
24
D l
S T A N C E FROM L O U D S P E A K E R , FEET
4 F T 8 I N . S C R E E N A T 3 F T " N O B A F F L E S n 4 F T 0 - C .D l
S T A N C E F R O M
L O U D S P E A K E R ,
FEET
F I G U R E
3
C O N T I N U O U S P I N K
N O !
S E
P R O P A G A T I O N ,
d B
( A )
A N A L Y S I S
I
NO S C R E E N
6 F T S C R E E N A T 6 F T a N O B A F F L E S U 4 F T 0 . C . Q: A 2 F T O . C .I
M A T E R I A L
A
D l
S T A N C E FROM
L O U
D S P E A K E R .
FEET
6 F T S C R E E N A T 6 F T o N O B A F F L E S3
6
1 2
24
4 8
D l S T A N C E
FROM
L O U D S P E A K E R ,
FEET
F I G U R E
4
C O N T I N U O U S P I N K
N O !
S E
P R O P A G A T I O N ,
d B
( A )
A N A L Y S I S
M A T E R I A L
A
t
3
1 2
24
-
4 8
- d0
a
B I D-
& Q J a8
- d 6 F T 5 C R E E N A T 3 F T Q N O B A F F L E S-
U 4 F T O . C .-
A 2 F T O . C .D l
S T A N C E
F R O M
L O U D S P E A K E R , FEET
I 6 F T S C R E E N A T 3 F T O N 0 B A F F L E S n 4 F T 0 . C - A 2 F T 0 . c :M A T E R I A L
C
D l
S T A N C E
F R O M
L O U D S P E A K E R ,
FEET
F I G U R E 5
C O N T I N U O U S
P I N K
N O I S E P R O P A G A T I O N ,
dB
( A )
A N A L Y S I S
4 F T 8 l N . S C R E E N A T 3 F T - O M A T E R I A L A " M A T E R I A L C, ld0 B A F F L E S
D l
S T A N C E FROM
L O U D S P E A K E R ,
F E E T
IN O
S C R E E N
D l S T A N C E FROM
L O U D S P E A K E R , FEET
LY*
2 3 0 -
F I G U R E 6
6 F T S C R E E N A T 3 F T O M A T E R I A L A-
D M A T E R I A L C , NO B A F F L E SC O N T I N U O U S
P I N K N O 1
SE
P R O P A G A T I O N .
d B
( A 1
A N A L Y S I S
40
-
I
I
I
3
6
1 2
24
48
w l M A T E R I A L A
i
W 1 0 1'
g
1 d, 0 A W ~ F S C R E E N T A T 3 F T o N O B A F F L E S M U 4 F T 0 . C . v A 2 F T O . C .-
2:o
40 I B 4 F T 8 1 N . S C R E E N A T 3FT o N O B A F F L E S n 4 F T O . C . A 2 F T O . C . M A T E R I A LC
6 F T S C R E E N A T 3 F T 0 NO B A F F L E S 0 4 F T O . C . A 2 F T O . C .I
1I
M A T E R I A LC
- - g -#
- LI 4 F T 81N. SCREEN A T 3 F T & O N 0 B A F F L E S - - a 4 F T O . C . * ~ F T O . C .I
I 1 I 1 O C T A V E B A N D C E N T R E F R E Q U E N C Y F I G U R E7
O C T A V E B A N D A T T E N U A T I O N M E A S U R E D A T 1 2 FEET FROM L O U D S P E A K E RA R T I C U L A T I O N I N D E X
F I G U R E
8
R E L A T I O N B E T W E E N
A R T I C U L A T I O N
I N D E X
A N D
S E N T E N C E
E N T E L L I G
I & I I I T Y
-
4
I!-
( 0 1
T Y P I C A L R E F E R E N C E S I G N A L AT 6 I N a l O . S v / d i u N O B A F F L E S , 0.01 v / d i v N O B A F F L E S , 0.01 v l d i v I ( d ) M A T E R I A L C,
B A F F L E S 2 F T O.C., 0.01 v f d i v I 1I
I
1 I I S I G N A L S R E C E I V E D AT 12 F TFOR
( b ),
(c), I d )F I G U R E
9
E L E C T R I C A L S I G N A L S F R O M
M I C R O P H O N E S , 5 m s / c m
E R 5 6 5 8 - 90 6 F T S C R E E N A T 3 FT a4 F T 81N. SCREEN AT 3FT A A 6 F T S C R E E N A T 6 FJ
D l S T A N C E F R O M L O U D S P E A K E R , F E E T
- o 6 FT SCREEN AT 3 FT Q 4 f T 81N. SCREEN AT 3 F T AbFT SCREEN AT 6 F TD l S T A N C E
FROM
L O U D S P E A K E R . FEET
F I G U R E
10
D l
R E C T
P U L S E
MEASUREMENTS
I N O F F I C E
0 N O B A F F L E S a 2 FT O . C .
I
1
I
M A T E R I A L A-
- - --
o N O B A F F L E S\P
- 0 2 FT O . C . D * ~ F T O . C .I
1
0 N O B A F F L E S 2 F T O . C . 4 FT O . C .1
M A T E R I A LC
2000 H z-
- o N O B A F F L E S 0 2 F T O . C . 4 F T 0 . C .I
6 1 2 24 6 1 2 24 D l S T A N C E F R O M L O U D S P E A K E R , FEET F I G U R E 11B O U N C E
S I G N A L S
FROM C E I L I N G S W I T H AND W I T H O E I T B A F F L E S . THE C O N T I N U O U S L I N E I S F R E E - S P R E A D I N G L E V E LF I G U R E
1 2
C O M P A R I S O N
O F T H E O R E T I C A L D I R E C T
A N D
D I F F R A C T E D
S I G N A L S
F O R
S C R E E N S . S O U R C E
R E C E I V E R S E P A R A T I O N
0
0 . 1
0.2
0.
3
0.
4
A R T I C U L A T I O N I N D E X
F I G U R E
1 3
A R T I C U L A T I O N
I N D E X
B E H I N D S C R E E N S
A S F U N C T I O N
OF
C E I L I N G R E F L E C T I O N
C O E F F I C
l
ENT
Sound absorption t e s t s conducted an lay-in type ceiling panels from the Kenson Building Landscaped Office in Ottawa, Sample tested on
Mounting N u m b e r 7 .
Sarnple A: M i n e r a l fibre painted and perf orated on one face (installed in
ceiling), Panel size
-
23 3 / 4 in. wide by 47 3/4 in. long by9/16
in.thick. Panel W e i g h t
-
9.5 lb. Approximate number of perforations persq 5t
-
11,
400.Size
and n u m b e r of perforations-
600
-
1/16 in. d i m . by 318 in. deep800
-
1/32 in. d i m . by 3 / 8 in. deepSample B: Mineral f i b r e panel painted and perforated on one face (new
sample). Panel s i z e
-
2 3 3/4 in. wide by 47 3 / 4 in. long by 518 in.thick. Panel weight
-
7.5 lb. Approximate number of perforationsper s q f t
-
1,400. Size and number a£ perforations-
600
-
1 / 1 6 in. d i m . by 1/2 in. deep 800-
1/32 in. d i m . by 1/2 in. deepSample Cz Glass fibre panel with 0.0 10 in, thick painted porous face.
Panel Size
-
2 3 3/4 in. w i d e by 47 3/4 in. long by 11/16 in. thick.Panel Weight
-
5 . 2 Ib.Sound Absorption Coefficients
N o i s e Reduction Coefficient 0 , 5 5 0.65 - . 0.85 Sample A B C Fresuencv in H z 1 2 5 250 500 1000 2000 4000 0.29 .28 ,52 .70 -67 .44 0 . 2 9 . 3 8 . 6 3 - 7 9 .71 .46 0.45 -