c-Myc regulates transcriptional pause release
The MIT Faculty has made this article openly available.
Please share
how this access benefits you. Your story matters.
Citation
Rahl, Peter B. et al. “c-Myc Regulates Transcriptional Pause
Release.” Cell 141.3 (2010): 432–445.
As Published
http://dx.doi.org/10.1016/j.cell.2010.03.030
Publisher
Elsevier
Version
Author's final manuscript
Citable link
http://hdl.handle.net/1721.1/72558
Terms of Use
Creative Commons Attribution-Noncommercial-Share Alike 3.0
c-Myc regulates transcriptional pause release
Peter B. Rahl1, Charles Y. Lin1,2, Amy C. Seila3,4, Ryan A. Flynn3, Scott McCuine1, Christopher B. Burge2, Phillip A. Sharp2,3, and Richard A. Young1,2,*
1 Whitehead Institute for Biomedical Research, Cambridge, MA 02142
2 Department of Biology, Massachusetts Institute of Technology, Cambridge, MA 02142 3 Koch Institute, Massachusetts Institute of Technology, Cambridge, MA 02142
Abstract
Recruitment of the RNA Polymerase II (Pol II) transcription initiation apparatus to promoters by specific DNA binding transcription factors is well recognized as a key regulatory step in gene expression. We report here that promoter-proximal pausing is a general feature of transcription by Pol II in mammalian cells, and thus an additional step where regulation of gene expression occurs. This suggests that some transcription factors recruit the transcription apparatus to promoters, while others effect promoter-proximal pause release. Indeed, we find that the transcription factor c-Myc, a key regulator of cellular proliferation, plays a major role in Pol II pause release rather than Pol II recruitment at its target genes. We discuss the implications of these results for the role of c-Myc amplification in human cancer.
Introduction
Regulation of transcription is fundamental to the control of cellular gene expression programs. Recruitment of the RNA polymerase II (Pol II) transcription initiation apparatus to promoters by specific DNA binding transcription factors is generally recognized as a key regulatory step in selective transcription at most eukaryotic genes (Hochheimer and Tjian, 2003; Ptashne and Gann, 1997; Roeder, 2005). Additional regulatory steps can occur subsequent to recruitment of the transcription apparatus, and these are known to play important roles in controlling the expression of a subset of genes (Core and Lis, 2008; Margaritis and Holstege, 2008; Peterlin and Price, 2006).
Promoter-proximal pausing of Pol II is a post-initiation regulatory event that has been well-studied at a small number of genes. Promoter-proximal pausing, for the purpose of discussion here, will be used to describe events including attenuation, stalling, poising, abortive elongation and promoter-proximal termination. The Drosophila Hsp70 gene is regulated through both recruitment of the initiation apparatus and promoter-proximal pausing prior to the transition to elongation (Gilmour and Lis, 1986; O'Brien and Lis, 1991; Rougvie and Lis, 1988). Paused Pol II molecules can also be detected in some human genes (Bentley and Groudine, 1986; Espinosa et al., 2003; Sawado et al., 2003). At genes regulated through promoter-proximal
* Correspondence: [email protected].
4Present Address: Alnylam Pharmaceuticals, 300 Third Street, Cambridge, MA 02142
Refer to the Supplemental Information for additional experimental procedures, supplemental figures, tables and results.
Publisher's Disclaimer: This is a PDF file of an unedited manuscript that has been accepted for publication. As a service to our customers we are providing this early version of the manuscript. The manuscript will undergo copyediting, typesetting, and review of the resulting
NIH Public Access
Author Manuscript
Cell. Author manuscript; available in PMC 2011 April 30.
Published in final edited form as:
Cell. 2010 April 30; 141(3): 432–445. doi:10.1016/j.cell.2010.03.030.
NIH-PA Author Manuscript
NIH-PA Author Manuscript
pausing, the pause factors DRB-sensitivity inducing factor (DSIF) and negative elongation factor (NELF) generate a Pol II pause just downstream of the transcription start site (TSS) (Wada et al., 1998a; Yamaguchi et al., 1999). Certain sequence-specific transcription factors may recruit pause release factors such as the positive transcription elongation factor b (P-TEFb) to these genes (Barboric et al., 2001; Core and Lis, 2008; Eberhardy and Farnham, 2001, 2002; Kanazawa et al., 2003; Peterlin and Price, 2006).
Recent reports suggest that post-initiation regulation is important for transcriptional control at a subset of metazoan protein-coding genes. In human embryonic stem cells, for example, approximately 30% of genes experience transcription initiation but show no evidence of further elongation (Guenther et al., 2007). These results indicate that a regulatory step subsequent to recruitment of the initiation apparatus is key for transcriptional control at these genes. While the genes that experience transcription initiation but not elongation are a minority, the recent discovery that Pol II can initiate transcription in both the sense and antisense direction (Core et al., 2008; Seila et al., 2008), suggests that a post-initiation regulatory step may be required more generally at promoters, if only to prevent unregulated antisense transcription.
We report here evidence that promoter-proximal pausing does occur generally in ES cells, at genes that are fully transcribed as well as at genes that experience initiation but not elongation. At genes with detectable levels of Pol II, ChIP-Seq data revealed that most of the enzyme typically occupies DNA in the promoter proximal region together with the pause factors DSIF and NELF. Inhibition of the pause release factor P-TEFb caused Pol II to remain at these sites genome-wide. Because c-Myc plays key roles in ES cell self-renewal and proliferation (Cartwright et al., 2005) and can bind the pause release factor P-TEFb in tumor cells (Eberhardy and Farnham, 2001, 2002; Gargano et al., 2007; Kanazawa et al., 2003), we investigated whether c-Myc functions to regulate pause release in ES cells. Our results indicate c-Myc plays a key role in pause release rather than Pol II recruitment at a substantial fraction of actively transcribed genes in ES cells.
Results
Pol II tends to occupy promoter regions
We used chromatin immunoprecipitation coupled to high-throughput sequencing (ChIP-seq) to determine how Pol II occupies the ES cell genome (Figure 1, Table S1, S2). An antibody that binds to the N-terminus of the largest subunit of Pol II (N-20) was used, allowing us to monitor Pol II independent of the phosphorylation status of its C-terminal domain (CTD). We found that the bulk of Pol II occupied the promoter proximal region of the vast majority of genes (Figure 1A). This tendency to occupy promoter proximal regions was evident both for genes that are actively transcribed (with H3K4me3- and H3K79me2-modified nucleosomes) and for non-productive genes that show evidence of initiation but not elongation (with H3K4me3-, but not H3K79me2-modified nucleosomes). At actively transcribed genes, low levels of Pol II signal were observed throughout the transcribed region up to the
polyadenylation site, with higher signals observed downstream where transcription termination takes place. These data are consistent with more lengthy occupancy of promoter and terminator regions than the central body of actively transcribed genes.
The presence of high polymerase density at the promoter region relative to the gene body has previously been cited as evidence for promoter-proximal pausing or some form of post-initiation regulation in E.coli, Drosophila and human cells (Fuda et al., 2009; Price, 2008; Wade and Struhl, 2008). The pattern of Pol II binding we observed suggests that promoter-proximal pausing occurs frequently in mES cells. To further characterize Pol II occupancy in mES cells, we calculated the relative ratio of Pol II density in the promoter-proximal region and the gene body (Figure 1B), which has been termed the traveling ratio (TR) (Reppas et al.,
NIH-PA Author Manuscript
NIH-PA Author Manuscript
2006) or the pausing index (Zeitlinger et al., 2007). At genes where the rate of promoter-proximal clearance is similar to the rate of initiation, the TR is close to 1 (Reppas et al., 2006). However, at genes where promoter-proximal clearance is lower than the initiation rate, the TR is greater than 1. Using this metric, we found that 91% of genes have a Pol II TR of more than 2, confirming that higher Pol II density is detected in the promoter-proximal region than in the gene body at the vast majority of genes (Figure 1C, S1, Table S3). The presence of high polymerase density in the promoter regions of most active ES cell genes suggests that these genes experience some form of post-initiation regulation.
The large subunit of Pol II contains a C-terminal domain (CTD) that is modified at various stages of transcription; Pol II is recruited into the preinitiation complex with a
hypophosphorylated CTD, the CTD is phosphorylated on Serine 5 (Ser5P) during initiation and then on Serine 2 (Ser2P) during elongation (Fuda et al., 2009). To determine how these two phosphorylated forms of Pol II occupy ES cell genes, ChIP-Seq experiments were conducted with antibodies against these two phosphorylated forms of the CTD (Figure 1A). Ser5P Pol II was detected in the promoter region and the transcribed region of active genes, with the peak located in the promoter proximal region. For genes that experience initiation but not elongation (non-productive), Ser5P Pol II was detected only within the promoter region, as expected. Ser2P Pol II was detected predominantly downstream of the promoter region, with the peak in the region downstream of the polyadenylation site where termination likely takes place. These results are consistent with the idea that Pol II typically experiences a promoter proximal, rate-limiting step after being recruited to promoters and after becoming Ser5 phosphorylated. Pol II may also experience a slow release from DNA in regions of transcription termination (Core et al., 2008; Glover-Cutter et al., 2008).
P-TEFb inhibition prevents pause release at most active genes
The pattern of Pol II occupancy of genes suggests that a post-initiation regulatory step, such as pause release, may be important for transcriptional control of most genes. The Drosophila Hsp70 gene is regulated subsequent to initiation by P-TEFb-dependent pause release (Lis et al., 2000). Active P-TEFb, a heterodimer consisting of the cyclin-dependent kinase Cdk9 and a cyclin component (CycT1, CycT2 or CycK), phosphorylates at least three targets important for transcriptional control: the Spt5 subunit of DSIF, the NelfE subunit of NELF, and Ser2 of the Pol II CTD (Kim and Sharp, 2001; Marshall et al., 1996; Marshall and Price, 1995; Wada et al., 1998b; Yamada et al., 2006). To assess the role of P-TEFb-dependent pause release in global transcriptional control, we repeated the ChIP-Seq experiment for total Pol II in mES cells treated with flavopiridol (FP), an inhibitor of Cdk9 kinase activity (Chao et al., 2000; Chao and Price, 2001). As expected, FP treatment caused reduced phosphorylation of Spt5 and Pol II Ser2 within 60 min, while Ser5 phosphorylation was not substantially affected (Figure 2A, S2A). If Pol II pause release is required at transcribed genes, we would expect that in the presence of FP, Pol II molecules would remain associated with promoter proximal pause sites but be depleted from DNA further downstream. This change in the pattern of Pol II occupancy was observed at most actively transcribed genes (Figure 2B, S2B). We analyzed TR to further evaluate changes in Pol II occupancy genome-wide. TR changes with FP treatment were generally observed at actively transcribed genes, where promoter proximal Pol II signals were relatively unaffected, but Pol II signals further downstream were depleted (Figures 2C). We found that 75% of genes had a change in Pol II TR of at least 1.5 upon drug treatment. TRs were generally unchanged at genes that normally experience initiation but not elongation (Figure 2D). These results suggest that P-TEFb-dependent pause release is required for Pol II transcription of most actively transcribed genes in mES cells.
NIH-PA Author Manuscript
NIH-PA Author Manuscript
Promoter proximal sites are co-occupied by Pol II, DSIF and NELF
P-TEFb antagonizes the negative elongation activity of the pause factors DSIF and NELF (Cheng and Price, 2007; Kim and Sharp, 2001; Wada et al., 1998b). DSIF (Spt4 and Spt5) and NELF (NelfA, NelfB, NelfC/D, and NelfE) are both associated with promoter-proximal Pol II at genes regulated through pausing (Wada et al., 1998a; Yamaguchi et al., 1999). Following the transition to elongation, NELF dissociates and a form of DSIF remains associated with the elongation complex (Andrulis et al., 2000; Wu et al., 2003). If P-TEFb-dependent pause release is generally required at genes transcribed by Pol II, DSIF and NELF should occupy the promoter proximal regions of these genes together with Pol II.
We used ChIP-Seq to determine the genome-wide occupancy of NelfA (NELF) and Spt5 (DSIF) in murine ES cells (Figure 3). The results revealed that NelfA and Spt5 occupy precisely the same promoter-proximal sites as Pol II throughout the genome (Figure 3A). The co-occupancy of Pol II, NelfA and Spt5 in promoter-proximal regions was evident at both actively transcribed genes and at genes that experience transcription initiation but not elongation (non-productive) (Figure 3A). Spt5 and NelfA occupancy positively correlates with Pol II occupancy (Figure S3). The largest NelfA and Spt5 peaks were detected in the promoter-proximal region, but only Spt5 was also enriched further downstream in actively transcribed genes (Figure 3A). The Spt5 enrichment at the 3′ end of actively transcribed genes was similar to that of Ser2P Pol II, suggesting it remains associated with Pol II until termination. The NelfA and Spt5 peaks overlapped with the promoter-proximal site of the Pol II peak, which is flanked by H3K4me3 modified nucleosomes (Figure 3B, 3C). These results demonstrate that the pause factors DSIF and NELF co-occupy the promoter proximal regions of genes together with Pol II, consistent with the model that P-TEFb-dependent pause release is generally required at genes transcribed by Pol II.
Factors such as the PAF1 complex are involved in post-initiation events that are independent of promoter-proximal pausing. PAF1 is involved in elongation, mRNA processing events and elongation-associated chromatin modifications (Saunders et al., 2006). To test if the Pol II promoter proximal peak is specific for factors involved in promoter proximal pausing, we conducted ChIP-Seq with the Ctr9 subunit of the PAF1 complex. Although a limited signal could be detected in the promoter-proximal region of some genes, Ctr9 occupancy did not generally overlap with the promoter proximal Pol II peak (Figure 3A). Ctr9 was typically found within coding regions of active genes, just downstream of promoter proximal Pol II, and extending to the 3′ end of transcribed genes. Ctr9 occupancy peaked at the 3′ end of actively transcribed genes, which is similar to the results obtained for Ser2P Pol II and Spt5, suggesting it remains associated with Pol II until termination. The Ctr9 ChIP-seq data indicates that the PAF1 complex generally associates with the transcribed portion of most active genes, which is consistent with its proposed roles in elongation, mRNA processing and chromatin modification (Adelman et al., 2006; Krogan et al., 2003; Pokholok et al., 2002; Zhu et al., 2005). These results support the view that the Pol II promoter proximal peaks represent regions of post-initiation regulation and not simply an artifact of the ChIP-Seq method.
DSIF and NELF function prior to P-TEFb at genes regulated by pause release (Fuda et al., 2009; Peterlin and Price, 2006). This predicts that DSIF and NELF should be present at promoter proximal sites with Pol II even without P-TEFb activity. We used ChIP-chip to determine if Spt5 and NelfA co-occupy promoter proximal sites with Pol II following FP treatment. We find that Spt5 and NelfA continue to co-occupy promoter proximal sites with Pol II following FP treatment (Figure S3B). Spt5 was depleted downstream of these promoter proximal sites following FP treatment, supporting the model that Spt5 localization in the gene body is dependent on Pol II (Ni et al., 2008; Ni et al., 2004). These results indicate that DSIF and NELF co-occupy promoter proximal sites with Pol II prior to P-TEFb function.
NIH-PA Author Manuscript
NIH-PA Author Manuscript
Bidirectional and unidirectional genes
It was recently reported that Pol II can initiate transcription in both the sense and antisense direction at many genes (Core et al., 2008; Seila et al., 2008). We separated genes into bidirectional and unidirectional classes based on evidence for sense and anti-sense transcription start site associated RNAs (TSSa-RNAs) in ES cells (Seila et al., 2008). To determine how DSIF and NELF occupy the promoter-proximal regions of these two classes of genes, we re-examined the ChIP-seq data for Pol II, Spt5, NelfA and H3K79me2 (a marker for elongation) at higher resolution (Figure 3D). Approximately 65% of active genes with TSSa-RNA reads fell into the bidirectional class, and at the promoters of these genes we found the two sites occupied by Pol II were both co-occupied by NelfA and Spt5. Approximately 35% of active genes with TSSa-RNA reads fell into the unidirectional class, and at the promoters of these genes we found the one site occupied by Pol II was co-occupied by NelfA and Spt5. These results demonstrate that DSIF and NELF generally co-occupy promoter proximal regions wherever Pol II is found, whether initiation is occurring in one direction or two, further supporting the model that P-TEFb-dependent pause release is a general feature of transcription initiation by Pol II.
Pause factor knockdown alters Pol II gene occupancy
The pause factors NELF and DSIF co-occupy promoters with Pol II at most genes that experience transcription initiation. Previous studies have shown that loss of NELF causes a decrease in Pol II density at promoters, and thus a decrease in Pol II traveling ratio (or pausing index), at a small number of Drosophila genes (Muse et al., 2007). To determine how loss of vertebrate NELF or DSIF might influence Pol II occupancy, we used shRNA-mediated knockdown of NelfA and Spt5 followed by Pol II ChIP-seq analysis in mES cells (Figure 4). The most significant change in Pol II density was found following Spt5 knockdown, where increases in Pol II density were frequently observed downstream of the promoter at actively transcribed genes (Figure 4B). At these active genes, depletion of a pausing factor appeared to result in increased transcription through the pause site but because there was little effect on promoter proximal Pol II, high rates of initiation maintained Pol II promoter levels. NelfA was found to continue to occupy the promoter proximal regions following Spt5 knockdown (Figures S4A, S4B). The effects of Spt5 knockdown on Pol II density were quantified using the TR metric (Figures 4C, S4E, S4F). There was a substantial shift in TR upon Spt5 knockdown, demonstrating that genes generally experience an increase in Pol II density in the transcribed region at active genes when the levels of DSIF are reduced. These results confirm that Spt5 function contributes to the control of promoter-proximal Pol II in mES cells.
NelfA knockdown had less impact on Pol II occupancy (Figures 4B, 4C), but a modest effect was observed at some genes and the pattern of change was similar to that observed for the Spt5 knockdown experiment at non-productive genes, as evidenced by the change in TR (Figures S4E, S4F, S4G). This result is similar to that observed previously in Drosophila embryos, where a fraction of genes showed a loss of Pol II density at the promoter (Muse et al., 2007). Spt5 occupancy was largely unaffected in the promoter proximal regions following NelfA knockdown (Figures S4C, S4D). In summary, we find that Spt5 knockdown, and to a more limited extent NelfA knockdown, can produce increased Pol II occupancy in transcribed regions relative to promoter proximal regions, consistent with the proposed roles of these factors in controlling promoter-proximal pausing.
c-Myc binds P-TEFb and contributes to pause release in ES cells
Certain DNA binding transcription factors may be responsible for recruiting P-TEFb to release paused polymerase at active genes if P-TEFb-dependent pause release is a general feature of transcription by Pol II. Such a role has been proposed for c-Myc based on evidence that this
NIH-PA Author Manuscript
NIH-PA Author Manuscript
transcription factor can bind P-TEFb and stimulate elongation at specific genes in tumor cells (Eberhardy and Farnham, 2001, 2002; Gargano et al., 2007; Kanazawa et al., 2003). Because c-Myc is a key ES cell transcription factor required for self-renewal and proliferation (Cartwright et al., 2005), which occupies a third of active genes (see below), we investigated whether c-Myc plays a role in P-TEFb-dependent pause release at the genes it occupies in ES cells.
If c-Myc contributes to P-TEFb-dependent pause release in ES cells, it might be expected to bind P-TEFb in these cells. To function as a transcription factor, c-Myc forms a heterodimer with Max (Eilers and Eisenman, 2008). We determined whether endogenous c-Myc/Max interacts with P-TEFb in ES cells using co-immunoprecipitation analysis. We found that immunoprecipitation of P-TEFb components Cdk9 and CycT1 co-immunoprecipitate Max and similarly, immunoprecipitation of c-Myc and Max co-immunoprecipitate Cdk9 and CycT1 (Figure 5A). Therefore, c-Myc/Max can bind P-TEFb in ES cells.
If a predominant function of c-Myc is to contribute to pause release in ES cells, then we expect that it should be associated almost exclusively with actively transcribed genes, unlike other key ES cell regulators like Oct4 and Nanog, which are associated with both active and repressed genes. We examined published ChIP-Seq data to determine the fraction of genes bound by c-Myc, Oct4 and Nanog that were actively transcribed (Chen et al., 2008; Marson et al., 2008), as indicated by the presence of nucleosomes containing histones H3K4me3 and H3K79me2 (Figure 5B). Just over half of Oct4 and Nanog occupied genes show evidence of transcription elongation (H3K79me2-modified nucleosomes). In contrast, almost all of the c-Myc occupied genes have H3K79me2 modified nucleosomes, indicating that the majority of c-Myc targets in mES cells experience transcription elongation. Furthermore, c-Myc target genes have lower TR values compared to non c-Myc targets (Figure 5C). We estimate that 33% of actively transcribed genes in ES cells are bound by c-Myc within 1kb of the transcriptional start site (Figure S5). The association of c-Myc with a substantial fraction of actively transcribed genes, coupled with evidence that it can bind P-TEFb, is consistent with the model that c-Myc contributes to P-TEFb-dependent pause release at a large portion of active genes in ES cells. To more directly test whether c-Myc regulates pause release, we used a low molecular weight inhibitor of c-Myc/Max, 10058-F4, which inhibits c-Myc/Max heterodimerization both in vitro and in vivo (Hammoudeh et al., 2009; Wang et al., 2007; Yin et al., 2003). Max co-occupies c-Myc binding sites as determined by ChIP, confirming that c-Myc and Max function together at target genes in ES cells (Figure S6A). Treatment of mES cells with 10058-F4 (50μM for 6 hours) caused a decrease in the expression of most c-Myc target genes tested, but did not affect the expression of two non-c-Myc target genes, indicating that c-Myc/Max function is inhibited by 10058-F4 under these conditions (Figure 6A). The magnitude of the decrease observed (∼20-40%) is consistent with the relatively short duration of inhibitor treatment relative to typical mRNA half-lives of ∼7 hours in mES cells (Sharova et al., 2009).
If a key function of c-Myc is to contribute to pause release at the active genes it occupies in ES cells, then loss of c-Myc would be expected to cause a reduction in the levels of Ser2-phosphorylated Pol II (the form associated with elongation), but should not affect the levels of Ser5-phosphorylated Pol II (the form associated with initiation). We found that treatment of ES cells with 10058-F4 did indeed cause a significant reduction in the levels of Pol II Ser2P, while Ser5P remained unaffected (Figure 6B). The 1/3 of genes that are regulated by c-Myc are among the most highly transcribed genes in the cell, which likely explains why the reduction in total Ser2P Pol II levels is greater than 33%.
NIH-PA Author Manuscript
NIH-PA Author Manuscript
If c-Myc regulates pause release, then inhibition should have an effect on Pol II levels in promoter and gene bodies similar to that of FP, but only at c-Myc occupied genes. We tested this idea by determining how 10058-F4 affects Pol II occupancy using ChIP-seq in mES cells. There was little effect on Pol II density at promoters but there was a clear reduction in transcribed regions (Figure 6C). This effect on Pol II density was also observed following c-Myc shRNA knockdown (Figure S6B, S6C, S6D). The magnitude of the effect with 10058-F4 was somewhat milder than with FP, probably because the inhibition of c-Myc/Max heterodimerization is not complete (Hammoudeh et al., 2009; Wang et al., 2007; Yin et al., 2003). Treatment with 10058-F4 did not alter the protein levels of P-TEFb components Cdk9 or CycT1, indicating that this effect is not a result of reduced levels of P-TEFb (Figure S6E). Importantly, genes that lack evidence of c-Myc binding showed patterns of Pol II occupancy that were unaffected by treatment with 10058-F4 (Figure 6C). We confirmed that genes that are not targets of c-Myc do require P-TEFb function to release paused Pol II by showing that FP treatment causes a block in pause release (Figure 6C), which suggests that transcription factors other than c-Myc are involved in recruiting P-TEFb to stimulate pause release at these genes.
We carried out a more global analysis of the effect of 10058-F4 on Pol II occupancy of genes bound by c-Myc and compared these patterns to genes that are not bound by this factor but show evidence of elongation (Figure 6D, S6G). The results show that high-confidence c-Myc target genes generally retained promoter-proximal Pol II but had reduced Pol II density in their transcribed regions, whereas Pol II occupancy does not change at genes that are not c-Myc targets (Figure 6D). Further analysis confirmed that there were statistically significant changes in the gene body (p=7.341e-06) but not the promoter region (p=0.4536) of c-Myc targets. Additionally, following 10058-F4 treatment a substantial increase in TR was observed at c-Myc target genes, but no such shift was observed at non-c-c-Myc targets (Figure 6E). A similar shift in TR at the c-Myc target genes was also detected following c-Myc shRNA knockdown, indicating genes become more paused (Figure S6F). The observation that reduced c-Myc activity had little effect on the levels of promoter-proximal Pol II but caused a reduction in the levels of Pol II across transcribed portions of c-Myc target genes is consistent with the model that c-Myc/Max generally plays a role in Pol II pause release at its target genes in mES cells. Loss of Oct4 and c-Myc have different effects on Pol II gene occupancy
Loss of another key ES cell transcription factor, Oct4, leads to reduced transcription of many Oct4-bound active genes in ES cells (Hall et al., 2009; Matoba et al., 2006). To determine how loss of Oct4 affects Pol II levels at the promoters and transcribed regions of its target genes, we utilized a doxycycline-inducible Oct4 shutdown mES cell line (Niwa et al., 2000) and monitored Pol II levels by ChIP-Seq before and after Oct4 shutdown (Figure 7). Oct4 protein levels were substantially reduced within 12 hrs and nearly eliminated at 24 hrs after exposure to doxycycline (Figure 7A). At Oct4-occupied genes that experience reduced transcription, Pol II occupancy was generally reduced in both the promoter proximal region and the gene body at 12 and 24 hrs (Figure 7B). These effects were not observed at most genes that are not occupied by Oct4 (Figure 7B). The loss of Pol II in the promoter-proximal regions of Oct4 target genes, given the commensurate loss of Pol II in the gene body, is likely due to reduced recruitment of the transcription apparatus. For these Oct4 target genes, where Pol II is lost from both promoter proximal and gene body regions, we would expect no change in TR, and a global analysis of such genes revealed that this is indeed the case (Figure 7C, S6G). We conclude that the pattern of reduced Pol II density at Oct4 target genes that occurs upon loss of Oct4 differs from that at c-Myc target genes upon loss of c-Myc, and suggest that this is due to differences in the stage at which the two transcription factors play their dominant regulatory roles.
NIH-PA Author Manuscript
NIH-PA Author Manuscript
Discussion
Transcription factors bind to specific DNA sequences and regulate gene expression by recruiting the transcription initiation apparatus to promoters (Hochheimer and Tjian, 2003; Ptashne and Gann, 1997; Roeder, 2005). Recent studies have shown that an additional level of regulation must occur subsequent to initiation at certain genes, and have proposed that certain transcription factors regulate this step (Core and Lis, 2008; Margaritis and Holstege, 2008; Peterlin and Price, 2006). The evidence described here indicates that promoter-proximal pausing is a more general feature of transcription by Pol II in vertebrate cells, and identifies c-Myc as playing a key role in pause release at a large population of actively transcribed genes in ES cells.
We describe several lines of evidence supporting the hypothesis that promoter-proximal pausing is a general feature of transcription by Pol II in ES cells. First, genome-wide analysis shows that the bulk of Pol II occupies the promoter proximal region of genes, even when these genes are among the most actively transcribed in the cell. Second, the pause factors DSIF and NELF typically co-occupy these sites with Pol II, consistent with the idea that they generally bind to the enzyme during early steps of transcription elongation. Third, inhibition of the pause-release factor P-TEFb prevents pause-release of promoter proximal paused Pol II at essentially all genes.
A handful of genes have been identified that are regulated by P-TEFb-dependent pause control, such as Hsp70 and cad (Eberhardy and Farnham, 2002; Lis et al., 2000). However, in retrospect, there were a number of observations that indicated that this step in transcription is more frequently regulated and might be general. Germ cells repress Pol II transcription globally by inhibiting P-TEFb function. In C.elegans germline blastomeres and in Drosophila primordial germ cells, PIE-1 and Pgc, respectively, repress global transcription by inhibiting P-TEFb function (Hanyu-Nakamura et al., 2008; Seydoux and Dunn, 1997; Zhang et al., 2003). The transcription factors of lentiviruses and retroviruses such as HIV and T-lymphotropic virus type I function by recruiting P-TEFb to their promoter regions, attenuating Pol II transcriptional pausing (Wei et al., 1998; Zhou et al., 2006). These viruses have thus generated their own means to overcome pause control.
The model that promoter proximal pausing is general has several implications for transcriptional control. A step subsequent to recruitment of the transcription initiation apparatus can, in principle, be regulated at any gene. Promoter proximal pausing may facilitate assembly of RNA processing factors and has been proposed to couple transcription and mRNA processing events (Glover-Cutter et al., 2008; Moore and Proudfoot, 2009). DSIF and Ser5P Pol II can bind capping enzyme and stimulate mRNA capping (Mandal et al., 2004; McCracken et al., 1997a; McCracken et al., 1997b; Wen and Shatkin, 1999). Ser2 phosphorylation by P-TEFb leads to splicing factor and 3′ end processing factor recruitment and is required for proper processing (Ahn et al., 2004; Komarnitsky et al., 2000; McCracken et al., 1997b; Ni et al., 2004). Promoter-proximal pausing also provides a mechanism to control transcription from bidirectional promoters (Core et al., 2008; Seila et al., 2008), perhaps facilitating the formation of nucleosome-depleted regions and thus providing improved access to regulators (Gilchrist et al., 2008).
Multiple lines of evidence support the contention that c-Myc/Max generally plays a role in Pol II pause release at its target genes in ES cells and does so through recruitment of P-TEFb. Loss of c-Myc reduces the levels of elongating Pol II but does not affect the levels of promoter-proximal Pol II. Inhibition of c-Myc/Max function leads to a substantial reduction in the levels of Ser2-phosphorylated Pol II in cells, which is the form associated with elongation, but does not affect the levels of Ser5-phosphorylated Pol II, which is the form associated with initiation.
NIH-PA Author Manuscript
NIH-PA Author Manuscript
cMyc binds P-TEFb, which is responsible for Ser2-phosphorylated Pol II. Consistent with a role in pause release, c-Myc is associated almost exclusively with genes that are actively transcribed, unlike other key ES cell regulators like Oct4 and Nanog, which occupy both active and repressed genes. Furthermore, c-Myc occupies promoter-proximal sites (Figure S5A), which are heavily enriched for the E-box core motif that it binds (Figure S5B), where c-Myc would be optimally positioned to recruit P-TEFb.
In ES cells, c-Myc occupies genes involved in cellular proliferation, as it does in other cell types (Chen et al., 2008; Kidder et al., 2008; Kim et al., 2008). Our results indicate that c-Myc plays a key role in pause release in ES cells and does so at perhaps 1/3 of all actively transcribed genes. These results explain how ectopic expression of c-Myc can substantially enhance the efficiency of reprogramming of fibroblasts to induced pluripotent stem cells (Takahashi et al., 2007; Takahashi and Yamanaka, 2006). Since c-Myc is expressed in a broad spectrum of proliferating cell types (Eilers and Eisenman, 2008; Meyer and Penn, 2008), and has been shown to bind P-TEFb and stimulate elongation at a set of genes in tumor cells (Eberhardy and Farnham, 2001, 2002; Gargano et al., 2007; Kanazawa et al., 2003), we expect that c-Myc functions to effect pause release at this population of genes in most proliferating cells. c-Myc amplification is the most frequent somatic copy-number amplification in tumor cells (Beroukhim et al., 2010). Our results suggest that tumor cells that overexpress c-Myc have enhanced expression of proliferation genes due to the role of c-Myc in recruiting P-TEFb to effect Pol II pause release at these genes. It is therefore possible that combinations of drugs that reduce the activity of both c-Myc and P-TEFb could be especially effective therapeutic agents in tumor cells that overexpress c-Myc.
Experimental Procedures
mES cell cultureV6.5 (C57BL/6-129) murine ES cells were grown under typical mES conditions on irradiated mouse embryonic fibroblasts (MEFs). For location analysis, cells were grown for two passages off of MEFs. For location analysis on mES cells following treatment with small molecule inhibitors, cells were grown two passages off feeders and prior to formaldehyde crosslinking, the cells were treated with the indicated final concentration of flavopiridol (1μM for 1 hour for ChIP-chip and ChIP-seq experiments, or the indicated concentration and time for Western blot analysis), or c-Myc/Max inhibitor 10058-F4 (50μM for 6 hours), both dissolved in DMSO, in the growth medium. As a control, DMSO alone was added at the same final volume as with drug. Small molecule inhibitors used were: Flavopiridol (Sigma cat #F3055), and c-Myc inhibitor 10058-F4 (Sigma cat #F3680). For location analysis following shRNA knockdown (OpenBiosystems), viral media was collected 48 hours after co-transfection in 293T cells and the mES cells were directly infected with the viral media 24 hours after initial plating of mES cells. The infection media was 1:2 viral media:mES media with 2mM polybrene. The efficiently infected cells were selected for 24 hours post infection with mES media containing 2μM puromycin. Cells were cross-linked 72 hours post selection. For location analysis following Oct4 shutdown, ZHBTc4 mES cells (Niwa et al., 2000) were grown under standard mES cell culture conditions and expanded for two passages off MEF feeders. mES media with 2 μg/ml doxycycline was added to the cells for 0 hours, 12 hours and 24 hours prior to formaldehyde crosslinking.
Chromatin immunoprecipitation (ChIP)
ChIP was done following the Agilent Mammalian ChIP-on-chip protocol. The antibodies and ChIP conditions used can be found in the Supplemental Information. For ChIP-chip analysis, Cy3- and Cy5-labeled ligation mediated PCR products were hybridized to a 44,000 feature
NIH-PA Author Manuscript
NIH-PA Author Manuscript
Agilent mouse microarray. For ChIP-seq analysis, Solexa/Illumina sequencing and analysis was done following the protocol described in Marson et al. 2008. Refer to the Supplemental Information for a detailed description of these methods.
Active and non-productive gene classes in mES cells
The active and non-productive genes were classified in mES cells using H3K4me3 (initiation-associated chromatin modification) and H3K79me2 (elongation-(initiation-associated chromatin modification), as determined by ChIP-seq (Marson et al. 2008), as markers of transcriptional state. Active genes had both H3K4me3 and H3K79me2 chromatin modifications, non-productive genes had only H3K4me3 and inactive genes did not have H3K4me3 or H3K79me2 (Guenther et al., 2007; Marson et al., 2008; Pokholok et al., 2005).
Traveling ratio calculation
Pol II levels peak in the 5′ region of many genes. To quantify this effect, we have developed a measure called Traveling Ratio (TR) that compares the ratio between Pol II density in the promoter and in the gene region. We defined the promoter region from -30 to +300 relative to the TSS and the gene body as the remaining length of the gene.
Heatmap analysis of ChIP-seq data
ChIP-seq enrichment for the indicated factor or modification was determined in 50bp bins (enrichment in the bin as counts per million), centered on each transcriptional start site. Generally, the gene list for each representation was rank ordered based on the amount of Pol II (all) in mES cells, from most to least to correlate the enrichment of the given factor with the amount of Pol II at each gene. Cluster 3.0 and Java Treeview were used to visualize the data and generate figures shown in this manuscript.
Previously published ChIP-seq datasets used in this study
H3K4me3, H3K79me2, and Oct4 occupancy in mES cells (Marson et al., 2008); Nanog and c-Myc occupancy in mES cells (Chen et al., 2008); and H3K27me3 occupancy in mES cells (Mikkelsen et al., 2007).
Supplementary Material
Refer to Web version on PubMed Central for supplementary material.
Acknowledgments
We thank Garrett Frampton for help with Solexa data analysis, David Price for antibodies and discussions; Hiroshi Handa for antibodies; Tom Volkert, Jennifer Love, Jeong-Ah Kwon, and Sumeet Gupta at the Whitehead Institute Sequencing Core for help with Solexa sequencing; and John Lis and members of the Young, Sharp and Burge laboratories for helpful discussions. This work was supported by National Institutes of Health grants RO1- HG002668 (RAY), RO1- GM34277 (PAS), RO1-CA133404 (PAS) from the National Institutes of Health, PO1-CA42063 from the National Cancer Institute (PAS) and Cancer Center Support (core) grant P30-CA14051 from the National Cancer Institute (PAS). ACS was supported by a National Institutes of Health postdoctoral fellowship 5-F32-HD051190. The ChIP-seq and microarray data is deposited on GEO under accession number GSE20485.
References
Adelman K, Wei W, Ardehali MB, Werner J, Zhu B, Reinberg D, Lis JT. Drosophila Paf1 modulates chromatin structure at actively transcribed genes. Mol Cell Biol 2006;26:250–260. [PubMed: 16354696]
Ahn SH, Kim M, Buratowski S. Phosphorylation of serine 2 within the RNA polymerase II C-terminal domain couples transcription and 3′ end processing. Mol Cell 2004;13:67–76. [PubMed: 14731395]
NIH-PA Author Manuscript
NIH-PA Author Manuscript
Andrulis ED, Guzman E, Doring P, Werner J, Lis JT. High-resolution localization of Drosophila Spt5 and Spt6 at heat shock genes in vivo: roles in promoter proximal pausing and transcription elongation. Genes Dev 2000;14:2635–2649. [PubMed: 11040217]
Barboric M, Nissen RM, Kanazawa S, Jabrane-Ferrat N, Peterlin BM. NF-kappaB binds P-TEFb to stimulate transcriptional elongation by RNA polymerase II. Mol Cell 2001;8:327–337. [PubMed: 11545735]
Bentley DL, Groudine M. A block to elongation is largely responsible for decreased transcription of c-myc in differentiated HL60 cells. Nature 1986;321:702–706. [PubMed: 3520340]
Beroukhim R, Mermel CH, Porter D, Wei G, Raychaudhuri S, Donovan J, Barretina J, Boehm JS, Dobson J, Urashima M, et al. The landscape of somatic copy-number alteration across human cancers. Nature 2010;463:899–905. [PubMed: 20164920]
Cartwright P, McLean C, Sheppard A, Rivett D, Jones K, Dalton S. LIF/STAT3 controls ES cell self-renewal and pluripotency by a Myc-dependent mechanism. Development 2005;132:885–896. [PubMed: 15673569]
Chao SH, Fujinaga K, Marion JE, Taube R, Sausville EA, Senderowicz AM, Peterlin BM, Price DH. Flavopiridol inhibits P-TEFb and blocks HIV-1 replication. J Biol Chem 2000;275:28345–28348. [PubMed: 10906320]
Chao SH, Price DH. Flavopiridol inactivates P-TEFb and blocks most RNA polymerase II transcription in vivo. J Biol Chem 2001;276:31793–31799. [PubMed: 11431468]
Chen X, Xu H, Yuan P, Fang F, Huss M, Vega VB, Wong E, Orlov YL, Zhang W, Jiang J, et al. Integration of external signaling pathways with the core transcriptional network in embryonic stem cells. Cell 2008;133:1106–1117. [PubMed: 18555785]
Cheng B, Price DH. Properties of RNA polymerase II elongation complexes before and after the P-TEFb-mediated transition into productive elongation. J Biol Chem 2007;282:21901–21912. [PubMed: 17548348]
Core LJ, Lis JT. Transcription regulation through promoter-proximal pausing of RNA polymerase II. Science 2008;319:1791–1792. [PubMed: 18369138]
Core LJ, Waterfall JJ, Lis JT. Nascent RNA sequencing reveals widespread pausing and divergent initiation at human promoters. Science 2008;322:1845–1848. [PubMed: 19056941]
Eberhardy SR, Farnham PJ. c-Myc mediates activation of the cad promoter via a post-RNA polymerase II recruitment mechanism. J Biol Chem 2001;276:48562–48571. [PubMed: 11673469]
Eberhardy SR, Farnham PJ. Myc recruits P-TEFb to mediate the final step in the transcriptional activation of the cad promoter. J Biol Chem 2002;277:40156–40162. [PubMed: 12177005]
Eilers M, Eisenman RN. Myc's broad reach. Genes Dev 2008;22:2755–2766. [PubMed: 18923074] Espinosa JM, Verdun RE, Emerson BM. p53 functions through stress- and promoter-specific recruitment
of transcription initiation components before and after DNA damage. Mol Cell 2003;12:1015–1027. [PubMed: 14580351]
Fuda NJ, Ardehali MB, Lis JT. Defining mechanisms that regulate RNA polymerase II transcription in vivo. Nature 2009;461:186–192. [PubMed: 19741698]
Gargano B, Amente S, Majello B, Lania L. P-TEFb is a crucial co-factor for Myc transactivation. Cell Cycle 2007;6:2031–2037. [PubMed: 17700062]
Gilmour DS, Lis JT. RNA polymerase II interacts with the promoter region of the noninduced hsp70 gene in Drosophila melanogaster cells. Mol Cell Biol 1986;6:3984–3989. [PubMed: 3099167] Glover-Cutter K, Kim S, Espinosa J, Bentley DL. RNA polymerase II pauses and associates with
pre-mRNA processing factors at both ends of genes. Nat Struct Mol Biol 2008;15:71–78. [PubMed: 18157150]
Guenther MG, Levine SS, Boyer LA, Jaenisch R, Young RA. A chromatin landmark and transcription initiation at most promoters in human cells. Cell 2007;130:77–88. [PubMed: 17632057]
Hall J, Guo G, Wray J, Eyres I, Nichols J, Grotewold L, Morfopoulou S, Humphreys P, Mansfield W, Walker R, et al. Oct4 and LIF/Stat3 additively induce Kruppel factors to sustain embryonic stem cell self-renewal. Cell Stem Cell 2009;5:597–609. [PubMed: 19951688]
Hammoudeh DI, Follis AV, Prochownik EV, Metallo SJ. Multiple independent binding sites for small-molecule inhibitors on the oncoprotein c-Myc. J Am Chem Soc 2009;131:7390–7401. [PubMed: 19432426]
NIH-PA Author Manuscript
NIH-PA Author Manuscript
Hanyu-Nakamura K, Sonobe-Nojima H, Tanigawa A, Lasko P, Nakamura A. Drosophila Pgc protein inhibits P-TEFb recruitment to chromatin in primordial germ cells. Nature 2008;451:730–733. [PubMed: 18200011]
Hochheimer A, Tjian R. Diversified transcription initiation complexes expand promoter selectivity and tissue-specific gene expression. Genes Dev 2003;17:1309–1320. [PubMed: 12782648]
Kanazawa S, Soucek L, Evan G, Okamoto T, Peterlin BM. c-Myc recruits P-TEFb for transcription, cellular proliferation and apoptosis. Oncogene 2003;22:5707–5711. [PubMed: 12944920] Kidder BL, Yang J, Palmer S. Stat3 and c-Myc genome-wide promoter occupancy in embryonic stem
cells. PLoS One 2008;3:e3932. [PubMed: 19079543]
Kim J, Chu J, Shen X, Wang J, Orkin SH. An extended transcriptional network for pluripotency of embryonic stem cells. Cell 2008;132:1049–1061. [PubMed: 18358816]
Kim JB, Sharp PA. Positive transcription elongation factor B phosphorylates hSPT5 and RNA polymerase II carboxyl-terminal domain independently of cyclin-dependent kinase-activating kinase. J Biol Chem 2001;276:12317–12323. [PubMed: 11145967]
Komarnitsky P, Cho EJ, Buratowski S. Different phosphorylated forms of RNA polymerase II and associated mRNA processing factors during transcription. Genes Dev 2000;14:2452–2460. [PubMed: 11018013]
Krogan NJ, Dover J, Wood A, Schneider J, Heidt J, Boateng MA, Dean K, Ryan OW, Golshani A, Johnston M, et al. The Paf1 complex is required for histone H3 methylation by COMPASS and Dot1p: linking transcriptional elongation to histone methylation. Mol Cell 2003;11:721–729. [PubMed: 12667454]
Lis JT, Mason P, Peng J, Price DH, Werner J. P-TEFb kinase recruitment and function at heat shock loci. Genes Dev 2000;14:792–803. [PubMed: 10766736]
Mandal SS, Chu C, Wada T, Handa H, Shatkin AJ, Reinberg D. Functional interactions of RNA-capping enzyme with factors that positively and negatively regulate promoter escape by RNA polymerase II. Proc Natl Acad Sci U S A 2004;101:7572–7577. [PubMed: 15136722]
Margaritis T, Holstege FC. Poised RNA polymerase II gives pause for thought. Cell 2008;133:581–584. [PubMed: 18485867]
Marshall NF, Peng J, Xie Z, Price DH. Control of RNA polymerase II elongation potential by a novel carboxyl-terminal domain kinase. J Biol Chem 1996;271:27176–27183. [PubMed: 8900211] Marshall NF, Price DH. Purification of P-TEFb, a transcription factor required for the transition into
productive elongation. J Biol Chem 1995;270:12335–12338. [PubMed: 7759473]
Marson A, Levine SS, Cole MF, Frampton GM, Brambrink T, Johnstone S, Guenther MG, Johnston WK, Wernig M, Newman J, et al. Connecting microRNA genes to the core transcriptional regulatory circuitry of embryonic stem cells. Cell 2008;134:521–533. [PubMed: 18692474]
Matoba R, Niwa H, Masui S, Ohtsuka S, Carter MG, Sharov AA, Ko MS. Dissecting Oct3/4-regulated gene networks in embryonic stem cells by expression profiling. PLoS One 2006;1:e26. [PubMed: 17183653]
McCracken S, Fong N, Rosonina E, Yankulov K, Brothers G, Siderovski D, Hessel A, Foster S, Shuman S, Bentley DL. 5′-Capping enzymes are targeted to pre-mRNA by binding to the phosphorylated carboxy-terminal domain of RNA polymerase II. Genes Dev 1997a;11:3306–3318. [PubMed: 9407024]
McCracken S, Fong N, Yankulov K, Ballantyne S, Pan G, Greenblatt J, Patterson SD, Wickens M, Bentley DL. The C-terminal domain of RNA polymerase II couples mRNA processing to transcription. Nature 1997b;385:357–361. [PubMed: 9002523]
Meyer N, Penn LZ. Reflecting on 25 years with MYC. Nat Rev Cancer 2008;8:976–990. [PubMed: 19029958]
Mikkelsen TS, Ku M, Jaffe DB, Issac B, Lieberman E, Giannoukos G, Alvarez P, Brockman W, Kim TK, Koche RP, et al. Genome-wide maps of chromatin state in pluripotent and lineage-committed cells. Nature 2007;448:553–560. [PubMed: 17603471]
Moore MJ, Proudfoot NJ. Pre-mRNA processing reaches back to transcription and ahead to translation. Cell 2009;136:688–700. [PubMed: 19239889]
NIH-PA Author Manuscript
NIH-PA Author Manuscript
Muse GW, Gilchrist DA, Nechaev S, Shah R, Parker JS, Grissom SF, Zeitlinger J, Adelman K. RNA polymerase is poised for activation across the genome. Nat Genet 2007;39:1507–1511. [PubMed: 17994021]
Ni Z, Saunders A, Fuda NJ, Yao J, Suarez JR, Webb WW, Lis JT. P-TEFb is critical for the maturation of RNA polymerase II into productive elongation in vivo. Mol Cell Biol 2008;28:1161–1170. [PubMed: 18070927]
Ni Z, Schwartz BE, Werner J, Suarez JR, Lis JT. Coordination of transcription, RNA processing, and surveillance by P-TEFb kinase on heat shock genes. Mol Cell 2004;13:55–65. [PubMed: 14731394] Niwa H, Miyazaki J, Smith AG. Quantitative expression of Oct-3/4 defines differentiation,
dedifferentiation or self-renewal of ES cells. Nat Genet 2000;24:372–376. [PubMed: 10742100] O'Brien T, Lis JT. RNA polymerase II pauses at the 5′ end of the transcriptionally induced Drosophila
hsp70 gene. Mol Cell Biol 1991;11:5285–5290. [PubMed: 1922045]
Peterlin BM, Price DH. Controlling the elongation phase of transcription with P-TEFb. Mol Cell 2006;23:297–305. [PubMed: 16885020]
Pokholok DK, Hannett NM, Young RA. Exchange of RNA polymerase II initiation and elongation factors during gene expression in vivo. Mol Cell 2002;9:799–809. [PubMed: 11983171]
Pokholok DK, Harbison CT, Levine S, Cole M, Hannett NM, Lee TI, Bell GW, Walker K, Rolfe PA, Herbolsheimer E, et al. Genome-wide map of nucleosome acetylation and methylation in yeast. Cell 2005;122:517–527. [PubMed: 16122420]
Price DH. Poised polymerases: on your mark…get set…go! Mol Cell 2008;30:7–10. [PubMed: 18406322]
Ptashne M, Gann A. Transcriptional activation by recruitment. Nature 1997;386:569–577. [PubMed: 9121580]
Reppas NB, Wade JT, Church GM, Struhl K. The transition between transcriptional initiation and elongation in E. coli is highly variable and often rate limiting. Mol Cell 2006;24:747–757. [PubMed: 17157257]
Roeder RG. Transcriptional regulation and the role of diverse coactivators in animal cells. FEBS Lett 2005;579:909–915. [PubMed: 15680973]
Rougvie AE, Lis JT. The RNA polymerase II molecule at the 5′ end of the uninduced hsp70 gene of D. melanogaster is transcriptionally engaged. Cell 1988;54:795–804. [PubMed: 3136931]
Sawado T, Halow J, Bender MA, Groudine M. The beta -globin locus control region (LCR) functions primarily by enhancing the transition from transcription initiation to elongation. Genes Dev 2003;17:1009–1018. [PubMed: 12672691]
Seila AC, Calabrese JM, Levine SS, Yeo GW, Rahl PB, Flynn RA, Young RA, Sharp PA. Divergent transcription from active promoters. Science 2008;322:1849–1851. [PubMed: 19056940] Seydoux G, Dunn MA. Transcriptionally repressed germ cells lack a subpopulation of phosphorylated
RNA polymerase II in early embryos of Caenorhabditis elegans and Drosophila melanogaster. Development 1997;124:2191–2201. [PubMed: 9187145]
Sharova LV, Sharov AA, Nedorezov T, Piao Y, Shaik N, Ko MS. Database for mRNA half-life of 19 977 genes obtained by DNA microarray analysis of pluripotent and differentiating mouse embryonic stem cells. DNA Res 2009;16:45–58. [PubMed: 19001483]
Takahashi K, Tanabe K, Ohnuki M, Narita M, Ichisaka T, Tomoda K, Yamanaka S. Induction of pluripotent stem cells from adult human fibroblasts by defined factors. Cell 2007;131:861–872. [PubMed: 18035408]
Takahashi K, Yamanaka S. Induction of pluripotent stem cells from mouse embryonic and adult fibroblast cultures by defined factors. Cell 2006;126:663–676. [PubMed: 16904174]
Wada T, Takagi T, Yamaguchi Y, Ferdous A, Imai T, Hirose S, Sugimoto S, Yano K, Hartzog GA, Winston F, et al. DSIF, a novel transcription elongation factor that regulates RNA polymerase II processivity, is composed of human Spt4 and Spt5 homologs. Genes Dev 1998a;12:343–356. [PubMed: 9450929]
Wada T, Takagi T, Yamaguchi Y, Watanabe D, Handa H. Evidence that P-TEFb alleviates the negative effect of DSIF on RNA polymerase II-dependent transcription in vitro. Embo J 1998b;17:7395–7403. [PubMed: 9857195]
NIH-PA Author Manuscript
NIH-PA Author Manuscript
Wade JT, Struhl K. The transition from transcriptional initiation to elongation. Curr Opin Genet Dev 2008;18:130–136. [PubMed: 18282700]
Wang H, Hammoudeh DI, Follis AV, Reese BE, Lazo JS, Metallo SJ, Prochownik EV. Improved low molecular weight Myc-Max inhibitors. Mol Cancer Ther 2007;6:2399–2408. [PubMed: 17876039] Wei P, Garber ME, Fang SM, Fischer WH, Jones KA. A novel CDK9-associated C-type cyclin interacts
directly with HIV-1 Tat and mediates its high-affinity, loop-specific binding to TAR RNA. Cell 1998;92:451–462. [PubMed: 9491887]
Wen Y, Shatkin AJ. Transcription elongation factor hSPT5 stimulates mRNA capping. Genes Dev 1999;13:1774–1779. [PubMed: 10421630]
Wu CH, Yamaguchi Y, Benjamin LR, Horvat-Gordon M, Washinsky J, Enerly E, Larsson J, Lambertsson A, Handa H, Gilmour D. NELF and DSIF cause promoter proximal pausing on the hsp70 promoter in Drosophila. Genes Dev 2003;17:1402–1414. [PubMed: 12782658]
Yamada T, Yamaguchi Y, Inukai N, Okamoto S, Mura T, Handa H. P-TEFb-mediated phosphorylation of hSpt5 C-terminal repeats is critical for processive transcription elongation. Mol Cell 2006;21:227– 237. [PubMed: 16427012]
Yamaguchi Y, Takagi T, Wada T, Yano K, Furuya A, Sugimoto S, Hasegawa J, Handa H. NELF, a multisubunit complex containing RD, cooperates with DSIF to repress RNA polymerase II elongation. Cell 1999;97:41–51. [PubMed: 10199401]
Yin X, Giap C, Lazo JS, Prochownik EV. Low molecular weight inhibitors of Myc-Max interaction and function. Oncogene 2003;22:6151–6159. [PubMed: 13679853]
Zhang F, Barboric M, Blackwell TK, Peterlin BM. A model of repression: CTD analogs and PIE-1 inhibit transcriptional elongation by P-TEFb. Genes Dev 2003;17:748–758. [PubMed: 12651893] Zhou M, Lu H, Park H, Wilson-Chiru J, Linton R, Brady JN. Tax interacts with P-TEFb in a novel manner
to stimulate human T-lymphotropic virus type 1 transcription. J Virol 2006;80:4781–4791. [PubMed: 16641271]
Zhu B, Mandal SS, Pham AD, Zheng Y, Erdjument-Bromage H, Batra SK, Tempst P, Reinberg D. The human PAF complex coordinates transcription with events downstream of RNA synthesis. Genes Dev 2005;19:1668–1673. [PubMed: 16024656]
NIH-PA Author Manuscript
NIH-PA Author Manuscript
Figure 1. Genome-wide occupancy of Pol II
(A) Occupancy of RNA Pol II (all), RNA Pol II Ser5P and RNA Pol II Ser2P in mES cells, determined by ChIP-seq analysis. Enrichment at a representative active gene (Rpl3) and non-productive gene (Surb7) is shown. Genome-wide binding averages (introns not depicted), in 50bp bins, are shown for each Pol II form to display the general binding patterns along the transcription unit from 2kb upstream of the transcriptional start site to 2.5kb downstream of the end of each annotated gene.
(B) Schematic representation describing the calculation used to determine the traveling ratio (TR) at each Pol II bound gene in mES cells. The promoter proximal bin is defined using a fixed window from −30bp to +300bp around the annotated start site. The transcribed region (gene body) bin is from +300bp to the annotated end. The TR is the ratio of Pol II density in the promoter proximal bin and the Pol II density in the transcribed region bin.
(C) Distribution of the percent of Pol II bound genes with a given TR. Approximately 91% of genes have a TR greater than 2, indicating the majority of Pol II bound genes have more Pol II in the promoter proximal region compared to the downstream transcribed region. See also Figure S1.
NIH-PA Author Manuscript
NIH-PA Author Manuscript
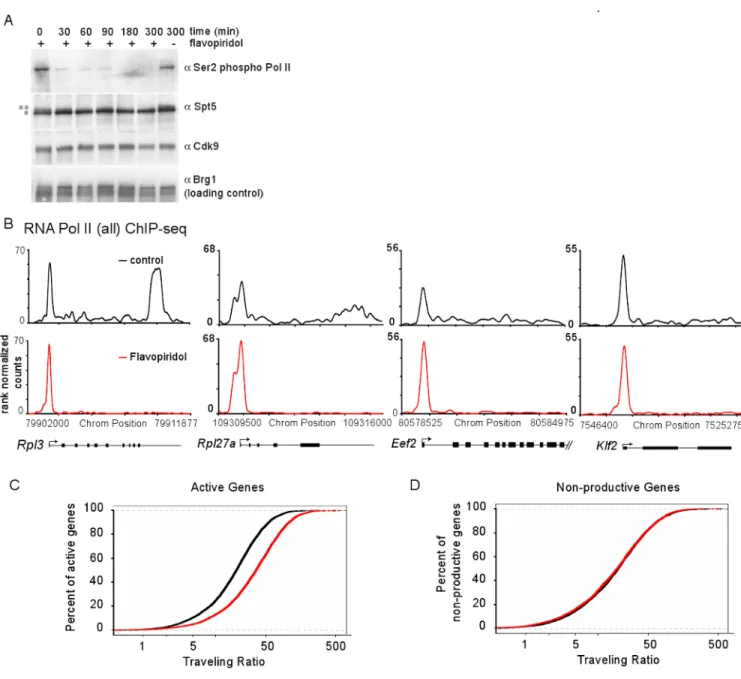
Figure 2. P-TEFb inhibition prevents release of promoter proximal Pol II
(A) mES cells were treated with 1μM flavopiridol for the indicated time. Extracts were analyzed by Western blot using antibodies against Pol II Ser2P, Spt5, Cdk9 and Brg1 (used as a loading control). ** indicates higher molecular weight Spt5 species, as reported in (Yamada et al., 2006), that is flavopiridol sensitive. * indicates lower molecular weight Spt5 species. See also Figure S2A.
(B) RNA Pol II (all) ChIP-seq analysis in mES cells treated with control (DMSO for 60 minutes, black) or flavopiridol (1μM for 60 minutes, red). This panel shows the changes in Pol II occupancy at four example actively transcribed genes following flavopiridol treatment. See also Figure S2B.
(C) Pol II traveling ratio distribution in flavopiridol-treated and control-treated mES cells for active genes (Pol II bound with H3K79me2-modified nucleosomes). Higher TR values indicate a higher degree of pausing.
NIH-PA Author Manuscript
NIH-PA Author Manuscript
(D) Pol II traveling ratio distribution for non-productive genes in mES cells (Pol II bound but without H3K79me2-modified nucleosomes), demonstrating that the TR distribution remains relatively the same for non-productive genes whether treated with control or flavopiridol.
NIH-PA Author Manuscript
NIH-PA Author Manuscript
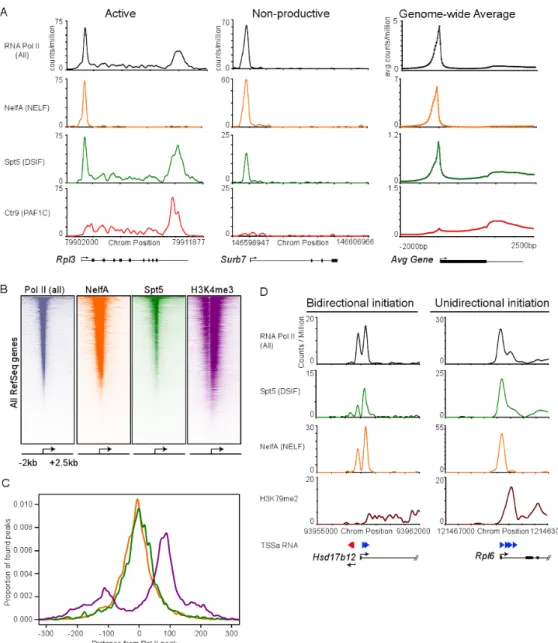
Figure 3. DSIF and NELF co-occupy most genes with Pol II
(A) Binding of Pol II (all), NelfA (NELF subunit), Spt5 (DSIF subunit) and Ctr9 (PAF1 subunit) using ChIP-seq analysis at a representative active gene (Rpl3), and non-productive gene (Surb7) in mES cells. Genome-wide binding averages (introns not depicted), in 50bp bins, are shown for each factor to display the general binding patterns along the transcription unit of RefSeq genes, from 2kb upstream of the transcriptional start site to 2.5kb downstream of the end of each annotated gene.
(B) Heatmap representation of ChIP-seq binding for Pol II (all; grey), NelfA (orange), Spt5 (green) and H3K4me3 (purple) at all mouse RefSeq genes, rank ordered from most Pol II to lowest Pol II. Color means enrichment, white means no enrichment. See also Figure S3. (C) Spatial distribution of the distance of Spt5, NelfA and H3K4me3 peaks from the promoter proximal Pol II peak at each enriched Pol II gene, demonstrating a general overlaps with Spt5, NelfA and Pol II peaks.
(D) ChIP-seq binding plots showing Pol II (all), Spt5 (DSIF), NelfA (NELF), elongation-associated chromatin modification (H3K79me2) and TSSa-RNA reads that map to this genomic region at a bidirectional intiated gene (Hsd17b12) and unidirectional initiated gene
NIH-PA Author Manuscript
NIH-PA Author Manuscript
(Rpl6). Red arrows represent TSSa-RNA species that map in the antisense direction to the gene, and blue arrows represent TSSa-RNA species that map in the sense direction to the gene.
NIH-PA Author Manuscript
NIH-PA Author Manuscript
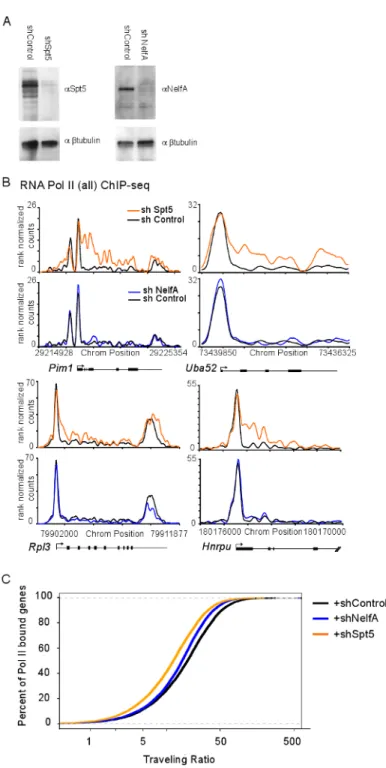
Figure 4. DSIF knockdown alters Pol II occupancy at many genes
(A) Spt5 (left) and NelfA (right) protein levels after the indicated shRNA-mediated knockdown in mES cells as determined by Western blot using Spt5 or NelfA antibodies. β-Tubulin protein is a loading control.
(B) RNA Pol II (all) ChIP-seq binding density in shControl (black), shSpt5 (orange) and shNelfA (blue) mES cells analysis at five active genes in mES cells.
(C) RNA Pol II TR calculations in shControl, shSpt5 and shNelfA mES cells, showing that many genes become less paused following Spt5 knockdown and a more subtle change following NelfA knockdown. Lower TR values indicate a lower degree of pausing. See also Figure S4.
NIH-PA Author Manuscript
NIH-PA Author Manuscript
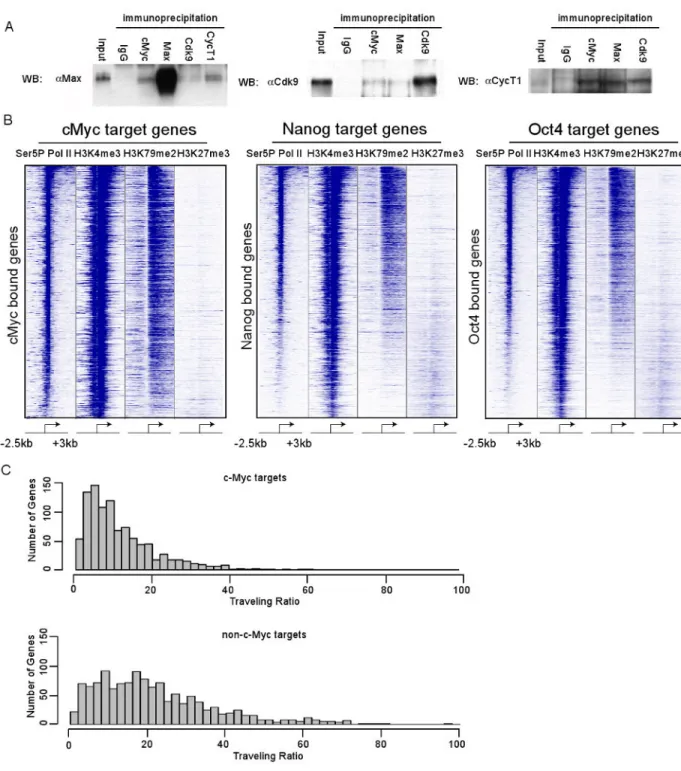
Figure 5. c-Myc target genes are enriched in actively transcribed genes and c-Myc/Max associates with P-TEFb in mES cells
(A) Co-immunoprecipitation experiments in mES cells using antibodies against IgG (to measure background binding), or endogenous c-Myc, Max, Cdk9, and CycT1. Proteins were immunopreipicated from mES cell lysates and analyzed by Western blot analysis by probing for Max, Cdk9 and CycT1. 10% input was loaded for the Max and Cdk9 blots, 1% input was loaded for the CycT1 blot.
(B) Heatmap representation illustrating the transcriptional state of c-Myc, Oct4, and Nanog target genes in mES cells, as determined by Pol II Ser5P, H3K4me3 (initiation-associated chromatin modification), H3K79me2 (elongation-associated chromatin modification) and
NIH-PA Author Manuscript
NIH-PA Author Manuscript
H3K27me3 (repressive chromatin modification). Each target gene set was rank ordered based on the amount of Pol II bound at each gene, from the highest amount of Pol II to the lowest amount and the enrichment of the indicated chromatin modification or Pol II is displayed from -2.5kb to +3kb surrounding each annotated transcription start site. Blue indicates enrichment and white indicates no enrichment.
(C) c-Myc target genes have lower TR values than non-target genes. Histograms were made for the number of genes with a given TR values for high confidence c-Myc target genes and non-target genes. Genes with lower TR values are less paused than genes with higher TR values. See also Figure S5.
NIH-PA Author Manuscript
NIH-PA Author Manuscript
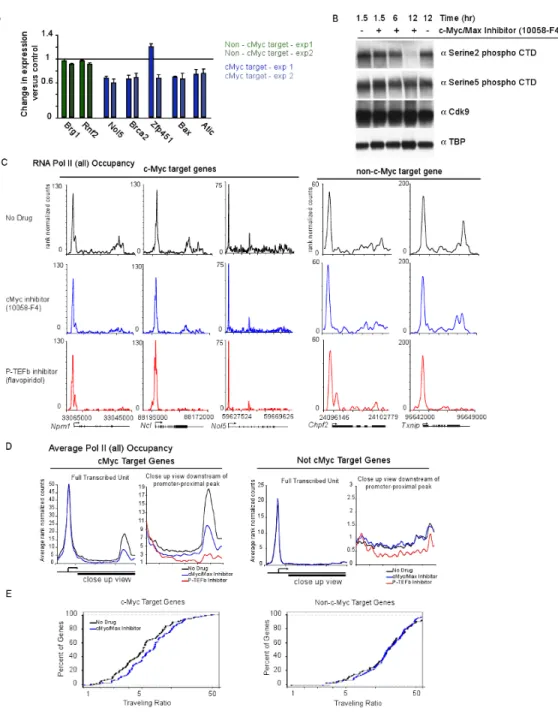
Figure 6. c-Myc inhibition effects transcription at the pause release step
(A) RNA was extracted from mES cells treated with 10058-F4 or vehicle alone (DMSO) for 6 hours and used to generate cDNA using reverse transcription. Expression change was calculated for 10058-F4 treated cells compared vehicle alone control for two non-c-Myc target genes (Brg1, Rnf2 green) and five cMyc target genes (Bax, Nol5, Zfp451, Brca2 and Atic -blue) from two independent experiments. Error bars represent s.d. from triplicate qPCR reactions.
(B) mES cells were treated with 10058-F4 for either 1.5, 6 or 12 hours. Extracts were analyzed using Western blot using antibodies against Pol II Ser2P CTD, and Pol II Ser5P CTD to determine the levels of the modified forms of Pol II. TBP was used as a loading control. (C) Pol II ChIP-seq binding profiles in mES cells treated with 10058-F4 (c-Myc/Max inhibitor; blue), DMSO alone (black), or flavopiridol (P-TEFb inhibitor; red). Pol II occupancy is shown
NIH-PA Author Manuscript
NIH-PA Author Manuscript
for three c-Myc target genes (Ncl, Npm1 and Nol5) and two non-cMyc target gene (Txnip and Chpf2). Cells were treated with 10058-F4 or DMSO for 6 hours. See also Figure S6.
(D) Average Pol II binding plots for the high confidence cMyc targets and non-c-Myc target genes in no drug (black), and 10058-F4 treatment (blue). The left panel shows the entire gene average. The right panel is a close up of the transcribed region to show the difference in amounts of elongating Pol II density under the different conditions. Also included in the right panel for comparison is elongating Pol II density following flavopiridol treatment (red).
(E) Pol II traveling ratio (TR) for the high confidence c-Myc target genes and non-c-Myc target genes following 10058-F4 treatment (blue) or no drug (black). The left panel is the TR for the c-Myc targets and right panel is the TR for non-c-Myc targets. Higher TR values indicate a higher degree of pausing.
NIH-PA Author Manuscript
NIH-PA Author Manuscript
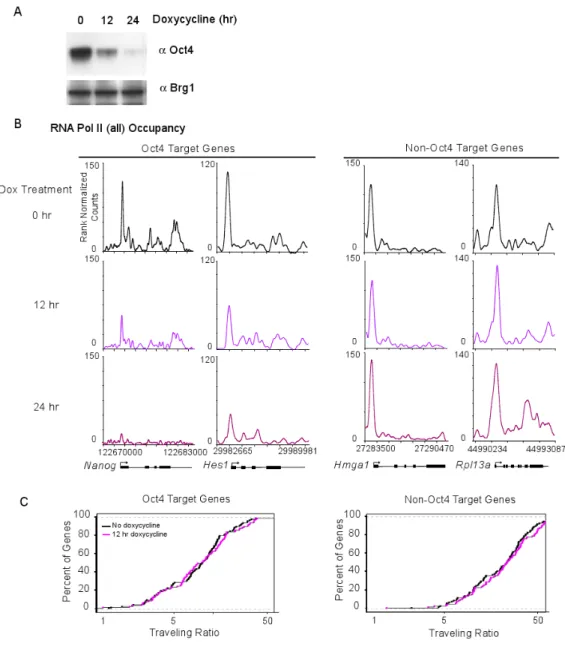
Figure 7. Oct4 shutdown reduces Pol II initiation at Oct4-dependent genes
(A) Oct4 protein levels in doxycycline-inducible Oct4 knockdown mES cells following 0, 12 or 24 hours of doxycycline treatment. Extracts were probed with an antibody against Oct4. Brg1 was used as a loading control.
(B) Pol II ChIP-seq binding profiles at Oct4 target genes following the indicated time of doxycycline treatment, inducing Oct4 knockdown. Of note, the Oct4 bound genes change Pol II occupancy in both the promoter proximal region and the transcribed region. The panel to the right shows Pol II ChIP-seq binding profiles at non-Oct4 target following the indicated time of doxycycline treatment, inducing Oct4 knockdown.
(C) Pol II traveling ratio (TR) as described in Figure 1C for the high confidence Oct4-dependent genes and Oct4 non-target genes after either 0 or 12 hrs of doxycycline treatment. The left panel is the TR for the Oct4 targets and right panel is the TR for non-Oct4 targets.