Publisher’s version / Version de l'éditeur:
Journal of Applied Chemistry and Biotechnology, 24, 3, pp. 157-170, 1974-03
READ THESE TERMS AND CONDITIONS CAREFULLY BEFORE USING THIS WEBSITE. https://nrc-publications.canada.ca/eng/copyright
Vous avez des questions? Nous pouvons vous aider. Pour communiquer directement avec un auteur, consultez la
première page de la revue dans laquelle son article a été publié afin de trouver ses coordonnées. Si vous n’arrivez pas à les repérer, communiquez avec nous à PublicationsArchive-ArchivesPublications@nrc-cnrc.gc.ca.
Questions? Contact the NRC Publications Archive team at
PublicationsArchive-ArchivesPublications@nrc-cnrc.gc.ca. If you wish to email the authors directly, please see the first page of the publication for their contact information.
NRC Publications Archive
Archives des publications du CNRC
This publication could be one of several versions: author’s original, accepted manuscript or the publisher’s version. / La version de cette publication peut être l’une des suivantes : la version prépublication de l’auteur, la version acceptée du manuscrit ou la version de l’éditeur.
Access and use of this website and the material on it are subject to the Terms and Conditions set forth at
The microstructural and hardening behaviour of tricalcium silicate
pastes in the presence of calcium chloride
Traetteberg, A.; Ramachandran, V. S.
https://publications-cnrc.canada.ca/fra/droits
L’accès à ce site Web et l’utilisation de son contenu sont assujettis aux conditions présentées dans le site LISEZ CES CONDITIONS ATTENTIVEMENT AVANT D’UTILISER CE SITE WEB.
NRC Publications Record / Notice d'Archives des publications de CNRC:
https://nrc-publications.canada.ca/eng/view/object/?id=0b8750c8-8911-4f2e-b33a-35004abc5527 https://publications-cnrc.canada.ca/fra/voir/objet/?id=0b8750c8-8911-4f2e-b33a-35004abc5527The Microstructural and Hardening Behaviour of Tricalcium
Silicate Pastes in the Presence of Calcium Chloride
A u d Traetteberga a n d V. S. Ramachandran
National Research Co~rricif of Catiada, Divisiorl of Builditig Research, Ottawa K I A 0 R 6 , Catiada
(Paper received 6 December 1973, atnetidedpaper. accepted 12 February 1974)
A sequential examination of strength development in terms of microhardness was studied during paste hydration of C3S in the presence of 2 and 5 % CaC12 and at w/s ratios of 0.3 or 0.5. An attempt has been made to relate strength with microstructural features studied by means of Scanning Electron Micro- scopy. Generally, at earlier periods it was found that the 2 % addition of CaC12 gave the strongest material; the effect was most pronounced in the 6-month sample of the series with 0.3 w/s. The high strength for the sample prepared at a w/s ratio of 0.3 may be related to a high CaO/Si02 C-S-H-phase, low poro- sity, and possibly a hydrated calcium hydroxy chloride complex. The pore size distribution was also measured. In general, the higher the porosity the lower the strengths but the relationship was not perfectly linear even on the semi- logarithmic plot.
1. Introduction
The tricalcium silicate phase, constituting the major component in Portland cement, greatly influences its strength characteristics. The acceleration of hardening of Portland cement in the presence of admixtures such as CaCI, is mainly attributed t o its action on the silicate phases. Most work on the influence of CaCI, on the hydra- tion of C3Sh has been concerned with the determination of the degree of hydration and some morphological features,'-lo and little attention has been directed t o the study of the development of strength."-l6 One reason for this is that it is costly t o provide the amounts of C,S normally considered necessary for strength determina- tions.
One of the most important questions in cement chemistry is that concerning the mechanism of strength development. Divergent views have been expressed and differ- ent factors have been considered vlz., porosity, amount of the hydrated product, chemical composition, morphology, surface area, and degree of polymerisation, b u t no satisfactory method to predict the development of strength in cementitious materials with any accuracy has been offered.
It appears that a combination of methods should be used to follow the hydration behaviour sequentially for materials such as C3S with and without CaC1,. The sig- nificance of microhardness measurements for porous inorganic materials has been
" Visiting Scientist, Technical University of Norway, Trondheim.
I, In cement literature C = CaO, S = Si02, H = H,O and w/s = waterlsolid ratio. 157
discussed by Sereda in a recent paper." In this present work an attempt has been made to correlate the microstructural development in the system C,S
+
CaC1, + H with strength as indicated by microhardness indentation and cone penetrati measurements. The strength has also been discussed in terms of microstruc development, porosity and hydration characteristics.2. Experimental 2.1. Samples
The synthetic C3S was supplied by Tetratech International, San Diego, and chen~ica analysis showed it to contain: 73.5% CaO, 26.0"/,i02, 0.5% MgO and 0.1
%
in solubles. The C3S had a N2 surface area of 0.45 m2/g. The calcium chlor CaC1,.6H20 was a Fisher certified reagent. The water used was decarbonated de-ionized.Powdered samples (2 g of each) were taken in small polypropylene vials and w or CaC12 solution was added. They were then rotated on rollers for the requ length of time. Hydration was stopped a t the necessary intervals of time (4 h to months) by placing sample in cold acetone. Subsequently the sample was vacuum- dried for 24 h using liquid air trap. The samples were prepared at 70 2 1 OF.
For strength tests, pastes of C3S were prepared by rapidly mixing the solid with water or a CaCl, solution, then transferred to specially designed plexiglass cylinders 2.5 cm in diameter and 1.3 cm high. The pastes were kept under vapour-sealed con- ditions and rotated until set in order to prevent segregation. Two series of pastes with w/s ratios of 0.3 and 0.5 were made of three compositions, pure C,S, C3S+2% CaCI, and C3S+ 5 %, CaC1, (anhydrous basis). The strength was tested a t intervals from 4 h to 6 months. The shape of the samples was similar to that used for previous s t u d i e ~ . ' ~ The surface of the sample was large enough to permit both microhardness and cone penetration determinations.
2.2. Methods
2.2.1 Microhardness
A Leitz Miniload Hardness Tester was used; the test method employed the Vicker's pyramid indenter, which was placed in a conditioned box free of C 0 2 . The hardness was calculated from the formula:
where P = load in grams
d = mean value of the indentation diagonals.
Microhardness indentations were done on 5 spots on the surface and 10 diagonals were averaged for calculation of the hardness according t o the given formula.
2.2.2. Cone perletration
This method has been investigated for different kinds of materials by Sereda" and results on the C,A
+
H 2 0+
CaS0,.2H,O+
CaCI, system described in a previousTricalcium silicate pastes in calcium chloride 159
paper.18 It has been found especially useful for strength investigations of celllent paste in the early setting period. However, in the present work, penetration measure- ments were taken to determine if this method gives reasonable values for strength development in the hardened state also in relation t o the microhardness results.
The hardness is calculated on the basis of the applied load per unit area o n the circumferential area of the 60" cone as follows:
load H, = ---.
2.1 x h' where H, = Ibs/in.'
11 = depth of pelletration (inches). load = Ibs.
The load was supplied in steps of 3 Ib and the penetration depth was measured at each level after reaching the equilibrium value. Hardness was obtained by averaging the values representing the deeper penetration that are believed to represent the hardness of the three-dimensional s t r u ~ t u r e . ' ~ The microhardness values were con- verted to kg/mm2.
2.2.3 S c a ~ ~ n i n g electron ~nicroscopy
The microstructure of the pastes was examined using a Cambridge Stereoscan M a r k 2A. The examination was done o n fractured pieces.
Surface area was obtained by means of a Numinco-Orr surface area-pore volume analyser with Nz as the adsorbate. Powdered samples were dried for 3 h at 110 "C prior to the measurements.
Total porosity and pore size distribution were measured by a n Aniinco-Winslow Porosimeter. The fractured samples were initially dried for 3 h at 110 OC under vacuum.
3. Results and Discussion 3.1. Compressive strength-microhardness relationship
T o assess the validity of using the microhardness as a measure of the strength of porous materials, a series of tests was run comparing microhardness with com- pressive strength. Because a large amount of material is required for these tests, Portland cement was used in place of pure C3S. As Portland cement paste is composed predominantly of silicate hydrates, similar to those formed in C 3 S paste, it is reason- able to conclude that the relation found between microhardness and compressive strength for Portland cement paste would also be applicable to the C,S paste.
A paste of Portland cement was prepared according to A S T M C-305. Normal consistency cubes were made a t a w/c ratio of 0.24. Discs 2.6 cm in diameter and 3 mm thick were prepared for the microhardness measurements, and 2-in. cube specimens were prepared for the compressive strength tests. During hydration thc discs and cubes were stored in a conditioning room at 100% r.h. at 70f 2 O F . The
160 A. Traetteberg and V. S. Ramachandran
Five microindentation measurements were taken for each specimen. Each measure- ment yielded 2 values based on the two diagonals. Compressive strength represented an average of 3 values.
In Figure 1 the mean value of the compressive strength is plotted versus the mean value of microhardness for corresponding hydration times. The data resulted in a reasonably good linear relationship between microhardness and compressive strength when the 6-h value was omitted. The low strength at 6 h may have been due to the surface of the paste being somewhat soft at this age.
0
I I I I I
0 20 40 60 80 100 120
Microhardness ( kg/mrn2)
Figure 1. Compressive strength versus microhardness for hydrated Portland cement.
These results suggest that a linear relationship exists between compressive strength and microhardness in Portland cement, thus it is reasonable to assume that such a relationship also exists for cement components such as C3S.
3.2. Microhardness
The results for the two w/s ratio series are recorded in Table 1. Some minor scattering in the valdes does occur, but the general trend is evident. The three pastes, pure C3S, C3S
+
2%
CaCI, and C3S+
5%
CaCI, generally exhibited a steady increase in strength with hydration time. With a w/s ratio of 0.5, the 2 % addition of CaCI, resulted in the strongest paste up to 3 months. This result is in agreement with that of Kurczyk and SchwieteL6 who examined the compressive strength of 28-day-old pastes in the shape of cylinders containing different amounts of CaCI, up to 3%.
Figures 2 to 4 and 5 to 7 show representative morphologies of the pastes (w/s =
0 . 5 ) at 30 days and 3 months respectively. Surface areas for these samples are given in Table 2. The loose n~orphology and the relatively lower content of the C-S-H phase in the pure C3S paste, as well as the lower surface area of this paste, correspond to the lower strengths compared with C 3 S + 2 % CaCl, paste.,' The DTA and TGA analysis showed that in the C3S+ 5
%
CaCl, paste less Ca(OH), is formed compared=1
g-
=.
-
F
iT u mTABLE I. Microhardness (kg/mm2) for pastes of C3S, C3S
+
2 % CaCI, and C3S+
5 % CaCI, 8'0
Waterlsolid = 0.5 Waterlsolid = 0.3 E
Hydration time C3S C 3 S + 2 % CaCI, C3S+5 % CaCI, C3S C 3 S + 2 % CaC12 C3S+ 5 % CaC12 D. E
3 4 h 2.7 0 e 6 h 3.7 4.3
g
8 h 4.5 5.8 12 h m 2.7 - - 16 h 0.6 2.9 1.2 - - - I day 0.9 11.6 1.3 5.3 13.5 10.0 2 days 1.5 8.5 2.3 7.4 22.5 15.8 3 days 1.5 10.0 2.8 8.7 27.7 23.0 7 days 2.3 12.0 4.2 11.9 29.8 29.0 10 days 1.3 15.3 5.8 14.1 36.5 35.3 15 days 3.1 19.0 9.4 17.2 31.7 36.0 30 days 5.6 33.2 20.5 20.9 34.6 50.5 3 months 7.0 36.5 15.8 22.0 47.8 60.4 6 months 8.4 23.8 22.8 32.2 66.0 41.7 (cut sample)A. Traetteberg and V. S. Ramachandran
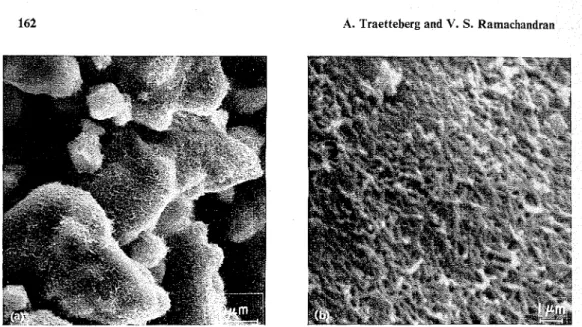
Figure 2 (a). Paste of C 3 S + H 2 0 hydrated 30 days (w/s = 0.5); (b) Paste of C3S hydrated 30 days (w/s = 0.5) at higher magnification.
Figure 3. Paste of C 3 S + 2 % CaCI,, hydrated Figure 4. Paste of C3S+5% CaC12, hydrated 30 days (w/s = 0.5). 30 days (w/s = 0.5).
with the 2 % CaCI, paste. A different structural arrangement might possibly be the reason for the much higher surface area in this paste. This cannot be adequately demonstrated from the morphology of the 30-day sample because the surface area is influenced a t a more micro level. However, the sample seems to consist of agglo- merates of more separate particles that might cause the weaker structure (Figure 4). The surface areas for the pastes containing 2
%
CaCI, are about the same a t 1 month and 3 months. There is a decrease however, for C,S+ 5%
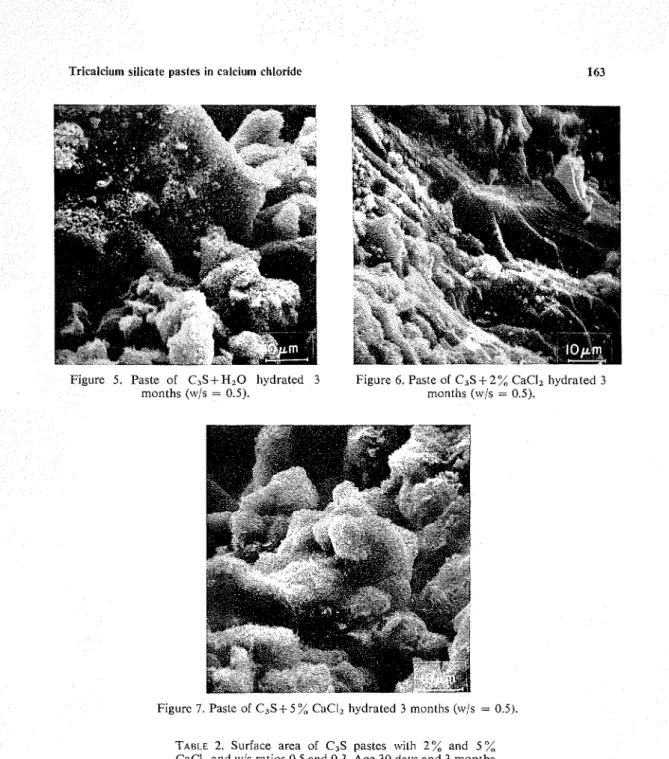
CaCI, and it is assumed that some coalescence of the individual microunits has taken place in this pasteFigure 5. Paste of C , S + H 2 0 hydrated 3 Figure 6. Paste of C3S+2"/, CaCI, hydrated 3
months (w/s = 0.5). months (w/s = 0.5).
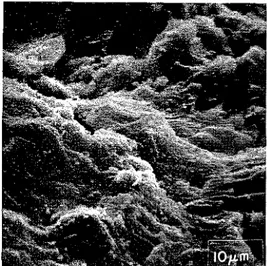
Figurc 7. Pastc of C3S+ 5 %, CaCI, hydrated 3 months (w/s = 0.5).
TABLE 2. Surface area of C3S pastes with 2 % and 5% CaClz and w/s ratios 0.5 and 0.3. Age 30 days and 3 months
Surface area (m2/g)
164 A. Traetteberg and V. S. Ramachandran
between 1 and 3 months. The micrograph of the 3-month sample containing 2 % CaCI, shows a more dense n~icrostructure than that of the paste with 5 % CaCl, (Figures 6 and 7), and this may lead to higher strength.
The micrographs of the series with w/s ratio 0.3 (Figures 8 to 10) indicate a denser morphology of the 30-day pastes compared with the 0.5 w/s series (Figures 2 to 4). Surface areas of the 0.3 w/s series are less than the corresponding pastes of the 0.5 w/s series (Table 2). The strength at 30 days is also higher for all three mixtures.
The amount of hydration is estimated to be about the same in all three pastesZ0 a t 3 months a t a w/s ratio 0.3. It is generally believed,16 that the C-S-H phase with a
Figure 8. Paste of C3S+ HZO hydrated 30 days (w/s = 0.3).
Figure 9. Paste of C 3 S + 2 % CaCIZ hydrated Figure 10. Pastc of C3S+5% CaClz hydrated 30 days (w/s = 0.3). 30 days (w/s = 0.3).
Tricalciurn silicate pastes in calcium chloride 165
higher CaO/SiO, ratio yields a weaker material than that containing lower CIS ratios. This is probably true for pastes prepared a t higher w/s ratios. However, in the paste containing 5
%
CaC1, with a w/s ratio of 0.3, DTA results indicate that a higher CIS product is formed and higher strengths have been obtained. It appears that if conditions are adjusted so that C-S-H forms in a confined space the high CIS pro- duct has a better opportunity to form good bonds. Similar behaviour has been observed in other systems."," In the system CaO-CaC1,-H,O two oxychlorides of composition 3CaO.CaCl,.16H2O and CaO.CaCI2.2H,O exist. The former is stable at CaC1, concentrations of 18 "/,r more and the latter at 34% or more. At a w/s ratio of 0.3 and with 5 % CaCl,, the concentration of CaC1, may possibly be sufficiently high, especially at later periods, to encourage formation of calcium hydroxy chloride23 which may impart some strength to the paste. However, no definite evidence was obtained for the presence of this complex in the X-ray dif- fraction pattern.The surface area of the 3-month samples in this series had diminished considerably from 1 month (Table 2), probably due to the polycondensation of SiOH units with ageing. The micrographs gave some evidence for a coalescence of the grains and denser matrix (Figures 11 to 13). This is in accordance with the relatively high strength of the pastes in the 0.3 w/s series.
Measurement of microhardness requires that the hydrated phase is not carbonated. This becomes a more serious problem in the measurement of microhardness of samples hydrated over a longer period. In the samples of C,S hydrated for 6 months the average amount was 3.7
%
CO, and, therefore, the microhardness measurements were carried out on samples cut 2 mm from the surface. The results (Table 1) show that samples containing 2 % CaCI, showed highest strengths at a w/s of 0.3. A higher value for the 6-month sample at w/s ratio of 0.3 from 47.8 at 3 months was un- expected. The immediate reason is not obvious but there is a possibility that ageingFigure 11. Paste of C3S+H,0 hydrated 3 Figure 12. Paste of C3S+2% CaCI, hydrated months (w/s = 0.3). 3 months (w/s = 0.3).
A. Traetteberg and V. S. Ramactlandran
Figure 13. Paste of C3S+ 5 Y $ CaClz hydrated 3 months (w/s = 0.3).
and polycoildensation has proceeded more in this sample or carbonation has pro- ceeded farther into this sample than in the others, in this series. This is known to increase strengths of C,S pastes.24 It is thus possible that the values of 3-months-old samples are lower than those reported in Table 1 as these values were obtained from uncut samples.
The total porosity and the pore size distribution were examined for the 6-month samples by means of mercury porosimetry (Figures 14 and 15). Generally, the highest strength corresponded to the lowest porosity and the lowest strength to the highest porosity. A plot of porosity against log microhardness yielded a linear type of re- lationship with some scatter (Figure 16). Some scatter in the results was expected
u
10.5 4.0 2.0Diameter of pores ( p )
Figure 14. Pore size distribution in C3S paste hydratcd for 6 months (w/s = 0.5). C3S+O% CaCI2
Figure 16. Microhardness versus porosity relationship for C,S paste. w/s = 0.5 (-1); w/s = 0.3 (0) 3 0 I I I I I I I I I I
-
s
2 0 - 05
- 0 >-
- /---I /--- /' - /'
- / 2 0 10- a - 15 7.0 3.0 1.0 0.5 0 . 3 0.1 0.05 0.026 0.01u
10.5 4.0 2.0 D~orneter of pores ( ,K)F i g ~ ~ r e 15. Pore size distribution in C3S paste hydrated for 6 months (w/s = 0.3). C3S+O (- - --); C3S+2"/, CaCl, (-); C3S-t5% CaClz (- - -).
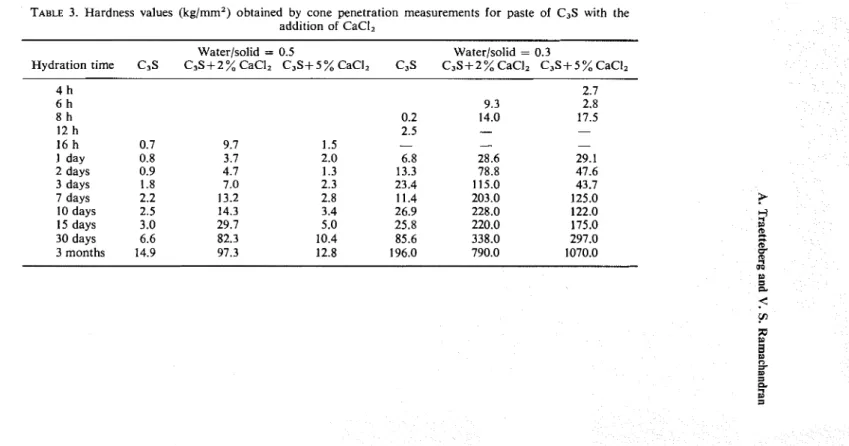
TABLE 3. Hardness values (kg/mm2) obtained by cone penetration measurements for paste of C3S with the addition of CaCI,
Waterlsolid = 0.5 Waterlsolid = 0.3
Hydration time C3S C3S+ 2 % CaCI2 C3S+ 5 % CaCI, C3S C3S+2 % CaCI2 C3S+ 5 % CaCI2 4 h - - 2.7 6 h 9.3 2.8 8 h 0.2 14.0 17.5 12 h 2.5 - - 16 h 0.7 9.7 1.5 - - - 1 day 0.8 3.7 2.0 6.8 28.6 29.1 2 days 0.9 4.7 1.3 13.3 78.8 47.6 3 days 1.8 7.0 2.3 23.4 115.0 43.7 7 days 2.2 13.2 2.8 11.4 203.0 125.0 10 days 2.5 14.3 3.4 26.9 228.0 122.0 15 days 3.0 29.7 5.0 25.8 220.0 175.0 30 days 6.6 82.3 10.4 85.6 338.0 297.0 3 months 14.9 97.3 12.8 196.0 790.0 1070.0
Tricalcium silicate pastes in calcium chloride 169
since the points referred to may have different structuration. Earlier work by Sereda indicated that in the gypsum system small amounts of admixtures were sufficient to change the structure of the product to yield individual straight-line relationship for any particular method of preparation.17 In addition to this the mercury porosimetry may yield slightly lower porosity values than the theoretical values.
Assuming that the density of the hydrated products is the same, porosity: surface area is an increasing function of the so-called hydraulic radius, and it was found that for a particular w/s ratio the larger the porosity: surface area ratio the lower was the microhardness value. For example for samples prepared at w/s ratio of 0.5 the micro- hardness values were 8.4, 23.8, and 22.8 kg/mm2 and the porosity: surface area values were 3.2, 0.9 and 0.9 respectively. For samples prepared at a w/s ratio of 0.3 the hardness values were 32.2, 66.0 and 41.7 kg/mm2 and the corresponding poro- sity:surface area ratios were 8.6, 3.4 and 4.9 kglmm? It appears that the strength for a particular w/s ratio increases as the average pore radius decreases.
In a previous reportl8 it was found that above a certain hardness level the cone penetration measurements give too high a hardness value. Despite this fact the method was employed for strength examination of C3S pastes for two reasons: other workers have applied the cone penetration in pastes;15 and, it was of interest t o determine if the method would show the same pattern in hardness values as the microhardness indentations.
The penetrations were carried out for all the pastes up to 3 months and the cal- culated hardness values are recorded in Table 3. Only a fair agreement between the methods was obtained for the pure C3S paste and the C,S
+
5%
CaC1, paste (w/s =0.5), which had the lowest hardness level. In the other pastes the hardness values showed some agreement at early hydration stages, but as the materials became harder the cone penetration method gave increasingly higher values than the micro- hardness measurements. The difference in cone penetration and microhardness values may be due to the former being done at a deeper location than the latter. Within each of the two w/s series the pattern in strength development seemed t o follow similar trends for both methods. It might, therefore, be seen that cone pene- tration is convenient and useful in the early setting period, and may give relative estimates of strength at later stages.
4. Conclusions
A linear relation was obtained between microhardness and compressive strength for pastes of Portland cement. The method of microhardness indentation has been found useful as a tool for strength measurements with the added advantage that a small sample is required and because the samples are not broken the same specimen can be used for examination by other techniques.
The strength development during hydration of C3S pastes has been found t o be related to morphological features, the relative amounts and type of reaction products, and the porosity. The total porosity gives an approximate linear relationship with logarithm of strength. Lack of perfect linearity may be attributed to the samples being different in composition and morphology.
170 A. Traetteberg and V. S. Ramachandran
The porosity: surface area ratio at a particular w/s ratio gives a good indication of strength development in C,S pastes. The addition of 2 % CaCll resulted in the strong- est paste at earlier periods; the effect was most significant in the series with the 0.3 w/s ratio at 6 months. A decrease in the w/s ratio for a paste generally led t o improved strength. In this case the higher strengths are ascribed to a C-S-H product with a higher CaO/SiOl ratio because at longer periods of curing, less Ca(OH), is formed in these pastes compared to those prepared at a w/s ratio of 0.5. The two methods, microhardness indentation and cone penetration showed some agreement at early hydration stages; measurements of microhardness by indentation, however, are con- sidered to give a better measure of strength at later stages of hydration.
Acknowledgments
The authors would like to thank P. J. Sereda and R. F. Feldman for many useful discussions and E. G. Quinn for his contribution to the experimental work. Thanks are also due to the assistance of R. E. Myers and S. E. Dods.
One of the authors, Aud Traetteberg, o n leave from the Technical University of Norway, would like to thank the Royal Norwegian Council for Scientific and In- dustrial Research for financial support, and the National Research Council of Canada for the opportunity to work in the Division of Building Research.
This paper is a contribution from the Division of Building Research, National Research Council of Canada, and is published with the approval of the Director of the Division.
References
1. Collepardi, M.; Rossi, G.; Spiga, M. C. Atztl. di Cllinl. 1971, 61, 137. 2. Collepardi, M.; Marchese, B. Cem. Concr. Res. 1972, 2, 57. 3. Collepardi, M.; Rossi, G . ; Usai, G. Itd. Ital. Clretn. 1968, 10, 657. 4. Skalny, J.; Odler, I.; Hagymassy, J. J. Colloid Sci. 1971, 35, 434. 5. Celani, A.; Collepardi, M.; Rio, A. Itld. Ital. Cett~. 1966, 36, 669. 6. Ramachandran, V. S. mat. Cottstr. 1971, 4, 3.
7. Ramachandran, V. S. Tlrertnoclrim. Acta, 1971, 2, 41.
8. Tenoutasse, N. V. Itrtertr. Symp. Clretn. Cement Tokyo, 1968, 2, 372. 9. Rio, A.; Celani, A. ; Saini, A. Estr. U Cem. 1970, 67, 17.
10. Odler, I.; Skalny, J. J. Am. Cerattl. Soc. 1971, 54, 362.
11. Andreeva, E. P.; Segalova, E. E. Dokl. Akad. Nauk SSSR 1964, 158, 1352. 12. P'ing-i, Chou; Segalova, E. E.; Luk'yanova, 0. J. Kolloidtryi zlr~rrtral, 1964, 26, 373.
13. Andreeva, E. P.; Keshelava, B. F.; Rebinder, P. A. Dokl. Akad. Na~rk SSSR 1969, 184, 1144. 14. Luk'yanova, 0. J.; Rebinder, P. A. Dokl. Akad. Nauk SSSR 1969, 184, 1144.
15. Andreeva, E. P.; Segalova, E. E. Kolloidnyi zlr~rrtral 1960, 22, 503. 16. Kurczyk, H. G.; Schwiete, H. E. Totritrd.-Ztg. Keram. Rdslr 1960, 84, 585. 17, Sereda, P. J. Cem. Concr. Res. 1972, 2, 717.
18. Traetteberg, A,; Sereda, P. J. Stretrgtlt of C 3 A paste contaitrit~g gyps~tttr and CaCI,. (Submitted to the VI International Symposium on the Chemistry of Cement to be held in Sept. 1974, Moscow.) 19. Sereda, P. J. Sigtrificatlce of Cotre Petletration Test for Setting of Cements. (TO be published). 20. Traetteberg, A.; Ramachandran, V. S.; Grattan-Belew, P. E. A Study of /Ire Microstr~tctlrre atrd
H y h t i o t z Clraracter istics of Tricalcilrttl Silicate in //re Presence of' Calcilrtn Cl~loride. Cem. Concr. Res. 1974, 4, 203.
21. Ramachandran, V. S.; Feldman, R. F. Hydratior1 Clraracteristics of Morrocalcirrnt Alunrit~ate at a Low WaterlSolid Ratio. Cenr. Cotrcr. Res. 1973, 3, 729.
22. Ramachandran, V. S.; Feldman, R. F. J. App. chem. Bioteclrtrol 1973, 23, 625. 23. Skalny, J.; Odler, I. Mag. Cotrcr. Res. 1967, 19, 203.