HAL Id: hal-01895776
https://hal.uca.fr/hal-01895776
Submitted on 15 Oct 2018
HAL is a multi-disciplinary open access
archive for the deposit and dissemination of
sci-entific research documents, whether they are
pub-lished or not. The documents may come from
teaching and research institutions in France or
abroad, or from public or private research centers.
L’archive ouverte pluridisciplinaire HAL, est
destinée au dépôt et à la diffusion de documents
scientifiques de niveau recherche, publiés ou non,
émanant des établissements d’enseignement et de
recherche français ou étrangers, des laboratoires
publics ou privés.
In situ observations of a reduction in effective crystal
diameter in cirrus clouds near flight corridors
A. Kristensson, J.-F Gayet, J. Ström, F. Auriol
To cite this version:
A. Kristensson, J.-F Gayet, J. Ström, F. Auriol. In situ observations of a reduction in effective crystal
diameter in cirrus clouds near flight corridors. Geophysical Research Letters, American Geophysical
Union, 2000, 27 (5), pp.681-684. �10.1029/1999GL010934�. �hal-01895776�
GEOPHYSICAL RESEARCH LETTERS, VOL. 27, NO. 5, PAGES 681-684, MARCH 1, 2000
In situ observations
of a reduction in effective crystal diameter
in cirrus clouds near flight corridors
A. Kristensson
•, J.-F.
Gayet
2, J. Str/Sm
• and
F. Auriol
2
Abstract. Measurements of the crystal size distributionperformed over Southern Germany show that the effective diameter decrease 10-30% in cirrus clouds perturbed by
aircraft. The reduction is more pronounced at higher cloud water content and is not observed at temperatures warmer
than -30øC.
Introduction
Concurrent with the increase in use of aviation fuel,
observations show an increase in the frequency of occurrence
and area coverage of cirrus clouds in the main flight routes [Boucher, 1999; Mannstein et al., 1998]. The radiative forcing due to increased cloudiness is believed to be small on
a global
scale,
but could
approach
1 W m
'2 regionally
[Fahey
and Schumann, 1999; Boucher, 1999]. Aircraft exhaust may also alter the optical properties of natural cirrus clouds, but despite growing insight in the early development of the plume in the aircraft wake [e.g. Schumann et al., 1996; Kdircher et al., 1998], the role of aircraft exhaust in modifying cirrus is still an open question.
StrOm and Ohlsson [1998], hereafter S&O addressed this problem and observed that the crystal number density (Nc) is
enhanced about a factor two in cirrus clouds where the soot
content
exceeded
0.0! gg m '3 compared
to cirrus
with less
soot. An elevated soot content was assumed to originate from aircraft exhaust. If the cloud water content (CWC) is not affected by aircraft exhaust, a two-fold increase in Nc would translate into a reduction of the mean crystal size by about 20%. A preliminary study by Wyser and StrOm [1998] suggests that such reduction in crystal size can induce a radiative forcing equal in magnitude to that caused by the contrail cloudiness. A similar conclusion was reached by MeerkOtter et al. [1999].
In this study the data set used by S&O has been extended to
include measurements of the cirrus crystal size distribution,
Nc(d), which makes it possible to explicitly compare the
crystal
size
in perturbed
and
unperturbed
cirrus,
hereafter
Ci*
and Ci respectively.
Experimental
During the AEROCONTRAIL project in October 1996 an
aerosol and cloud microphysical payload was mounted on the
research aircraft Falcon, operated by Deutsches Zentrum fOr
Luff- und Raumfahrt. The objective of the experiment was to
study the evolution of young aircraft plumes, from contrails
into a cirrus-like stage. At times when there was no suitable aircraft to chase, the flights were devoted to characterization of cirrus clouds. The flights were conducted in an air space over southern Germany that is very busy in terms of air traffic.
A PMS Fopsyard Scattering Spectrometer Probe 100 (FSSP-100) [Dye and Baumgardner, 1984] and a PMS 2DC- probe [Knollenberg, 1969] were used to measure the crystal size distribution. The FSSP measures the number density in 15 size classes between 2-32, 2-47 and 5-95 •tm in diameter depending on range setting, which most of the time was 2-47 •tm. Crystals passing the probe area are illuminated by a laser beam and the measured scattered light is inverted to particle size using Mie theory [Gayet et al., 1996a]. The 2DC probe classifies particles in 30 size classes between 12.5-762.5 •tm in diameter. A laser illuminates an array of pixels, which will register the shadow caused by a crystal crossing the laser
beam.
To differentiate between Ci* and Ci, the amount of
absorbing material in the crystals, equivalent to the soot content was determined. The crystals were extracted from the ambient air using a Counterflow Virtual Impactor probe (CVI) [Noone et al., 1988; StrOm et al., 1997] with a lower and upper cut-off size 4.5 and 60 •tm in aerodynamic diameter, respectively. The crystals are evaporated inside the CV! by a warm and dry carrier air stream and the non-volatile
residual particles that are left behind are counted using a
condensation particle counter (CPC), TSI-3760 (TSI, Inc., St Paul, MN). The concentration of absorbing material contained
10 0 i z 10 -4 -- = high soot .... low soot 10 0 10 4 10 2 10 3 d i (•m)
• Institute of Applied Environmental Research, Air Pollution
Laboratory, ITML, Stockholm University, Stockholm, Sweden
2 Laboratoire de MOt6orologie Physique, URA CNRS 267, Universit6
Blaise Pascal, Clermont-Ferrand, France
Copyright 2000 by the American Geophysical Union.
Paper number 1999GL010934. 0094-8276/00/1999GL010934 $05.00
Figure 1. The average crystal size distribution from October
15
th, 1996
for crystals
with high
and low soot
content.
The
crystal diameter is denoted by d and the CWC ranges from 50
to 700 mg-m
-3. Vertical
bars
cover
crystal
number
densities
between
the 10 and 90 percentlie
for Ci*. With a t-test
the
difference
in Nc between
Ci* and
Ci is shown
to be significant
for all bins in the FSSP except the last 2 and in the 2DC the
high soot density is significantly higher for the 4 first bins. 681
682 KRISTENSSON ET AL.: CRYSTAL SIZE 1N CIRRUS CLOUDS NEAR FLIGHT CORRIDORS
-60
- '•":".'•'•"'-•'-
= high
soot'
--
--
8
.. :.½z
..--'.
:,,. ¾::g..
....
-
' "'" ' -.:'5
J'
•-20 . ß .... i- ß •--'"1•0-•
10
o
102
104
cwc (rag
Figure 2. Sca•er plm oft versus CWC for bmh high and low soot data. Black dins •espond to percentlies of CWC in ] 5øC temperature windows which am shifted at 5øC inte•als.
Lines are exponential fits to black data poims.
in the residue particles was measured by a Particle Soot Absorption Photometer (PSAP, Radiance Res., Seattle, WA). The PSAP measures the change in optical transmission caused by residual particles depositing on a filter, and the light source used in the PSAP is 550 nm. The equivalent soot content was calculated using a specific absorption coefficient
10 m
2 g-l. Sample
air in the CVI is enriched
a factor
100
relative to ambient conditions, which results in an effective
detection
limit of the PSAP
instrument
of 0.01 lug
m
-3 at 5
seconds integration time. Finally, a CPC with a lower cut-off at 0.007 pm was connected to a submicrometer inlet facing the opposite flight direction to measure the ambient aerosol number density [SchrOder and StrOm, 1996].
Data reduction
As in the study by S&O, the goal is to investigate the effect
on cirrus by aged exhaust and to exclude the contribution from
fresh contrails. For this reason the aerosol number density and Nc are limited to values below 1500 cm '3 and 30 cm -3
respectively. During the measurements, the FSSP probe was
mounted under one of the wings and the CVI on top of the fuselage and thin or patchy cirrus was sometimes only
observed by one of the two instruments. To exclude these
situations, data was further reduced through the criteria, that
Nc measured by the two probes must exceed 0.05 cm -3
simultaneously. The resulting data from the two instruments is well correlated, although the Nc of the CVI is on an average
50% larger than the FSSP. The exact reason for this is
unknown. However, this is not critical to the analysis in this study, since Nc measured by the CVI is not part of the determination of the crystal size characteristics.
The 4768 remaining data points are grouped according to the amount of absorbing material contained in the crystals. If the equivalent soot concentration observed by the CVI is
below
0.01 [tg m
-3 in the cloud,
the data
points
belong
to the
category
Ci. Otherwise,
the data
belong
to the category
Ci*,
which includes 41% of the cases.
Results
Figure 1 presents an example of an average crystal size distribution observed by the FSSP and 2DC probe on the
flight
15 October
for Ci* and
Ci. Most
crystals
in the cirrus
are in the range of the FSSP between 20-30 lam in diameter.
The instrument shows enhanced Nc in the perturbed case by about a factor 1.5, whereas the two curves for the 2DC probe
show smaller difference.
Note that the measurements of Nc(d) by the PMS probes and the measurements of absorbing material in crystals by the CVI probe are completely independent. There is a concern that the assumption of one residual particle equaling one crystal, used to derive Nc from CVI measurements, is not always
valid and tliat a single
crystal
can give rise to multiple
residuals. This problem is alleged to occur as a result of crystal break up or by insoluble particles sticking on the surface of the crystals. Since this potential sampling problem has no influence on Nc(d) it does not enter the analysis.
However, simply comparing average Nc(d) between the Ci*
and Ci categories may be misleading, because of the limited data set and the large natural variability in cirrus. The large natural variability in the microphysical properties can be seen from the large range in the 10- and 90-percentiles for each size class in Figure 1. Differences in ambient temperature (Ta) and CWC may mask the effect by aircraft exhaust on the mean crystal size. Therefore, we have made an attempt to reduce the influence from these parameters, by analyzing clouds in
separate temperature regimes and specific CWCs.
The CWC was calculated from the Nc(d) using relations given by Gayet eta!., [1996a] for the FSSP probe and Gayet eta!.. [1996b] with particle recognition specified by Darlison and Brown, [ 1988] for the 2DC probe. The contribution from the FSSP and 2DC probe was added together despite the fact that there is a region of overlap (c.f. Figure 1). This is not a
large error, since the contribution from the 2DC probe is much less than the contribution from the FSSP probe in this region,
E 5O •> 20 10
: ?
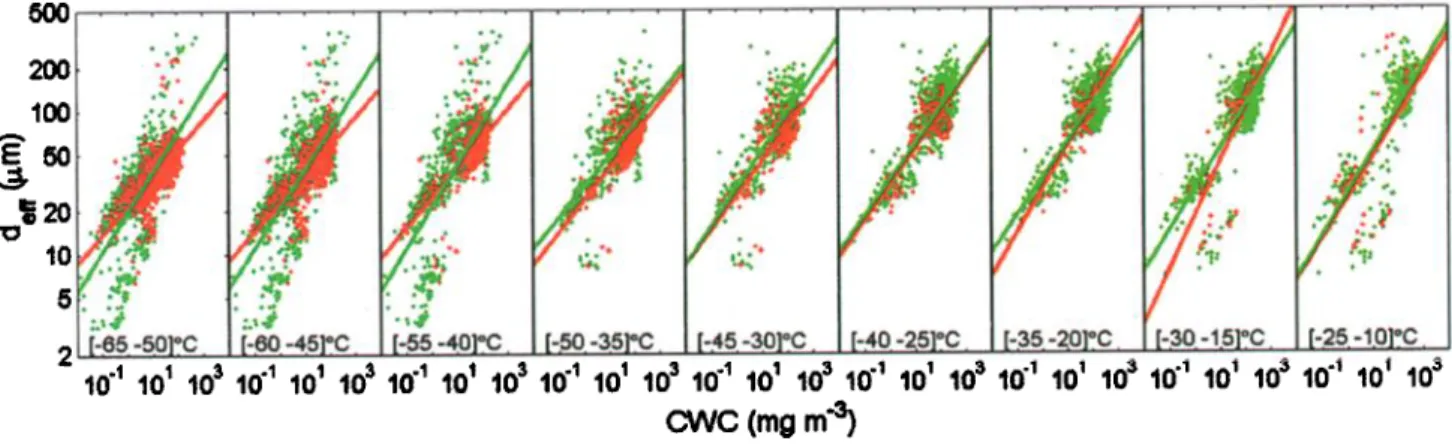
-:.,:j '=.,:j , •[-5•]?c. •.-45•c. 1[-55-40•c. [-5q-3•c, [-•5.-30]•c..F•0-25]•C. [-3[-•0]•C. 0-15]•c. [-25-1•]gC.10
'• 10
• 103
10
'a 10
• 103
10
'1 10
• 103
10
'1 10
• 103
10
'1 10
• 103
10
'• 10
• 103
10
'• 10
• 103
10
'• 10
• 103
10
'• 10
• 103
CWC
(mg
m
'3)
KRISTENSSON ET AL.: CRYSTAL SIZE IN CIRRUS CLOUDS NEAR FLIGHT CORRIDORS 683 -60 •'-50 0•.,• .e -40 •.-30 E • -20 -10 ' 'o = low {oot +-- high soot
,5 percent, ile ,median 95 per,centile
10 20 50 100 200
def
t (pm)
•-4
"
ß
ß
ß ..:
I
I
1
-10 ,5
pe entil,e , m ian ,
,95 rcent!le
0.7 1 1.3 0.7 1 1.3 0.7 I 1.3
dhigh soot/dlow soot
eft '"eft Figure 4. T versus deft. The three relations of deft are derived
from the fitted CWC percentiles in Figure 2 using the relations in Figure 3.
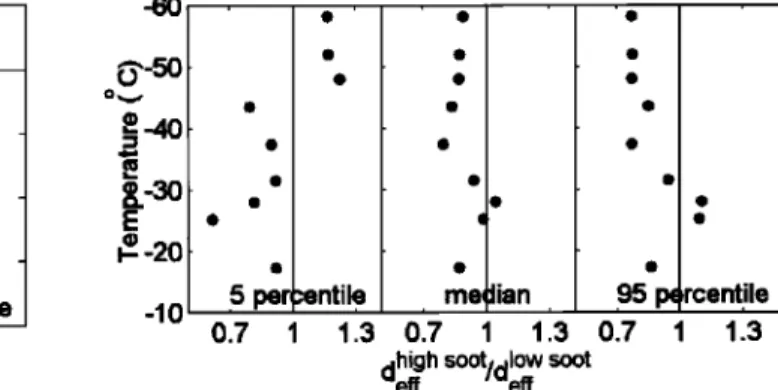
Figure 5. T versus ratio of high to low soot ds. The ratio is
calculated using data presented in Figure 4.
which is probably caused by the irregular shape of crystals
[Gayet et al., 1996a]. Moreover, because the data is treated
the same
way for C i* and
C i any
systematic
error
should
be
canceled when the two cases are compared. For the same reason only crystals smaller than 45 •m diameter were used in the FSSP size distribution when the range setting was 5-95 •m, which comprises 11% of the data points.
A scatter plot between the derived CWC and Ta is presented in Figure 2. As expected, the CWC range over
several orders of magnitude for a given Ta and the maximum CWC decrease with decreasing T•. Values are mostly in the range given in the literature for cirrus [Dowling and Radke, 1990]. Notice that the CWC is calculated for cirrus, although liquid drops may be present at T• above the homogeneous
freezing temperature ca -40øC.
Data
points
for Ci* and
Ci in Figure
2 are
marked
with
red
and green symbols, respectively. Ideally, we would like to
compare these two cases for a given T• and CWC. However, this is not feasible and we need to come up with a way to bin the data. We proceed by calculating the 5-, 50-, and 95- percentile for CWC as a function of T•, using data points for both Ci* and Ci. To avoid that our choice of bin limits affects our results we use a 15øC window that is shifted in steps of 5 ø. This effectively generates a smoothing of the data. Different combinations of interval and step were tried, but this combination gave the best balance between resolution and
scatter. The resulting mean percentiles in CWC for each 15-
degree interval are plotted as filled circles in Figure 2 and a
simple exponential curve is fitted to the data points.
In Figure 3 we present a scatter plot between the effective diameter (deft) and CWC for each temperature interval. deft is
defined as the third moment of Nc(d) divided by the second moment. A curve is fitted to each of the two cirrus types as
shown in Figure 3. Using these relations we can compare deft
for Ci* and
Ci as a function
of Ta
and
CWC
percentile,
which
is presented in Figure 4. For low values of CWC, deft decreases slowly with decreasing T•. For median and high values of CWC the decrease in deft with decreasing T• is more pronounced. However, the most interesting observation is the
systematic
difference
in deft
between
C i* and C i at average
temperatures below-30øC. Table 1 gives absolute values of results presented in Figures 2 and 4. The errors associated with derived parameters such as deft and CWC may exceed 30% [Larsen et al., 1998].
It is the fractional change in deft that more correctly reflects a change in Nc, that was depicted in Figure 1. The ratio between the perturbed and unperturbed deft is consequently
presented
in Figure
5. As seen
in the figure,
deft
in Ci* is
systematically 10 to 30 percent smaller at T• below-30øC for
median and 95 percentile CWC. This is the expected
reduction in size if Nc is enhanced a factor 1.5-3 while
keeping the CWC unchanged. The observed ratio between the crystal number densities ranges from 1.4 to 2.7 in the five
coldest intervals as shown in Table 1. But in the four warmest
intervals the ratio is much less, 0.1-0.6 and no clear trend is
observed for deft. However, Nc is averaged over the bulk of the CWC in each temperature interval. This approach was intentionally avoided in the foregoing analysis, which led to
Table 1. Cirrus
cloud
microphysical
properties
versus
9 temperature
interval
with
widths
15øC
and
a 5øC
step.
N7 is the number
density
of aerosols
larger
than
7nm
and N•/N C the
ratio
of median
crystal
number
density
between
high
and
low
soot
content.
Temp.
Mean CWC
(mg
m
'3)
deft
(pm)
(high/low
soot
content)
No.
of %
data
Median
N
C
interval
temp. 5% Median
95% 5%tile Median 95%tile data points N7
(øC) (øC) tile
tile high low high low high low points
perturbed
(cm
-3) N C
[-65 -50] -58.2 0.412 13.1 82.8 18.0 15.4 35.9 40.3 51.9 67.3 2153 40 342 2.3 [-60-45] -52.0 0.445 23.6 118 19.3 16.5 42.4 48.5 58.3 75.2 1906 42 517 2.7 [-55 -40] -48.0 0.468 32.4 145 20.6 16.8 49.3 56.6 67.1 86.9 1331 39 655 2.2 [-50 -35] 43.5 0.494 44.3 179 19.9 25.0 54.5 65.3 74.6 87.9 1131 33 821 2.1 [-45-30] -37.4 0.531 63.8 232 21.4 23.9 66.5 83.5 90.2 117 639 27 836 1.4 [-40-25] -31.4 0.568 87.0 291 25.4 27.6 89.9 95.7 122 129 988 13 1011 0.6 [-35 -20] -28.0 0.590 102 329 23.1 28.3 109 105 155 141 869 9 1183 0.5 [-30-15] -25.2 0.609 116 361 14.5 23.5 103 104 157 144 838 8 1144 0.6 [-25-10] -17.3 0.662 158 462 20.5 22.3 98.0 113 133 154 483 14 617 0.1 1 2 3 4 5 6 7 8 9 10 11 12 13 14 15
684 KRISTENSSON ET AL.: CRYSTAL SIZE IN CIRRUS CLOUDS NEAR FLIGHT CORRIDORS
the results presented for def•. The values of the crystal density
ratios should therefore be regarded with care.
Discussion and conclusion
Although, we do not understand the mechanism that cause the enhanced Nc, heterogeneous ice nuclei present in sufficient numbers could explain the observations as
suggested by Jensen and Toon [1997]. Since the shit• in the
ratio of the crystal size occurs around -30øC as shown in
Figure 5, it is tempting to interpret this as if the responsible
mechanism depends on the cloud actually glaciating. The presence of super-cooled or liquid clouds is rare at Ta below-30øC, whereas the chance is about 50% to find a
liquid cloud at-15øC [Rogers and Yau, 1989]. At the colder temperatures details in the freezing mechanism determines the
number of crystals formed, but at warmer temperatures heterogeneous nuclei can be the difference between the cloud actually freezing or remaining liquid.
An ice crystal surrounded by water drops will grow quickly
on the expense of the drops. Hence, if freezing is initiated by particles from aircrat• exhaust, the contaminated data points
could be associated with fewer but larger particles at warmer
temperatures. Heterogeneous freezing is known to be temperature dependent and some ice nuclei do not become
active until Ta decreases below a certain threshold value. If this Ta is as low as -30øC for aircrat• exhaust particles, an effect on crystal size at higher % would not be present.
On the other hand, this apparent shit• around -30øC may
be purely coincidental due to the small fraction of data points classified as Ci* in the warmer intervals. As shown by S&O
this fraction closely follows the vertical distribution of the use of aviation fuel. Since temperatures at the preferred flight levels usually are colder than -30øC, the statistics suffer from
the
lack
of data
from
Ci* at higher
temperatures.
Nevertheless, the effect on mean deft as a result of enhanced Nc at cold temperatures is inferred from two independent methods. In this study, Nc is calculated with the crystal size distribution whereas S&O use the residual particle number
density.
The
mechanism
is
still
an
open
?uestion,
but
there
are
really only two possibilities why C would present an enhanced Nc. Either the cloud formed in air affected by aircrat• exhaust nucleates more crystals, or contrails embedded in cirrus seed the cloud with a large number ofsmall crystals. Anyhow, the perturbation affects a significant
fraction of the cloud (c.f. Table 1, column 13), and any
resulting radiative forcing caused by a change in optical
properties has to be added to the forcing from that due to
additional cloudiness. Note that the data presented here
represent diluted plumes away from the direct emission.
The distinction between C i* and C i was based on the amount of absorbing material present in the crystals. With a
more sensitive instrument at hands, more data points would
perhaps
be classified
as Ci*. Since
the study
was
performed
over continental Europe, it is possible that the comparison
between
Ci* and Ci actually
reflect
a varying
degree
of
pollution. Comparing properties with cirrus formed in truly pristine conditions might give a different result, but it would in practice require making observations in the SouthernHemisphere midlatitudes.
Acknowledgments. This work is in pan supported by the European Union through the AEROCONTRAIL project and by the Swedish
Natural Science Council, NFR.
References
Boucher, O., Air traffic may increase cirrus cloudiness, Nature, 397, 30-31, 1999.
Darlison, A. G. and P.R. Brown, The use of automatic particle recognition to improve the determination of bulk quantities from PMS 2-D Probe Data in Cirrus, Proceeding 10th Int. Cloud Physics Conf. Bad Homburg FRG, August 15-20, 1988, 138-140. Dowling, D. R., and L. F. Radke, A Summary of the Physical
Properties of Cirrus Clouds, J. Appl. Meteor., 29, 970-978. Dye, J. E. and D. Baumgardner, Evaluation of the forward scattering
spectrometer probe. Part I: Electronic and optical studies, J. Atmos.
Oceanic Technol., 1,329-344, 1984.
Fahey, D. W., and U. Schumann, Aviation-produced aerosols and cloudiness, Chapter 3 of IPPC, 1999 (to appear).
Gayet, J.-F., G. Febvre and H. Larsen, The Reliability of the PMS
FSSP in the Presence of Small Ice Crystals, J. Atmos. Oceanic Technol., 13, 1300-1301, 1996a.
Gayet, J.-F., G. Febvre, G. Brogniez, H. Chepfer, W. Renger and P. Wendling, Microphysical and Optical Properties of Cirrus and Contrails: Cloud Field Study on 13 October 1989, J. Atmos. Sci.,
53, 126-138, 1996b.
Jensen, E. J. and O. B. Toon, The potential impact of soot particles from aircraft exhaust on cirrus clouds, Geophys. Res. Let., 24,
249-252, 1997.
Knollenberg, R. G., The optical Array: An Alternative to Scattering or
Extinction for Airborne Particle Size Determination, d. Appl. Meteor., 9, 86-103, 1969.
Karcher, B., R. Busen, A. Petzold, F.P. SchrOder, U. Schumann, and
E.J. Jensen, Physicochemistry of aircraft-generated liquid aerosols, soot, and ice particles, 2, Comparison with observations and sensitivity studies, J. Geoph. Res., 103, 17111-17128, 1998. Larsen, H., J.-F. Gayet, G. Febvre, H. Chepfer and G. Brogniez,
Measurement errors in cirrus cloud microphysical properties, Ann. Geophys., 16, 266-276, 1998.
Mannstein, H., R. Meyer, and P. Wendling, Operational detection of
contrails from NOAA-AVHRR-data, Int. J. Remote Sensing, 1999
(in press).
MeerkOtter, R., U. Schumann, D.R. Doelling, P. Minnis, T. Nakajima, and Y. Tsushima, Radiative forcing by contrails, Ann. Geophys,
17, 1080-1094, 1999.
Noone, K. J., J. A. Ogren, J. Heintzenberg, R. J. Charlson and D. S. Covert, Design and Calibration of a Counterflow Virtual Impactor for Sampling of Atmospheric Fog and Cloud Droplets, Aerosol Sci.
Technol., 8, 235-244, 1988.
Rogers, R. R. and M. K. Yau, A Short Course in Cloud Physics, Pergamon Press, Exeter, Great Britain, 1989.
Schumann, U., J. StrOm, R. Busen, R. Baumann, K. Gierens, M. Krautstrunk, F.P. SchrOder, and J. Stingl. In situ observations of
particles in jet aircraft exhausts and contrails for different sulfur containing fuels, d. Geoph. Res. 101, 6853-6869, I996.
SchrOder, F. and J. StrOm, Aircraft measurements of sub micrometer aerosol particles (> 7 nm) in the midlatitude free troposphere and tropopause region, Atmos. Res., 44, 333-356, 1996.
StrOm, J., B. Strauss, F. SchrOder, T. Anderson, J. Heintzenberg, P. Wendling, In-situ observations of microphysical properties of young cirrus clouds, d. Atmos. Sci., 54, 2542-2553, 1997. StrOm, J. and S. Ohlsson, In-situ measurements of enhanced crystal
number densities in cirrus clouds caused by aircraft exhaust, d. Geoph. Res., 103, 11355-11361, 1998.
Wyser, K. and J. StrOm, A possible change in cloud radiative forcing
due to aircraft exhaust, Geophys. Res. Let, 25, 1673-1676, 1998.
A. Kristensson, ITML, Stockholm University, S-106 91
Stockholm, Sweden. (e-mail: adam•itm. su.se)
(Received July 19, 1999; revised October 20, 1999; accepted January 7, 2000.)