Lichter 1 Design and Construction of a Human Powered Vehicle Seating Simulator
for Diagnostic Testing.
by Harry Lichter
SUBMITTED TO THE DEPARTMENT OF MECHANICAL ENGINEERING IN PARTIAL FULFILLMENT OF THE REQUIREMENTS FOR THE DEGREE OF
BACHELOR OF SCIENCE AT THE
MASSACHUSETTS INSTITUTE OF TECHNOLOGY
JUNE 2006
C2006 Harry Lichter. All rights reserved.
The ... _.,, alithnr horhv ornnte -tn MIT nrrnicinn tn rpnrnlpe-- -and to distribute publicly paper -and electronic copies of this thesis document in whole or in part
in any medium now known or hereafter created.
Signature of Author:
4 /7
Certified by:
Department of Mechanical Engineering
7< a / May 9, 2006
/
-Mark Drela v _- Professor of Aeronautics and Astronautics Thesis Supervisor Accepted by:
4
K7ZY
John H. Lienhard VProfessor of Mechanical Engineering Chairman, Undergraduate Thesis Committee
ARCHIVES
I · I
Lichter 2 Design and Construction of a Human Powered Vehicle Seating Simulator
for Diagnostic Testing.
by Harry Lichter
SUBMITTED TO THE DEPARTMENT OF MECHANICAL ENGINEERING ON MAY 9, 2006 in PARTIAL FULFILLMENT OF THE REQUIREMENTS FOR THE
DEGREE OF BACHELOR OF SCIENCE
Abstract:
A seating simulator was built to test the influence of various seating positions on human cycling power output. The simulator measures a rider's physical stress required to produce a certain power output. A heart rate monitor is used to find the rider's physical stress level. The theory is that the best shaped seat will allow the rider to pedal most efficiently. The seat of the simulator can easily be changed by connecting the seat's support strings to a square grid of holes. Mechanical power flows from the simulator's bike pedals through a chain drive to an electric motor. Electrical power flows from the electric motor through a rectifier to a variable bank of resistors.
There were issues which came up involving the bike parts used and the dynamics of the chain drive system. The worst problem was that the supports would flex causing the chain to slacken and resonate under the changing forces of the pedaling motion. First a steel pipe was added to make the system more rigid. Then a sliding copper derailleur was used to allow the chain to stay on up to 213 watts. Finally the copper derailleur was replaced with a bike's derailleur which allows the simulator to operate in excess of 450 watts. Initial tests of several different seat configurations were completed with notable influence on the heart rate of the rider.
Thesis Supervisor: Mark Drela
Lichter 3
Introduction:
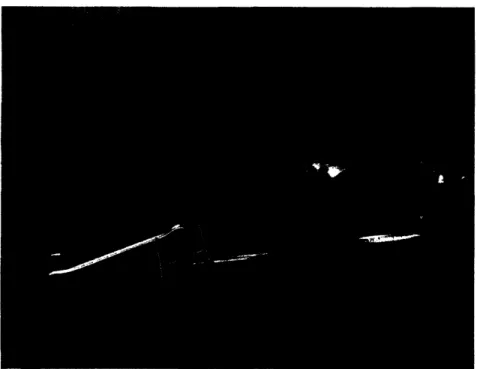
The inspiration for creating this seating simulator came from the MIT Solar Electric Vehicle Team (SEVT) and the MIT Human Powered Vehicle Team (HPVT) teaming up to enter a race that is new to both of them. They will be using the simulator to design a solar assisted bicycle to enter the Solar "BikeRayce" in 2007. Much assistance and resources were supplied by the two teams and the simulator was built in the SEVT shop. More information about the race can be found on the website www.solarbike.org and a picture of past race vehicles can be seen below in figure 1.
.. .'<. ... I ·- .
an:,
.. ,.
210. , ,~,¢~)
Figure 1: Solar BikeRayce USA 2003
The use of a seating simulator can be useful in any human powered vehicle design, especially where aerodynamics are important. The goals of the simulator are: A: to accurately predict the rider's performance, and B: to maximize the rider's
performance. Part A is accomplished by measuring heart rate to find the rider's aerobic threshold. Part B is accomplished by changing the shape of the seat and comparing heart rates for given power outputs.
Lichter 4 There are two sides to this project, the mechanical and the biological. The
mechanical device is the focus of this thesis. The biological testing will be discussed because the test results are the product of the machine, and it is important to understand the biological testing to gauge the value of the results.
Physical Conditioning Theory:
The amount of mechanical energy a person can produce over a certain amount of time is given by the amount of stored energy their body can utilize. The human body can produce energy by either aerobic respiration, which uses oxygen, or anaerobic
respiration, which does not require oxygen but does produce lactic acid. Lactic acid causes a painful burning sensation in the muscles. This project is concerned with aerobic respiration because it is the process used for long periods of time in endurance exercise. The intended race will last roughly 1.5 hours. The capacity of aerobic respiration is limited by oxygen uptake in the lungs and ability of the body's cardiovascular system to
deliver oxygen to the muscles. According to Professor Mark Drela the curve of heart rate to power produced will be linear up to the aerobic threshold. Then it will curve to
approach a maximum heart rate limit. This curve can be found by bicycling at a constant rate and slowly increasing the power while recording heart rate.
The primary test used in sports training is called the V02 max test. This test measures the physical ability of the athlete. The test involves breathing into a mask which measures how much oxygen was converted to C02. During the test heart rate and blood samples are also collected. The equipment to run this full test is cost prohibitive, but there are other means of obtaining similar results such as with a Maximum Heart Rate (MHR).
Lichter 5 "David Swain (1994) and his US based research team using statistical procedures
examined the relationship between %MHR and %V02 Max. Their results led to the following regression equation:
%MHR=0.64 * %V02 Max + 37
The relationship has been shown to hold true across sex, age and activity." (1) This means that the athlete's maximum heart rate is just as valuable a piece of information as the V02 max. The webpage http://www.exrx.net/Testing.html has a detailed explanation of how to conduct a max heart rate test on a bicycle, "increase intensity 25 watts (0.5 Kp) until termination heart rate is reached."(2) There is even a calculator on this page
http://www.exrx.net/Calculators/YMCACycle.html. To make the calculations this test requires heart rate and power for the last two of the three minute stages. The calculator will then use background information of sex, age, and weight to compute your V02 max score from a table of typical values. (3) The V02 max score represents your aerobic threshold. The aerobic threshold can also be found by observing the shape of a graph of heart rate or V02 vs. power output.
Training should be done at a percent of you aerobic threshold dependant on the duration of the race. For instance Professor Dava Newman mentioned during a talk in class 16.00 that in a human powered airplane the cyclist was expected to produce 70% of their aerobic threshold power (P02) for six hours. (4) The V02 max result will simply tell the rider that they should work at a pace of say 140 bpm for the 100 minute race. The only thing to do now is maximize the power that they can produce at that given heart rate.
Lichter 6 The rider's position can affect the efficiency of their effort in two ways. If a poorly designed seat presses the rider's knees up to their chest, they will have difficulty expanding their lungs to gather oxygen. Another danger of a poorly designed seat is that it might require the rider to flex extra muscles to hold their body stable. Flexing extra muscles will take some oxygen away from the muscles that are producing the output power.
The intended use of the seating simulator is for human powered vehicles, which means aerodynamics must also be taken into account. An optimization must be done
between getting the most power out of the rider and decreasing the vehicle's drag. For the Solar BikeRayce aerodynamics are very important, because speeds are expected to reach upwards of 40 mph and only 1/3 of the vehicle's power will be coming from the rider. The other 2/3 power will be coming from charged batteries and the solar panel.
Equipment:
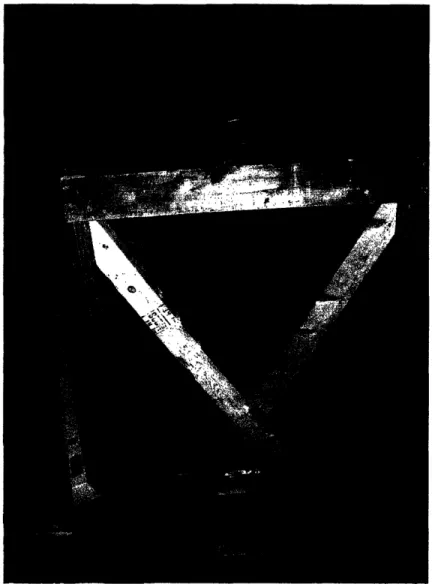
At the heart of this machine is a wooden frame made of 2"x4"s and plywood. There are two main 2"x4" rails 2' apart running down the 8' length of the machine along the ground. These rails are held parallel with multiple 2"x4" and plywood "ladder rungs". All the wooden parts are connected by woodscrews and the metal parts use various bolts. Coming up from the outside of these frame rails are two sheets of 4'x4'x3/4" plywood. This plywood has 3/8" holes drilled on a square grid every 2".The holes are used as attachment points to the seat. There are four pillars used to support the plywood sides, in the rear the pillars are 2"x4"x4' and in the front they are "x4"x4'. There is a 2"x4"
Lichter 7 connecting the tops of the plywood in the rear. There is also a 2"x4" X shape in the rear to provide stability as seen in figure 2 below.
Figure 2: Wooden support frame.
There is a 2"x6" across the top of the plywood in the front to hold the front of the seating area together. This 2"x6" is also where a metronome is attached so the rider can see and hear it. The seating area occupies the rear 4' of the simulator and the front 4' is used for power equipment. This can be seen in the overview shown below.
Lichter 8
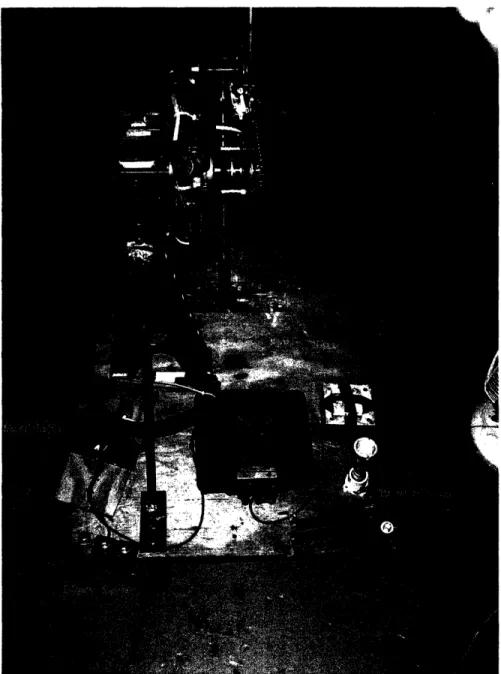
Figure 3: Overview
Strips of Dexion have been screwed down on the tops of the 2"x4" frame rails for the front 4'. Dexion is a steel L shape extrusion approximately 1.5"x3" and full of
premade 3/8" holes and slots. The narrow 1.5" side of the Dexion is attached to the narrow top of the 2"x4" frame rail. The 3" side of these bottom Dexion strips connect to the 3" side of another set of 4' Dexion strips in an upside down L position. Attached to
the top set of Dexion strips is a 3/4" plywood deck, which holds the bike pedals, electric motor, and power electronics. The deck can be slid forwards or backwards along the
Dexion rails to account for the height of the rider. Four 3/8" bolts are used as pins to lock the deck into the desired position. The top two 4' Dexion strips are connected to the 2'x4' plywood deck with three 3/8" bolts each. The deck must be very strong because a large bending moment is placed on it from the interaction of the bike pedals and electric motor. To strengthen the deck a 4'x2"x8" board is screwed and bolted to the bottom of the deck. The deck and Dexion rails have supported three people standing on the deck at once.
Lichter 9
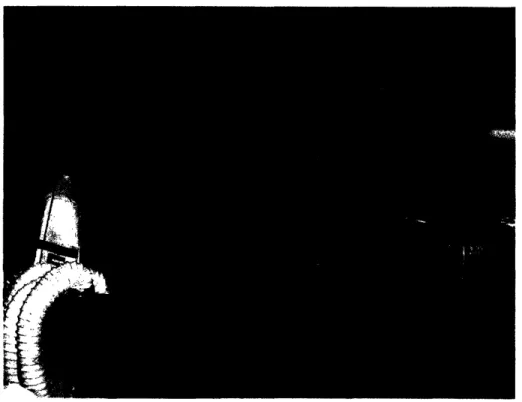
Figure 4: Close up of the deck connections.
The seat is made of a synthetic mesh and suspended by multiple strings. The 20 1/8" diameter strings are sewn onto the mesh seat approximately every two inches. At the end of the strings are steel plates l"x3/8"xl/16" with a 1/8" hole in their centers. The string goes through the hole and is then tied in a knot. These steel "toggles" are pushed lengthwise through the 3/8" holes in the plywood. Then they lay flat against the plywood and support the weight of the rider. By changing the holes the toggles go through the seat can be formed into a wide range of different shapes. The seat spreads out the rider's weight among multiple strings and can easily support a 2901b rider.
Lichter 10
Figure 5: The seat and its connections.
Bike pedals operated by the rider were taken from a junk bicycle. These are just basic pedals with no toe clips or straps of any kind. The bike's down tube and seat tube were cut and are now used to support the bottom bracket and pedals 17" above the deck. The bike's frame tubes were brazed to horizontal 1' strips of Dexion to provide side to side stability for the pedals. The 1' Dexion strips are bolted to the plywood deck with 3/8" bolts. Originally two bolts were used for each strip of Dexion placed near the outside edges for maximum side stability. During a test were the motor was spun then
intentionally shorted, the momentum actually pulled up the middle part of the rear Dexion strip deforming the steel. The steel was reshaped and two more 3/8" bolts were then added to the rear strip of Dexion next to the frame tube in the middle.
Lichter 11
Figure 6: Extra bolts added to the pedal's rear Dexion mount.
The electric motor used was a high efficiency NGM "in wheel" solar car drive motor rated to 10 hp at 120v and three phases. This motor was chosen because it had an accompanying motor controller capable of regeneration. With this motor controller resistance could easily be varied with just a potentiometer. Data such as rpm, voltage, and current could be recorded directly to a computer. Sadly the motor controller intended for this project, despite being in the SEVT shop for over a year, had been borrowed from another Solar Car team. Just as the motor controller was being prepared for use in the
simulator the other Solar Car team came and picked up their motor controller. The NGM motor is still used but it is just running into resistors now instead of charging batteries through the controller. A three phase rectifier is used to bring the output of the motor to DC. The rectifier loses about one volt, with an expected current of about 10 amps this is not a problem. There is a filter capacitor in parallel with the load resistors. The capacitor can do little on the time scale of pedal strokes, fortunately the meters are true RMS, so the capacitor is not required. However. There is a 500 amp 50 mv shunt used to measure
Lichter 12 output current. Voltage meters are used to read the voltage across the shunt and to
monitor the actual voltage output from the rectifier.
Lichter 13 The NGM motor has a machined aluminum mounting bracket which bolts to a machined and welded aluminum stand, which was formerly the trailing arm of a solar car.
The trailing arm holds the motor and is bolted to the deck by two 3/4" bolts. Bolted to the shock mount of the trailing arm is a 1/4" steel plate which is brazed to a 1" steel pipe. The
steel pipe connects to another /4¼" steel pate bolted to the deck by two 3/8" bolts. This steel support completes the third leg to hold the motor firmly to the deck. The NGM motor face has several threaded holes into which three threaded steel rods have been inserted. Bolted to these steel rods is a 1/8" steel plate with a 1.5" steel pipe brazed on and a small bike chain sprocket brazed to that pipe. To center the sprocket on the motor's axis three holes had to be drilled in the steel plate evenly spaced from the sprocket. The angle of the sprocket could then be leveled to the face of the motor by turning the
locknuts holding the steel plate to the threaded rods.
Lichter 14 A bike chain is used to connect the largest sprocket of the pedals to the smallest rear bike sprocket on the motor. The chain tension is adjusted by loosening the bolts connecting the third steel leg of the motor stand to the deck and tipping the motor stand towards the pedals. Shims could be placed under the steel plate if required but it turned out that no shims were required. The chain is firmly held in tension when the steel plate is bolted flat to the deck. Alignment between the motor and the pedals was simply done by careful placement on the deck, but if needed the threaded rods holding the sprocket on the motor could be used for fine tuning.
Equipment Testing:
There were two main discoveries made when testing the simulator. The first discovery was the easiest to fix. Apparently the bicycle was put in backwards. This means that all the threaded parts that were intended to self tighten now self loosen. This includes the bottom bracket and the pedals themselves. These problems are all fixed by simply tightening everything before testing. On test number one by Ben the bottom bracket started unscrewing itself and the test was eventually stopped when the sprocket started rubbing against a steel pipe. The locking ring on the bracket was then tightened and was not a problem any more. On test number two by Ben a pedal actually unscrewed and came off in the beginning of the test, which was then restarted. Again the problem was solved simply by tightening the pedals. When the threads are tight they unable to unscrew on their own. The bike was placed in this orientation to better work with the NGM motor and trailing arm. Using the bike with the sprockets near the rider's left foot meant the NGM motor could be more centered on the deck and better in line with pedals for load bearing while keeping the shock mount available to attach the third steel leg.
Lichter 15 The second discovery was equally serious and more difficult to fix. When loaded the chain will slacken slightly as the pedals and motor flex towards each other. Statically this is fine as the slack part of the chain is on top it only increases the amount of contact with the sprockets. However when a rider pedals at typical rider frequency 60-80 rpm the chain will oscillate vertically. At higher powers the amplitude of these oscillations
increase and can eventually throw the chain off of the small sprocket. The deck was built to take the forces of the estimated 3001bs of chain tension, but even a small amount of deflection is enough to setup the oscillations.
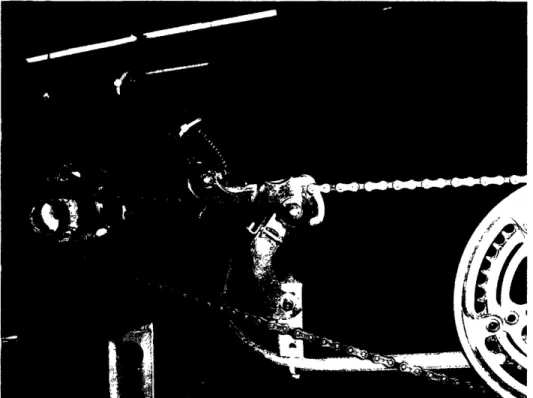
The first solution attempted was a sliding derailleur. This derailleur was not needed as a tensioner or to change gears, but simply to bock the oscillations from building up. A hand held screwdriver was tested first and worked well to block the oscillations. Using this idea a simple derailleur was fabricated from a copper tube zip tied to a steel strap. The steel strap acts like a spring to lightly hold the copper pipe against the chain. The steel strap is bolted to the aluminum motor mount. This copper derailleur helped keep the chain on but was only intended as a temporary solution.
Lichter 16
Figure 9: Improvements made to the drive chain.
The preferred solution would be to stop the movement of the motor and pedals towards each other. So a 1" steel pipe was bent into an S to go around the rider's foot and connect the pedals directly to the motor. The pipe was flattened and bolted to the
aluminum motor mount then brazed to the steel frame tubes of the bike. The addition of this pipe did cut down on movement between the pedals and motor, but there is still some small amount of movement simply from elasticity of the steel in the S shape. With the pipe in place there is about 1/4" of movement between the sprockets at 213 watts and 75 rpm, this is enough to get the chain to come off.
I understand there to be two ways the chain can go slack with the copper derailleur in place. First would be that if there is a spring holding the derailleur against the chain, any violent movements of the chain could kick-up the derailleur enough to get the chain off. The second method would be if a standing wave is setup on the chain, it could be such that the derailleur is located at a nodal point and unable to stop the wave
Lichter 17 from building. This shows the brilliance of the traditional bike derailleur. Two running wheels are placed on either side of the chain and a torsion spring holds them in place. Under large or violent motion the derailleur rotates but the chain does not move much in the direction transverse to the sprocket, so it can not jump off. By using two wheels close together in the bike derailleur it prevents large standing waves from being able to form.
Finally a real bike derailleur was used to replace the sliding copper derailleur. The bike derailleur is held in place by a 1" steel pipe bolted to the motor mount and zip tied to the reinforcing S shaped pipe between the pedals and motor. The zip tie will shortly be
removed and the two pipes brazed together. The zip tie was enough to hold the derailleur in place and keep the chain on for several maximum power tests. A picture of the bike derailleur setup can be seen below.
Lichter 18 Preliminary rider testing of different seat designs was performed using the sliding copper derailleur up to its power threshold. The machine's capabilities were tested with the bike derailleur at a later date.
Testing Procedure:
First the seat to be tested was set up. Then a resting heart rate was taken from the rider. The room temperature was documented. A metronome was played for the rider either at 75 bpm or 150 bpm. During Ben's first two tests it was found that at 75 bpm the rider would favor the leg which the beat fell on, so 150 bpm was used from that point on. The rider would start pedaling and then the clock was started. Every thirty seconds the rider's heart rate was recorded from a Polar brand heart monitor wrist display unit. Every three minutes the electrical resistance was lowered to the next setting. Voltage and
current were noted for reference at each resistance level. The power was stepped up every three minutes until the rider could not proceed or until the necessary data had been taken. Afterwards the seat pin positions were documented and rider feedback was used to modify the shape of the seat for the next test.
Experimental Results:
Figure 11 shows a reproduction of a set of data taken from Ben Glass. The background conditions such as sleep and hydration are not directly controllable but they must be recorded for qualitative comparison between different tests. The seat pin
locations are documented on the grid. The pin locations are required to reproduce the seat shape but do not exactly show the seat shape. The seat is a gently sloping line following a
Lichter 19
best fit curve to those pin locations. The "Deck Gap" is the distance the deck has to be slid away from the front of the seating area to accommodate the height of the rider.
Room Tempurattire 7'1 F
Restinqt Heart Rate 70
Notes no fan wanted
S hours of sleep
Heart Rate
Volts Amps Ohms Watts 0 30 1 00 '1 30 2 00 2 30 3 00 a
28 2 333 12 665 33 98 '100 101 101 100 '00 28 2 8 10 78 4 104 108 103 104 110 106 8 28 4 7 112 111 111 110 113 114 111 8 28 6 6 6 1S66 8 122 128 125 123 127 126 28 7 S36 3 6S7 213.8 139 144 148 150 153 146 8 28 8 842 3 167 247 6 1,60 28 28 28 some cafine drinking Gatoraid
chain slipped off
1 2 3 4 5 6 7 8 9 10 11 12 I x 2 3 3 x-iq x x x x 7 X 8 x 9 XII 10 I 11 X 12 13 ·14 x x '15 x x x x '14I '17 '18 x x 19 20 _
Figure 11: Sample set of recorded data.
Three of these tests were completed with Ben Glass and a fourth test was done with Robyn Allen. The accumulated data can be seen in figure 12 below.
Name Ben Date 1-Ma Trial 2 RPM 75 Deck Gap Chair * 12" 3
Lichter 20 Body Sbmss s. PaR 4 . .. . . .. I IU 160 150 1 140 1 130 120 110 -tIm - Bensedt3 i - Ben seat2 i I+ Ben se 1 I ' P S 31---- - - --l--- -50 70 90 110 130 150 170 190 210 Porer (Wtts)
Figure 12: Comparative plot of preliminary results.
Only one power level is needed to compare seat efficiencies but multiple data points were taken to avoid the end fluctuations. Voltage and Current were not
continuously recorded so if the rider deviates from the pace of the metronome they can sway their results either positively or negatively. For example Ben's last data point in seat 3 has a higher heart rate because he went faster than usual compared to the
metronome. Theory says that these slopes of heart rate should be linear until the aerobic threshold is reached where the heart rate will curve to approach a limit. This confirms that the points in the middle of the graph are probably the most accurate. It looks like Robyn might have been reaching her Aerobic threshold near 160 beats per minute (BPM). No direct comparison should be made between Ben and Robyn because Robyn
Lichter 21 had to slouch in the seat that was not designed for her. From Ben's data it appears seat number two is the best for him.
The above data up to 213 watts is exactly the valuable information that the seating simulator was designed to produce. The bike derailleur was attached after these tests and the simulator was pedaled all the way up to 450 watts at 75 rpm without the chain
slipping off. 450 watts was simply where the rider needed to stop and the simulator with bike derailleur could have gone even higher. No rider seat tests were performed using higher power simply because of rider availability and time constraints. Future testing would be the same as these past results but the power rang might extend to another 50 or 100 watts.
Discussion:
Accuracy will be greatly improved when the voltage outputs of the simulator can be recorded over time by a computer. Currently the limiting factor in the accuracy of the machine is the ability of the rider to stay with the metronome without surging. Once continuous measurements can be recorded and averaged in a computer the power output will be known with great precision. The voltage measuring devices are accurate to several significant digits. The limiting cause of error with continuous measurement would just be fluctuations in the heart rate of the rider. When a tight decision needs to be made between two seat designs, the rider seat tests could just be repeated to increase accuracy.
This project has really uncovered a lot of the engineering behind both chain drive systems and human power output. Power losses in the drive chain should match those experienced by the final human powered vehicle, so they are fine to admit. The energy lost due to the sliding derailleur should be negligible because it is not applying much
Lichter 22 force to the chain. The rolling wheel derailleur will extract a similar and admissible amount of power from the system.
The number one request from riders was that they wanted hand grips to hold onto. A simple addition to the simulator could be movable hand grips that bolt through the 3/8" holes in the walls of the simulator. This would add another layer of complexity to the selection process in the simulator, but it could be valuable for designing the handles on the steering mechanism.
One possible step for going farther might be an accurate simulation of pedaling in a vehicle being kept at a constant speed by an electric motor. Rather than sending the rectified power from the motor to resistors, it could be sent through the rectifier to a large battery. When the rider's speed is below that dictated by the voltage of the battery very little resistance is experienced by the rider. When the rider tries to pedal above the speed dictated by the battery they will start charging the battery and experience high resistance. Power output could be monitored by recording the voltage and current produced from the motor.
SEVT was planning to use a belt drive and no derailleur on their bike. This method works fine for machinery where motors apply a constant force on the belt, but in the vehicle there will be someone pedaling. The calculations should be done to find the resonant frequency of a belt of certain material over a certain distance and make sure that the expected pedal rate is not near resonance, or any multiple of it. Also a couple of rollers could be put on the belt to stop resonant vibrations.
Design of an aerodynamic human powered bike must simultaneously minimize drag and maximize the riders power output. Without knowing this relation SEVT could
Lichter 23 not finalize the design of their new bike, but now they have a machine that will let them find this relationship.
Conclusion:
The seating simulator works brilliantly. There were several obstacles which had to be overcome such as chain resonance. Now all the serious problems have been resolved. The seat is fully configurable for a wide variety of positions. The chain drive is secure up to at least 450 watts. Power measurement is definitive and does not require calibration. Low to medium power rider seat tests were actually performed and produced usable data. The system is now secure enough for maximum heart rate testing as well as general cycling practice. All that is needed now are several dozen tests to find the optimum position for each rider with respect to aerodynamics. The results of the simulator cannot make the rider better, but it will let them achieve their maximum efficiency.
Lichter 24
Acknowledgments
I would like to give many thanks to the MIT Solar Electric Vehicle Team for their help and support on the project.
Thank you to Professor Mark Drela for his valuable insight. Thank you to the first test riders Ben Glass and Robyn Allen.
Works cited
1. http://www.worldar.com/endurance/maxhr.htm. Maximum Heart Rate 2. http://www.exrx.net/Testing.html. ExRx: Fitness Testing
3. http://www.exrx.net/Calculators/YMCACycle.html. ExRx.net YMCA 4. Professor Dava Newman. Lecture to class 16.00 on 4/25/06