HAL Id: hal-01908434
https://hal.archives-ouvertes.fr/hal-01908434
Submitted on 7 Nov 2018
HAL is a multi-disciplinary open access archive for the deposit and dissemination of sci-entific research documents, whether they are pub-lished or not. The documents may come from teaching and research institutions in France or abroad, or from public or private research centers.
L’archive ouverte pluridisciplinaire HAL, est destinée au dépôt et à la diffusion de documents scientifiques de niveau recherche, publiés ou non, émanant des établissements d’enseignement et de recherche français ou étrangers, des laboratoires publics ou privés.
Brigitte Bigi, Christine Meunier
To cite this version:
Brigitte Bigi, Christine Meunier. Automatic Segmentation of Spontaneous Speech. Revista de Estudos da Linguagem , 2018, 26 (4), �10.17851/2237-2083.26.4.1489-1530�. �hal-01908434�
eISSN: 2237-2083
DOI: 10.17851/2237-2083.26.4.1489-1530
Automatic Segmentation of Spontaneous Speech
Segmentação automática da fala espontânea
Brigitte BigiLaboratoire Parole et Langage, CNRS, Aix-Marseille Université, Aix-en-Provence / France
Christine Meunier
Laboratoire Parole et Langage, CNRS, Aix-Marseille Université, Aix-en-Provence / France
Abstract: Most of the time, analyzing the phonetic entities of speech requires the
alignment of the speech recording with its phonetic transcription. However, studies on automatic segmentation have predominantly been carried out on read speech or on prepared speech while spontaneous speech refers to a more informal activity, without any preparation. As a consequence, in spontaneous speech numerous phenomena occur such as hesitations, repetitions, feedback, backchannels, non-standard elisions, reduction phenomena, truncated words, and more generally, non-standard pronunciations. Events like laughter, noises and filled pauses are also very frequent in spontaneous speech. This paper aims to compare read speech and spontaneous speech in order to evaluate the impact of speech style on a speech segmentation task.This paper describes the solution implemented into the SPPAS software tool to automatically perform speech segmentation of read and spontaneous speech. This solution consists mainly in two sorts of things: supporting an Enriched Orthographic Transcription for an optimization of the grapheme-to-phoneme conversion and allowing the forced-alignment of the following events: filled pauses, laughter and noises. Actually, these events represent less than 1 % of the tokens in read speech and about 6 % in spontaneous speech. They occur in a maximum of 3 % of the Inter-Pausal Units of a read speech corpus and from 20 % up to 36 % of the Inter-Pausal Units in the spontaneous speech corpora. The UBPA measure – Unit Boundary Positioning Accuracy, of the proposed forced-alignment
system is 96.09 % accurate as regards read speech and 96.48 % for spontaneous speech with a delta range of 40 ms.
Keywords: spontaneous speech; forced-alignment; paralinguistic events.
Resumo: Na maior parte dos casos, a análise de entidades fonéticas da fala exige o
alinhamento da gravação da fala com sua transcrição fonética. Entretanto, os estudos sobre segmentação automática têm sido predominantemente desenvolvidos com amostras de fala lida ou fala preparada, uma vez que a fala espontânea refere-se a uma atividade mais informal, sem qualquer preparação. Como consequência, na fala espontânea numerosos fenômenos ocorrem, tais como: hesitações, repetições, feedback,
backchannels, elisões não-padrão, fenômenos de redução, palavras truncadas, e mais
comumente, pronúncias não-padrão. Eventos como o riso, ruídos e pausas preenchidas também são muito comuns na fala espontânea. Este artigo objetiva comparar a fala lida e a fala espontânea a fim de avaliar o impacto do estilo de fala numa tarefa de segmentação da fala. O artigo descreve a solução implementada no programa SPPAS para a segmentação automática da fala lida e da fala espontânea. Essa solução consiste de principalmente dois aspectos: suporte para uma Transcrição Ortográfica Enriquecida para a otimização da conversão grafema-para-fonema e permissão para o alinhamento forçado (forced-alignment) dos seguintes eventos: pausas preenchidas, riso e ruídos. Tais eventos representam menos de 1% das ocorrências na fala lida e cerca de 6% na fala espontânea. Eles ocorrem com um máximo de 3% nas Unidades Entre-Pausas de um corpus de fala lida e de 20% a 36% nas Pausas Entre-Unidades de corpora de fala espontânea. As medidas APFU – Acurácia no Posicionamento de Fronteiras de Unidade, do sistema de alinhamento forçado (forced-alignment system) proposto são de 96% de acerto no que diz respeito à fala lida e 96,48% para a fala espontânea, com uma variação delta de 4 ms.
Palavras-chave: fala espontânea; sistema de alinhamento forçado (forced alignment system); eventos paralinguísticos
Submitted on January 9th, 2018
Accepted on March 23rd, 2018
1 Introduction
Speech segmentation is the process of identifying boundaries between speech units in the speech signal and determining when in time these occur. Figure 1 illustrates the full process; a blue arrow refers to a step that can be processed automatically while a black arrow refers to
a manual one. After recording the speech signal, an automatic silence segmentation algorithm creates Inter-Pausal Units (IPUs), orthographic and/or phonetic transcription is then performed, followed by the forced-alignment task, which fixes the time forced-alignment of the sounds with the speech signal.
FIGURE 1 – Automatic speech segmentation: full process A blue arrow indicates an automatic or semi-automatic task
Speech segmentation is important for analyzing correlations between linguistic categories such as words, syllables, or phonemes to the corresponding acoustic signal, articulatory signal, etc. In the past, phonetic studies have mostly been based on limited data. According to current trends, however, phonetic studies are expected to be built on the acoustic analysis of a large quantity of speech data and must be statistically validated. The first step in most acoustic analyses inevitably involves the time alignment of recorded speech sounds with their phonetic annotation. Segmenting and labeling of speech data have to be highly reliable. However, manual segmentation is extremely time-consuming and unlikely to be considered as a possibility if several hours of speech are to be segmented and labeled. Manual alignment has been reported to take between 11 and 30 seconds per phoneme (LEUNG; ZUE, 1984) or taking up to 400 times real time (GODFREY et al., 1992). Manual alignment is too excessively time-consuming, burdensome and expensive to be commonly employed for aligning large corpora. Consequently, automatic speech segmentation is of great help for phoneticians. Knowledge of phoneme boundaries is also necessary for undertaking research on human speech processing. Moreover, research fields such as sociolinguistics and psycholinguistics depend on accurate speech transcription and segmentation at phone-level.
Determining the location of known phonemes is also important for a number of speech applications. When developing an Automatic Speech Recognition system (ASR), a robust context-dependent acoustic model is required. The latter is a statistical representation of sounds, commonly including all the phonemes of a given language and the silence. The model is trained from data sets of examples, i.e. annotated data time aligned with audios, but “good initial estimates … are essential” when training the Gaussian Mixture Model parameters (RABINER; JUANG, 1993, p. 370). Given this context, forced-alignment is the method most commonly used in the creation of the training sets of annotated data for large speech corpora.
One of the other well-known uses of a speech segmentation system is multimedia indexing: it is necessary to provide an efficient methodology for the indexing of multimedia data for further retrieval. There is a need to index audio-video materials, and speech recognition can be used to create searchable transcripts for audio indexing in digital video libraries. Many systems have been reported in the literature; for
instance, to name but one, Moreno et al. (1998) proposed a recursive algorithm to perform speech segmentation for indexing long audio files. The main difference between aligning for indexing and aligning for acoustic analyses is related to precision threshold: if an offset of 2 seconds is acceptable for indexing, it is inconceivable for acoustic analysis purposes. An acceptable offset for acoustic purposes would be up to 80 ms.
Against this background, depending on the final application of the task, the system has to face different difficulties like live-audio alignment (vs batch alignment), which is done on live audio recordings and requires the aligner to manage run-time memory dynamically; like an inaccurate orthographic transcription which implies for the aligner to be designed in such a way that it can correct such erroneous points; like long audio files, which implies using strategies to manage the large amount of data; like when a high accuracy is expected for the further analyses.
The current state-of-the-art in Computational Linguistics allows many annotation tasks to be semi or fully-automated. Several toolboxes are currently available which can be used to automate the tasks (the blue ones in Figure 1). For a researcher looking for such automatic annotations, it is difficult to evaluate their usefulness and usability. Some are mainly dedicated to Computer Scientists and some are designed for Linguists. To decide about their usefulness and usability, the following have to be considered: the license, the ease of use, the type of data the tool is designed for, the supported languages or the possibility of adding a new one, and its compatibility with other annotated data. Before using any automatic annotation tool/software, it is also important to consider its error rate and how those errors can affect whatever further purpose the annotated corpora are used for. In fact, the error rate may significantly increase if the data, on which the system was trained, significantly differs from the new data to be processed. Then, another issue an automatic annotation system has to face is to consider the different types of data, particularly those related to speech style.
Shriberg (2005) has identified “four fundamental properties of spontaneous speech that present challenges for spoken language applications”: recovering hidden punctuation, coping with disfluencies, allowing for realistic turn-taking, hearing more than words. In the context of speech segmentation, the main problem among this list is to cope with disfluencies, e.g. repetitions, repairs, hesitations, etc. Shriberg
(1996) also showed that disfluencies are not ‘noise’ in speech “but rather show systematic distributions in various dimensions”. She examined filled pauses, repetitions, substitutions, insertions, deletions and speech errors, and observed that except filled pauses, they are all correlated with characteristics of the speech produced. Filled pauses however are correlated with socio-linguistic variable. Clark et al. (2002) re-considered the status of the English uh and um, commonly defined “filled pauses”, e.g. the audible counterparts to silent pauses, and argue that they are “words – interjections, with all the properties that this implies”. From the phonetic point of view, Shriberg (1999) examined the filled pauses, repetitions, repairs and false starts and concluded that they affect several phonetic aspects of speech. She observed changes in “segment durations, intonation, word completion, voice quality, vowel quality, and coarticulation patterns”. It mainly concerns the first two regions of the disfluency, i.e. the ones whose can be “removed to yield a fluent version of the utterance” (the reparandum and the repair). Other studies proved that the pronunciation of the as “thee” was strongly correlated with disfluent contexts, when followed by a filled pause, a pause or a repetition (TREE; CLARK, 1997). The same trend has been observed in other function words (e.g. to and a) with similar pronunciation alternations (BELL et al., 2003). Most of these aspects can have an impact on speech segmentation for both the grapheme-to-phoneme and the alignment tasks.
This paper aims to highlight the differences between read speech and spontaneous speech given the specific context of the automatic speech segmentation task. It first focuses on the speech characteristics mainly related to different speech styles. Then some existing solutions to automate the speech segmentation task are presented. The paper describes several French corpora whose segmentation demand automatic speech segmentation systems particularly adapted to spontaneous speech. Finally, quantitative and qualitative results are given for the forced-alignment task.
2 Spontaneous speech
Since the end of the 20th century, studies on speech production have moved toward the analysis of more consequent corpora. Linguists used to build their own corpora, which were more generally limited in size (containing isolated words or short sentences). The apparition
of consequent corpora is due, for the most part, to the need for wider data in order to evaluate speech tools provided by automatic processing researches. Consequent corpora most generally contain more natural speech (recordings of Broadcast News, interviews, etc.) than what linguists have used for previous analysis. At the same time speech tools allowing automatic speech analyses were developed. This led linguists to analyze these consequent speech data. However, the exploitation and analyses of more casual speech raised new challenges both for linguists and for automatic speech evaluation. Indeed, the nature of casual speech is characterized by many specificities that do not appear in controlled speech.
Speech sounds produced in unconnected and prepared speech are quite easy to identify and describe. In this case, speech production is characterized by slow speech rate and speech variation is quite limited. On the other hand, speech extracted from natural and casual situations is characterized by rapid but also irregular speech rates, word truncations and phoneme reductions (JOHNSON, 2004), etc. Indeed, spontaneous speech is produced within a dynamic communicative situation. This dynamic situation involves linguistic routines and constraints, which lead to a reorganization of sound production, and then to massive variation. These characteristics result in high difficulties when speech flow has to be annotated in discrete phonetic units.
In particular, speech reduction has been of special interest since studies on spontaneous speech have become more common. It has been shown that the amount of reduction in spontaneous speech is greater than expected (JOHNSON, 2004). Different speaking styles may provide various amounts of reduction phenomena, depending on the degree of control in speech. A significant difficulty for automatic alignment tools is that reduction is not systematic to one phoneme discrete deletion. Indeed, several studies (ADDA-DECKER et al., 2008; MEUNIER, 2013) have shown that, quite often, phoneme reduction results in phoneme coalescence (several phonemes are merged into one segment, Figure 2). These instances are quite frequent and are generally not perceived by transcribers. Consequently, perceived phonemes are aligned on speech signal as discrete phonetic units (Figure 2).
FIGURE 2 – Automatic alignment of the sequence “tu vois, il devait avoir” (you know, he should have). The effective realization shows that several
phonemes are merged within one segment.
Moreover, casual speech is characterized by several elements, which do not appear in controlled or read speech. In particular, laughter, coughing, mouth noises, etc. appear very frequently in conversation. Several studies (OGDEN, 2001) point that clicks, for example, are used in a linguistic way in order to structure oral discourse. These elements do not belong to phonological language inventories. However, they are present in casual speech and automatic tools have to identify them in order to provide correct phonetic alignment.
One of the problems considering spontaneous speech is that read speech and spontaneous speech show major differences (ROUAS et al., 2010).Indeed, the difference between a highly controlled corpus such as a read and isolated word on the one hand, and very relaxed conversation on the other hand, is also materialized by several varieties of speech types that provide specific characteristics. Variations are also found within the same style due to conditioning factors such as: the social situation, the degree of preparation, the number of interlocutors, etc. In other words, the number of reductions, repetitions and other linguistic phenomena in speech productions may vary according to the degree of control that the situation requires.
3 Automatic speech segmentation
Speech segmentation can be divided into two task categories. In the first category, the system must deal with data where transcriptions are approximate, which means that errors and omissions in the transcription are frequent. The ALISA system, for example, is dedicated to this category
(STAN et al., 2016); it can align speech with imperfect transcripts in any alphabetic language. Another example is JTrans, a system performing speech segmentation on very long audio files (CERISARA et al., 2009). These systems are mainly dedicated to other automatic analyses like ASR, automatic indexation, etc. In the second category, the system requires performant and accurate orthographic or phonetic transcripts in order to produce the best alignment possible. This kind of system is mainly dedicated to linguists. This paper focuses on the second category, in order to create a system with high accuracy- or at least high enough accuracy for both read speech and spontaneous speech in further studies in Phonetics and Prosody. Segmenting at the phonetic level is required in particular for the extraction of parameters such as duration, fundamental frequency or intensity within each phoneme.
Any automatic speech segmentation system requires knowledge about the language to be recognized. Such resources should define the linguistic property of the target language: recognition unit and audio properties of each unit. Typically, a unit is a word, and the following must be available for the system to work:
– a lexicon of the target language that defines the words to be recognized;
– a word dictionary, i.e. their pronunciation as a sequence of phonemes including pronunciation variants or not;
– an acoustic model, i.e. a stochastic model of input waveform patterns per phoneme. Systems can be based on the use of various types of models, including the well-known Hidden Markov Models (HMM). Hand-transcribed speech training data are required to build a highly accurate acoustic model.
The lexicon and the word dictionary constitute the linguistic resources necessary to perform the automatic phonetic transcription task, and the acoustic model is required for the automatic phonetic alignment task.
3.1 Automatic phonetic transcription
In the initial stage, the automatic system converts to the given orthography into a sequence of phonemes; this task is named
“grapheme-to-phoneme” in Figure 1. It implies two sub-tasks for the system. Firstly, the given orthographic transcription is normalized into units. Secondly, the units are converted into a sequence of phonemes with or without pronunciation variants. This phonetization can be performed either by a set of pronunciation rules or can be based on a pronunciation dictionary. The availability of these systems to support spontaneous speech implies coping with all the speech phenomena described in section 2. For example, the phonetization system must include a solution for generating the pronunciation of missing words like broken words, regional words, mispronunciations, it has to be able to deal with pronunciation variants, and in general with any kind of disfluency.
To deal with speech variability, the system can add alternative expected phonetic segments so that it lets the automatic alignment choose the best option. This grapheme-to-phoneme conversion assumes that it can generate a result that contains the correct pronunciation. However, casual speech is highly variable. Numerous studies have investigated the automation of pronunciation variations. Statistical decision trees to generate alternate word pronunciations were used in (RILEY et al., 1999). A phonetic-feature-based prediction model is presented in (BATES et
al., 2007). Recently, (LIVESCU et al., 2016) proposed an “approach of
modeling pronunciation variation in terms of the time course of multiple sub-phonetic features”.
In previous works (BIGI, 2014, 2016), we proposed a multilingual text normalization system and a multilingual phonetization system. The methods are designed to be as language-and-task-independent as possible: this makes it possible to add new languages with a significant time-reduction compared to the entire development of such tools. The approach is also relevant to the present study because it functions indifferently with any kind of speech style. The system supports an Enriched Orthographic Transcription (EOT), which allows the transcriber to include the following:
– a broken word is noted with a ‘-’ at the end of the token string; – a noise is noted ‘*’; it can be a breath, a cough or an unintelligible
segment, ...
– laughter is noted by a ‘@’; – a short pause is noted by a ‘+’;
– an elision is mentioned between parenthesis, like thi(s);
– an unexpected pronunciation is noted with brackets like this [example, eczap];
– a comment of the transcriber is noted with braces or brackets like {this comment} or [this other comment];
– an unexpected liaison is surrounded by ‘=’;
– a morphological variant is noted like this <ice scream, I scream>, – a proper noun may be surrounded by ‘$’ symbols like $ Alan
Turing $;
– regular punctuation and character case are accepted.
The system does not require all these phenomena to be mentioned in order to work; nevertheless, this specific convention makes it possible to annotate all perceivable disfluencies. The user can thus integrate the degree of enrichment he requires into the transcription.
When these speech phenomena are mentioned in the manual orthographic transcription, it significantly increases the result of the grapheme-to-phoneme conversion (BIGI et al., 2012), either by using a rule-based system or a dictionary-based system. On the basis of a standard orthographic transcription, the dictionary-based system results in 10.8 % errors on read speech up to 14.5 % on conversational speech. By using the proposed enrichments of the orthographic transcription, errors were significantly reduced to 8.2 % on read speech and 9.5 % on conversational speech. So this multilingual approach of automatic phonetization performs well and very accurately for different types of speech. Furthermore, the EOT associated with the appropriate automatic systems can help in tackling the problems of the grapheme-to-phoneme conversion on various types of data. For example, Figure 3 illustrates the use of the enrichment to transcribe (tier Transcription), normalize (tiers Tokens, Tokens-Std), phonetize and time-align (tiers PhonAlign,
TokensAlign) a Spanish native speaker while reading an English text.
The automatic text normalization, phonetization and alignment were performed firstly on the standard version and secondly on the modified one, both automatically extracted from the EOT.
FIGURE 3 – Example of enriched orthographic transcription and automatic speech segmentation on read speech by a learner speaker
The approach based on EOT improves the accuracy of the speech segmentation result for the grapheme-to-phoneme conversion and consequently for the forced-alignment; and it opens research opportunities for Linguists. However, the enrichment of the transcription is time consuming for the user. One way to speed up the process is to add the most frequent reductions into the pronunciation dictionary. For example, in French, the word “parce que” p-a-R-s-k (because) is often
pronounced p-s-k, or a pronoun like “tu” t-y (you) is pronounced t. But
adding them into a pronunciation dictionary supposes that such frequent reductions were previously identified.
Frequent reductions can be detected automatically as proposed in (SCHUPPLER et al., 2008): a lexicon of canonical phonemic representations of the words was used in a first stage and a second experiment was carried out with a lexicon that had been enriched with pronunciation variants. “These variants were generated by applying reduction rules to the canonical transcriptions of the words”, thanks to a forced-alignment system. Alternatively (or additionally), the EOT can be a way to identify and to add the frequent pronunciation variants to the dictionary manually (MEUNIER, 2012).
Finally, a reasonable level of orthographic enrichment has to be determined. On the one hand, as it has been said, enrichment of transcription is time-consuming work. On the other hand, human cannot hear very fine variations or reductions so that many segmental variations and reductions cannot be transcribed. As a result, orthographic transcription should be enriched by uncommon variations easy to identify by with a simple transcription code; and the automatic speech
segmentation system has to identify the most common variations, for instance, “tu vois” (you see) often pronounced t-y-w-a, with /v/ deleted. 3.2 Automatic phonetic alignment
While a phonetic transcription is available, a forced-alignment system has to be implemented in order to estimate where the sounds are located in the acoustic signal. For that specific purpose, Automatic Speech Recognition engines are useful. Any ASR system can perform automatic forced-alignment. The task is named “forced-alignment” because the phoneme alignment is obtained by forcing the ASR result to be the given phonetic sequence. A language model or a grammar has to be given to the ASR system to fix constraints of the sequence of phonemes, it can eventually include pronunciation variants, i.e. several possible paths to the ASR result like the example of Figure 4.
FIGURE 4 – Example of representation of a grammar for the forced-alignment task: the English sequence “the identity”. The word “the” can be phonetized into 3 different
sequences of phonemes and the word “identity” into 4.
There are several cross-platform toolkits for building a recognition system. Notable among these are: HTK – Hidden Markov Model Toolkit (YOUNG; YOUNG, 1993), CMU Sphinx (LAMERE et al., 2003), Open-Source Large Vocabulary CSR Engine Julius (LEE et al., 2001), RASR (RYBACH et al., 2009) and Kaldi (POVEY et al., 2011). Among this list, HTK, RASR and Kaldi have to be compiled to prepare for their intended use. These systems are open-sources but HTK and RASR require users
to register and the HTK license precludes distribution or sub-licensing to third parties. These systems are distributed as toolboxes and can be used only by means of the command-line interface; they require knowledge and skill about speech processing.
In order to facilitate their use, a large number of wrappers have been developed, although, they all require an aligner to be previously installed. They make it possible to automatically time-align speech in an easier way than the direct use of the ASR system. Additionally, some of them include several features like training an acoustic model, estimating statistical distributions of annotated data or performing requests for data, etc. Table 1 reports the main characteristics of these existing wrappers. It includes Train&Align (BROGNAUX et al., 2012), P2FA (YUAN; LIBERMAN, 2008), Prosodylab-Aligner (GORMAN et al., 2011), The Munich Automatic Segmentation System MAUS web service (KISLER
et al., 2017), PraatAlign (LUBBERS; TORREIRA, 2016), and SPPAS
(BIGI, 2015). This table does not present a fully comprehensive list and is restricted to the freely available tools whose developers can be contacted. It has to be noted that most of the systems use a specific representation of phonemes, except SPPAS in which phonemes are represented in X-SAMPA and a plugin makes conversion into the International Phonetic Alphabet possible.
The first column of Table 1 is the name of the wrapper. The interface column mentions the way the system communicates with users: CLI for a Command-line User Interface, GUI for a Graphical User Interface and Web for a web service. The third column refers to the list of languages the system is able to deal with: it means that acoustic models are included in the wrapper. The quality of such models correlates strongly with the data used for the training and it is possible that it doesn’t match with the new data to be processed. Some of the systems are not provided with acoustic models and/or propose to train the model directly from the data to be aligned; but this supposes that there is enough of such data. The fourth column indicates what the ASR system the wrapper is based on. The next column lists the operating systems, except in the case of a web service. The last column indicates the list of file formats the wrapping system is able to cope with, without distinguishing inputs/ outputs for reasons of clarity.
It should be noted that with the same acoustic model and the same aligner, the wrappers should produce the same phoneme alignment result.
For example, we would expect WebMAUS to produce the same results as PraatAlign because the acoustic models included in the former were picked up by the latter. Depending on its licensing condition, it is then feasible for an acoustic model of a wrapper to be included in and used by another one: it is then not scientifically relevant to directly compare alignment results of wrappers.
TABLE 1 – Some alignment wrappers freely available on the Internet
Wrapper
name Interface Language Aligner Operatingsystem File format
Train&Align Web - HTK - txt
P2FA CLI eng HTK Windows
Linux MacOS
json, textgrid
Prosodylab-Aligner CLI eng HTK WindowsLinux
MacOS
txt, textgrid
WebMAUS Web 28+ HTK - txt, textgrid, par,
xml, csv
PraatAlign GUI spa, nld HTK Windows
Linux MacOS
textgrid
SPPAS CLI
GUI eng, fra, spa, ita, cat, pol, yue, jpn, nan, pcm, cmn, (kor), (por) Julius HTK WindowsMacOS Linux txt, textgrid, trs, eaf, tdf, lab, antx, csv, ctm, stm, sub, srt, anvil, mrk, xra Finally, anyone who has automatic alignment to perform can easily access these systems and choose the most appropriate one depending on his/her own needs: the interface, the supported language, the aligner that has to be previously installed, the input/output file format, etc. All of these forced-alignment systems are capable of achieving acceptable results on the alignment of read speech.
However, despite the availability of numerous systems, the alignment of spontaneous speech remains a challenging task: previous
work to improve the accuracy of the phoneme boundaries for spontaneous speech is sparse. Among the above-mentioned systems, our system (SPPAS) is the only one to bring forward a full solution to this issue: The next sections state the reasoning behind the development of this solution and describe its implementation and accuracy.
4 Collected corpora
In order to compare automatic speech segmentation of read speech and spontaneous speech, we conducted an inventory then a selection of some existing data. We picked out French data so that they constitute as far as possible two homogeneous sets: read and spontaneous speech. All the selected corpora were recorded in an attenuated-sound booth with one microphone per speaker. Each audio signal was automatically segmented into IPUs - Inter-Pausal Units that are segments of speech surrounded by silent pauses over 200 ms, and time-aligned on the speech signal. The IPUs boundaries were all manually checked. For each of the speakers an orthographic transliteration was then provided. The transcription process followed the specific convention described in section 3. However, the extent of the enrichment depends on the corpus, but in all corpora, the following are mentioned: filled pauses, laughter, noises, disfluencies (repetitions, broken words, etc), unusual pronunciations and short pauses. The main difference between the enrichment of the transcription concerns the amount of elisions. Finally, for this study, we normalized all the corpora with the same version of our text normalization system, and we phonetized with our phonetizer (see section 3). We then expected to achieve the best possible uniformity of the data: the only thing that differed was the speech style.
Table 2 summarizes the corpora that were gathered for the present study. The first column indicates the name of the corpus. The second column refers to the manual transcription available, i.e. one or several between:
a. both phonetized and time-aligned; b. a standard orthographic transcription; c. an enriched orthographic transcription.
It was also expected that these transcriptions be double-checked. Unfortunately, this was not the case for AixMapTask. The third column indicates the duration of spoken segments, excluding the duration of silences; and below is the number of speakers. The last column indicates the speech style. For some corpora, only a part of the corpus was extracted to ensure that all the above-mentioned criteria were respected.
TABLE 2 – Description of the corpora
Corpus name Transcription durationSpeech
Nb speakers Speech style Data collected locally
(audio) Time-alignedPhonetized, 2 spks2 min (words/sentences)Reading
Europe (audio) Phonetized, Time-aligned, Enriched ortho. 33 min
6 spks (radio broadcast)Political debate
Eurom1
(audio) Standard ortho. 10 spks28 min (5 paragraphs)Reading
AixOx
(audio) Enriched ortho. 110 min10 spks (10 paragraphs)Reading
Typaloc
(audio) Enriched ortho. 19 spks32 min Reading(2 texts)
Typaloc
(audio) Enriched ortho. 39 min4 spks Conversation(interview)
AixMapTask
(audio-video) Enriched ortho. 163 min10 spks (task-oriented)Conversation
CID
(audio-video) Enriched ortho. 7h30min16 spks (casual dialog)Conversation
Cheese
(audio-video) Enriched ortho. 63 min8 spks
Reading a joke; Conversation (casual dialog)
Europe corpus (PORTES, 2004) is a debate recorded from a radio
broadcast. It involves two journalists and four invited speakers debating on the European Union and particularly on its frontiers.
A part of the French Eurom1 corpus was extracted. It consists in “40 passages made of five thematically linked sentences, showing a coherent semantic structure so as to induce a correct prosodic structure at each sentence level” (CHAN et al., 1995).
AixOx (HERMENT et al., 2014) replicates Eurom1 with a larger
number of speakers and texts to read: 40 paragraphs are read by 10 speakers.
TYPALOC (MEUNIER et al., 2016) is composed by several
corpora of reading (words and texts) and spontaneous speech (interviews) produced by healthy speakers and by patients affected by different types of dysarthria. The healthy speakers selected for this study read two short texts and had a free discussion (8-17 min) with an experimenter who invited them to tell some stories from their own life.
The audio-visual condition of Aix Map Task is a corpus of audio and video recordings of task-oriented dialogues (GORISH et al., 2014). The experimental design follows the standard rules of Map Task experiments: participants were allowed to say anything necessary to accomplish their communicative goals. In this face-to-face condition, the two participants could see each other.
Corpus of Interactional Data - CID (BERTRAND et al., 2008) is
an audio-video recording of 8 dialogs involving two participants, 1 hour of recording per session. One of the following two topics of conversation was suggested to participants: conflicts in their professional environment or funny situations in which participants may have found themselves.
Cheese (PRIEGO-VALVERDE; BIGI, 2016) is also an
audio-video recording of dialogs involving two participants. They had received the task to read each other a canned joke chosen by the experimenters, and then to converse as freely as they wished to for the rest of the interaction. Figure 5 illustrates the recording conditions of the audio-visual corpora.
5 Corpora distributions
5.1 Distribution of tokens
Tables 3 and 4 indicate the number of tokens of each corpus for read speech and spontaneous speech respectively. Any speech production is considered as a token: a word, an interjection, a feedback, etc. The tables also indicate the amount of some events, limited to the 3 following categories:
1. The filled pause. In French, the filled pause has a standard spelling (“euh”); it is then uniformly transcribed in corpora and easy to identify automatically.
2. Laughter. They are manually indicated in the orthographic transcription by the ‘@’ symbol.
3. Other events are all named under the generic term “noise”. They can be breathing in or out, coughs, or any kind of noise in the microphone that is produced by the speaker. They are manually indicated in the orthographic transcription by the ‘*’ symbol. The recording of such noises depends highly on the quality and the position of the microphone. Thus, drawing conclusions on the differences between noises in the corpora should be avoided.
TABLE 3 – Tokens and paralinguistic events in read speech
Corpus of tokensNumber filled pause% of laughter% of noise% of
AixOx 28,408 0.014 % 0 % 0.134 %
Eurom1 6,912 0 % 0.014 % 0 %
Cheese
(read part only) 1,086 0.092 % 0.829 % 0.184 %
Typaloc
TABLE 4 – Tokens and events in spontaneous speech
Corpus of tokensNumber filled pause% of laughter% of % of noise
Europe 7,566 6.014 % 0.013 % 0.264 %
Typaloc 7,534 2.933 % 0.186 % 1.434 %
AixMapTask 37,979 2.285 % 0.635 % 2.607 %
CID 126,260 3.997 % 1.221 % 0.870 %
Cheese 16,829 2.793 % 2.246 % 0.434 %
These tables obviously highlight the fact that the selected events are much less frequent in read speech than in spontaneous speech. The majority of such events in read speech (less than 1 %) concerns laughter in Cheese, probably because the speakers were reading a joke. Table 4 shows that the amount of events is differently distributed according to the data. All the corpora of spontaneous speech contain a high percentage of filled pauses, ranging from 2.3 % up to 6 %. Actually, the Europe corpus contains a significantly higher amount of filled pauses than the others, which is not surprising for a political debate on the radio; and for the same reason, this debate contains only one example of laughter. On the contrary, the casual conversations contain more laughter. The interviews and the map-task contain a more reasonable amount of laughter probably because during the recording both interviewees or participants have to complete a task.
The distribution of tokens through the overall corpora shows a surprising regularity. Indeed, when selecting the ten most frequent words in the corpora, the four function words “de” (of), “la” (the), “et” (and), “le” (the) are present, except in Cheese. These four words are highly frequent in spontaneous speech as well as in read speech. This suggests that they are essential in order to structure and construct oral speech. Other words appear frequently according to the characteristics of each corpus. For example, “est” (is) is systematically present in the
inventory of frequent words in spontaneous corpora, but is absent from read corpora one. The feedback marker “ouais” (yeah) is also ranked at the 4th or 5th position in MapTaskAix, CID and Cheese.
In all the spontaneous corpora, noise and laughter are not in the ten most frequent tokens, except laughter, which is at the 5th position in
Cheese. The filled pause is included in the five most frequent tokens; and
in all but Europe and CID, it is the most frequent token. 5.2 Filled pause, laughter and noise events
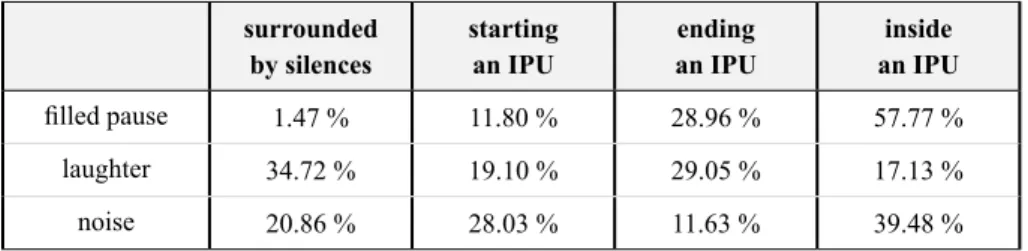
In the context of speech segmentation, the challenge of many events is not so much their grapheme-to-phoneme conversion but lies rather in their time-alignment on the acoustic signal. It is important then to determine where these events are located relative to speech. The first column of Table 5 indicates how the percentages of times such events are surrounded by silences, i.e. they are the unique token of the IPU. In this situation, the automatic forced-alignment is not involved because segmentation had already been accomplished at the first stage of the process (by the IPUs segmentation task). All 3 of the other columns are related to a situation in which they have to be segmented by the forced-alignment system:
1. when the event starts with an IPU, the alignment system has to fix the boundary between the event and the next sound;
2. when the event ends with an IPU, the alignment system has to fix the boundary between the last sound of the IPU and the event; 3. when the event is inside an IPU, i.e. the paralinguistic event is
surrounded by speech and/or another event so that the alignment system has to fix the starting and ending boundaries of the event. Table 5 clearly indicates that the filled pauses occur close to speech, 98.53 % of their items start are inside or end an IPU. To a lesser extent, we observe that laughter items and noises are also close to speech. This table clearly highlights the need for the automatic speech segmentation system able to handle these events.
TABLE 5 – Percentage of the events depending on their left and right context
surrounded
by silences starting an IPU an IPUending an IPUinside
filled pause 1.47 % 11.80 % 28.96 % 57.77 %
laughter 34.72 % 19.10 % 29.05 % 17.13 %
noise 20.86 % 28.03 % 11.63 % 39.48 %
Moreover, the forced-alignment task performs an optimization algorithm on the whole IPU so that a misalignment of a sound necessarily has consequences on the closest sounds or even further. Table 6 indicates the amount of IPUs of the corpus and the percentage of these IPUs that are concerned by the selected events. In read speech, they are observed in a maximum of 3.32 % of the IPUs (Cheese corpus). However, 20 % up to 36 % of the IPUs include at least one of the events we have identified.
TABLE 6 – Amount of IPUs in which the events are occurring
Corpus # totalIPUs filled pauseIPUS with IPUs withlaughter IPUs withnoise IPUs withany event
AixOx (read) 2,724 0.15 % 0 1.28 % 1.40 % Cheese (read) 241 0.41 % 3.32 % 0.83 % 3.32 % Europe (spont) 875 35.88 % 0.11 % 2.29 % 35.89 % Typaloc (spont) 522 28.25 % 2.68 % 14.94 % 35.82 % AixMapTask (spont) 6,126 12.16 % 3.67 % 13.52 % 20.60 % CID (spont) 13,631 27.32 % 10.25 % 7.52 % 32.14 % Cheese (spont) 2,675 14.62 % 12.45 % 2.73 % 21.16 %
The following IPUs were extracted from Typaloc and Cheese spontaneous corpora. They clearly illustrate the phenomena quantified in Table 5. They also illustrate that the events often co-occur in an IPU
like shown in Table 6. Indeed, compared to read speech, spontaneous speech is characterized by sequences of speech which include frequent paralinguistic events. More precisely, we observe that the presence of these events is related to the type of spontaneous speech: laughter is quite infrequent in interviews or guided tasks; conversely, it is more frequent in conversations (CID, Cheese). Moreover, filled pauses are relatively frequent in most IPUs within spontaneous corpora.
Example 1 from Typaloc (spont):
donc euh des choses euh genre euh canard à l’orange des choses comme ça qui demandent euh une préparation un peu plus subtile une surveillance
(then uh things uh like uh duck in orange sauce something like that which require uh a slightly more subtle preparation a supervision)
Example 2 from Cheese (spont):
tu vas avec ton père euh il repart avec mille chameaux à @ (you travel with your father uh he goes back home with one thousand camels @)
6 Forced-alignment: read vs. spontaneous speech
The previous section highlights the fact that some events are so frequent that a forced-alignment system should be able to automatically time-align them, particularly in case of spontaneous speech whatever the context (interview, conversation, etc.). This section reports on the possibility for an acoustic model to include a model for each of these events. It measures its relevance. We aimed at developing an automatic alignment system that could place boundaries with accuracy comparable in both speech styles: read and spontaneous speech.
6.1 Test corpus and evaluation method
A test corpus was manually phonetized and segmented by one expert, then revised by another one. The data files of the test set were randomly extracted from the training set and removed from the latter. It includes two subsets:
– read speech: 127 seconds of AixOx (1776 labels);
– conversational speech: 141 seconds of CID (1833 labels). The read speech test set includes 4 speakers, reading 44 IPUs for which 9 contain noise items; and the spontaneous speech test set includes 12 speakers, with 27 IPUs for which 20 contain the selected events. Table 7 presents the detailed distribution of the labels in both data sets. For the read speech, the noise represents 0.58 % of the labels; and for spontaneous speech the 3 events represent 1.80 % altogether of the labels to be aligned. The system includes the following 31 phonemes:
– vowels: A/ E e 2 i O/ 9 u y
– nasalized vowels: a~ U~/ o~
– plosives: p t k b d g
– fricatives: f v s z S Z
– consonant nasals: m n
– liquids: l R
– glides: H j w
where A/ represents a or A, O/ represents o or O and U~/ represents e~
or 9~, in SAMPA code.1
Most of the boundaries between phonemes were easy to fix manually in the spectrograms with a precise position in time due to clear differences in intensity or voicing. But speech is a continuous process and dividing it into discrete, non-overlapping, and directly consecutive units necessarily involves ambiguities and discrepancies. So, no particular segmentation can be claimed to be the correct one. Among others, it was observed in (HOSOM, 2008) that the agreement between two expert humans is, on average, 93.78 % within 20 ms on a variety of English corpora.
1 French SAMPA proposed by J. C. Wells at: <http://www.phon.ucl.ac.uk/home/sampa/
TABLE 7 – Labels of the test subsets
Label Read speech Conversational speech
phoneme 1736 1791
filled pause 0 24
laughter 0 5
noise 10 4
short pause 30 9
For the experiments, we estimated the Unit Boundary Position Accuracy (UBPA) that has been widely used in previous studies. It measures what percentage of the automatic-alignment boundaries are within a given time threshold of the manually aligned boundaries. UBPA is an automatic evaluation of the place of boundaries that measures the deviation between the corresponding segment boundaries placed by humans and the system. This kind of error analysis reports a quantitative information that allows knowing the overall performances of the systems. 6.2 Forced-alignment without and with selected events
For the acoustic models, all the labels are 5-state HMMs. Typically, the HMM states are modeled by Gaussian mixture densities. Models were trained from 16 bits, 16,000 Hz sample-rated WAV files. The Mel-frequency cepstrum coefficients (MFCC) along with their first and second derivatives were extracted from the speech in a common way, 25 coefficients altogether: Delta coefficients appended (_D); Absolute log energy suppressed (_N); Cepstral mean subtracted (_Z); Cepstral C0 coefficient appended (_0).
Two series of acoustic models were created; a series depends on the amount of speech that was used to train. The training of the first series has no particular influence on the filled pause, laughter and noise events; therefore, it can be considered a state-of-the-art system. In the second series, the acoustic models include specific models for them.
For the first series, the acoustic models were created from the read-speech training set only. The models for the filled pause, noise and laughter were set to the prototype model. This prototype results of the
HCompv command of the HTK toolkit. See (BIGI, 2014) for details
about the training procedure that we implemented into the acmtrain.py script and acm package of SPPAS.
For the second series, the acoustic models of the first series were modified, in order to focus on evaluating the impact of the use of the three events. Specific models were trained for all of them from the spontaneous speech data. During this training procedure, filled pause items were phonetized fp, noises gb and laugh items lg. The latter models
were introduced in the previously created acoustic models, replacing the already existing ones.
Therefore, the only difference between the first and the second series of acoustic models lies in the models of the three selected events. We then measured the impact of adding models for these events in the acoustic model of the system for both read speech and spontaneous speech. Figures 6 and 7 display the UBPA of two such series of acoustic models. Each series of models was separately evaluated on the read-speech (Figure 6) and on the spontaneous-read-speech (Figure 7) test sets. All models were initialized with the same two minutes of manually phonetized and time-aligned data. The X-axis represents the amount of read speech data that was added during the training stage, represented in seconds, among the three corpora for which an enriched orthographic transcription is available: Typaloc, AixOx and Cheese. These models were then trained from the two minutes manually time-aligned plus randomly picked-up files in these read-speech corpora. Five runs were performed for each amount of data, and the displayed accuracy is the average of their UBPA. A final model was trained with all available read-speech data representing about 3h of Typaloc, AixOx, Cheese and
FIGURE 6 – UBPA (in percentage, with a delta of 20 ms) of acoustic models on read speech
FIGURE 7 – UBPA (in percentage, with a delta of 20 ms) of acoustic models on spontaneous speech
Both figures show that the initial model, trained from the 2 minutes of manually time-aligned data is already quite good (about 80 % accuracy) and so it constitutes a good initialization model for further training. We observe that from 2 to 20 minutes of training material, the accuracy increases significantly in all conditions. Then the models reach a relatively stable state, i. e. a slow but steady increase with small time-to-time variations. These results enable advice to be given to data producers who are expecting automatic speech segmentation on a given language: at least 2 minutes of manually time-aligned data and at least 20 minutes of properly transcribed data have to be created to form the acoustic model.
More importantly, these figures highlight important differences between the accuracy of the models with or without the three selected events on spontaneous speech. As was expected, the differences in read speech are not truly significant, due to the absence of filled pauses and laughter in the test corpus. The significant improvements on spontaneous speech reflected what we described in the previous section: these events are very frequent and the forced-alignment system has to be adapted. The accuracy of the model trained with all data increases from 83.88 % to 84.97 % on spontaneous speech that represents 1.09 % absolute gain and 6.76 % relative gain. The UBPA of the same model on read speech is 84.53 %.
Finally, we noticed that the UBPA at 40 ms of the models trained with all read-speech training data reaches 95.64 % on read speech and 95.67 % on spontaneous speech when the events are introduced. Experiments of this section made it possible to conclude that forced-alignment can reach very close performances on read speech and on spontaneous speech as soon as the acoustic model includes the 3 selected events: filled pause, laughter and noise.
6.3 Relative importance of the selected events
Our system is not the only one to deal with these events. For example, P2FA includes a model for laughter and three different models for noises. This section aims at comparing the relative impact of the events and constructing a final acoustic model able to cope optimally with the most varied speech styles.
In the scope of obtaining the best acoustic model, a new model has been created by adding the manually phonetized and time-aligned
Europe corpus to the training data. The latter is made of all of the
read-speech corpora. The filled pause (fp), noise (gb) and laughter (lg) were
then added to the acoustic model as in the experiments described in the previous section. It should be noted that adding the spontaneous corpora described in Table 2 drastically decreases the accuracy of the model. So, these latter data were used only to train the models of lg, fp and gb but
not to train the models of the phonemes.
Table 8 presents the accuracies of this final model at various delta values. Adding Europe corpus in the training procedure significantly increases the accuracy of the model on both spontaneous speech and read
speech. This final model reaches a good overall alignment performance whatever the speech style and so the system has the ability to withstand variations in speech.
TABLE 8 – UBPA (%) of the final acoustic model depending on the delta value (Europe data were included in the training set)
20 ms 30 ms 40 ms 50 ms 80 ms
read speech 85.54 93.75 96.09 97.82 99.22
spont. speech 86.10 93.94 96.48 97.62 99.19
Table 9 quantifies the impact of each event on the alignment of spontaneous speech. It shows that the use of a trained-noise model instead of the prototype does not really affect accuracy. With only 4 occurrences in the test set, it is not surprising but it could have slightly done. However, it should be noted that on read speech, the UBPA at 40 ms of the model without gb is 95.92 % and it increases to 96.09 % with gb. This result
brings us to conclude that the use of a generic model for all noises does not have very much impact on the accuracy. However, even if the test set contains only 5 laughter items, creating a specific model impacts significantly on the results: the accuracy at 40 ms grows from 96.05 % without lg to 96.48 % with lg, which represents an absolute gain of 0.43 % and relative gain of 10.89 %. Finally, the most important event that has to be represented in an acoustic model is the filled pause. In the previous section, we observed that filled pauses represent 2.28 % to 6.01 % of the tokens in the corpora of spontaneous data. In the test set, 24 items have to be time-aligned, over the 1833 labels; fp then represents 1.31 % of
the labels to be aligned. Table 9 shows that at 40 ms, the accuracy of the model without fp is 94.81 % and Table 8 shows that the final acoustic
model with a trained fp model is 96.48 %. The absolute gain is therefore 1.67 % and the relative gain is 32.18 %.
TABLE 9 – UBPA (%) on the spontaneous-speech test set of the acoustic model depending on the event
20 ms 30 ms 40 ms 50 ms 80 ms
model without gb 86.26 94.00 96.43 97.56 99.13
model without lg 85.83 93.62 96.05 97.13 98.54
model without fp 84.96 92.43 94.81 96.00 97.72
To complete this analysis, we should mention that, with exception of our system, all systems that support French language use sound 2 to
represent the filled pause instead of using the prototype as we tested in our previous experiments. We then evaluated the accuracy of our model when the model of fp is substituted by the model of the vowel 2. UBPA
at 40 ms is 95.67 % and at 80 ms is 98.53 %. It results in a significantly better accuracy compared to the use of the prototype (line 3 of Table 9), but a specific model achieves better accuracy (line 2 of Table 8). It can, thus, be concluded that the use of a vowel that is acoustically close to the filled pause is a good alternative in cases where no data is available to train a specific model for the filled pause but the latter is the preferable solution.
6.4 Analysis of the major errors
The previous experiments were based on the use of the UBPA. This accuracy measure allows us to detect what are called fine errors, “when the automatic segment boundary is not 100 % overlapping the corresponding manually placed segment boundary” (KVALE, 1994). UBPA has proved its effectiveness in comparing the performance of models; however, it does not highlight relevant information about the nature, extent, and timing of errors. A qualitative error analysis allowed us to estimate whether the deviations from human annotation introduce any bias.
We examined the errors when the automatic boundary is 80 ms over the manual one. This occurs 15 times in the read speech test corpus and 16 times in the spontaneous test set.
On read speech, it is noticeable that the errors are uniformly distributed over the files of the test. Five of the shifted boundaries lie between a phoneme and a short pause and one between a short pause
and a phoneme: this means that 20 % of the short pauses are not properly time aligned. This highlights a weakness in our model that we will have to investigate in future works. Other errors are sparse.
Contrarily to read speech, on spontaneous speech, errors are grouped into five IPUs of four different speakers. Figure 8 reports on the most salient errors concentrated in an IPU for the sequence of tokens “na na na na na na”. The speaker just wanted to report an undescribed discourse and he produced a hypo-articulated sequence. If the transcription is compatible to the production of the speaker, the automatic aligner failed in finding correct boundaries because of phoneme coalescence. During this sequence of speech, 6 errors were referenced. The system firstly missed the second token “na” by setting too long a duration of the first A/. The last 4 phonemes of this sequence are following
the principle of a forced-alignment system: they are “forced” even if the system can’t find them in the signal and the minimum duration is assigned (30 ms) to each of them. Figure 9 illustrates another typical case of errors in cascades. The system fails to find the beginning of the laughter and assigns the phoneme A/ to the first “sound” of the laughter - which is
acoustically close to a A. This error has an impact on the segmentation
of the sequence of 4 phonemes: k-t-w-A/.
FIGURE 8 – Misalignment on the spontaneous data set in the sequence of speech “na na na na na na”
FIGURE 9 – Misalignment on the spontaneous data set with a laughter
6.5 Analysis of the segmentations
We propose detailed quantitative analyses of the differences between the manual and the automatic annotation for each phoneme in terms of 3 variables:
– the duration;
– the position of the boundary for the beginning; – the position of the boundary for the end.
These comparisons are plotted by means of an R script, wrapped in the script we developed and included into SPPAS software tool. It evaluates the accuracy of an acoustic model with a more specific view. These diagrams provide precious information to the Linguists for a better understanding of the results from the automatic system.
Figures 10 and 11 represent this kind of result. In order not to overload this document, both figures show the duration of the phonemes only (automatic vs. manual). A positive value in the duration graph means that the duration of the phoneme is higher in the automatic segmentation than in the manual one. On read speech, we can observe that it mainly concerns g, H, w and z. The observation of the two other
graphs indicates that in both cases, the start boundary is slightly earlier and the end boundary is slightly later than expected. On the contrary, a negative value in the duration graph means that the duration of the phoneme of the automatic segmentation is smaller than the manual one. This is significantly the case for the consonants p and v because the start
end boundary is close to the expected one. U~/ is also reduced by the
automatic system because of an anticipated end boundary. The most significant reduced phoneme on read speech is 2 for which the start
boundary is later than expected and the end is earlier. On the contrary, the automatic system correctly aligns 2 in spontaneous speech. We can also
observe that the alignment of the filled pause is as good as the alignment of any phoneme with a perfect average duration and a very reasonable variation in the range of 20 ms; the whiskers are not very far either. However, durations of noise are systematically over-rated by 20 ms on average contrarily to the duration of laughter, which is underestimated by 20 ms on average.
From a global view of these figures, for the vowels the differences between read speech and spontaneous speech mainly concern 2 and 9; and
for consonants the system performs alignment significantly differently for the phonemes, p, t, k and H.
FIGURE 10 – Differences between the manual and the automatic annotation on read speech
FIGURE 11 – Differences between the manual and the automatic annotation on spontaneous speech
6.6 The aligner
All the forced-alignment results mentioned in the previous sections were estimated by using a wrapper of the Julius CSR engine, version 4.2.2. Finally, we assessed the impact of the aligner on the accuracy of the forced-alignment task. We estimated the results if we use a wrapper of the HVite command of HTK, version 3.4.1. In this experiment, only the aligner has changed; we used the acoustic model described in section 6.3 that obtains results as in Table 8 when Julius is used.
Table 10 indicates the UBPA by using a system based on the
HVite command. The second line indicates the difference of accuracy
TABLE 10 – UBPA of the final acoustic model with the HVite aligner. The second line indicates if the accuracy with HVite is lesser, higher or equal than with Julius.
20 ms 30 ms 40 ms 50 ms 80 ms
read speech (-0.95)84.59 (+0.28)94.03 (+0.06)96.15 97.82(=) (+0.11)99.33 spont. speech (-2.76)83.34 (-1.30)92.64 (-0.21)96.27 97.62(=) (-0.06)99.13
Compared to Table 8, Table 10 clearly shows that Julius performs better than HVite on spontaneous speech particularly when the delta of the UBPA is less than 50 ms. On read speech, results are either lesser, higher or equals with Julius or with HVite depending on the precision of the accuracy. Then, the aligner system has an impact on the alignments mainly for fine errors, and it has a relatively bigger impact on spontaneous speech than on read speech. Future work will have to investigate on the other aligner systems, including Sphinx, Kaldi and RASR.
Conclusion
This paper addressed the problem of automatic-speech segmentation for both read speech and spontaneous speech. Compared to read speech, spontaneous speech differs in two major issues: 1/ a significant increase of speech variations, and 2/ the embedding,
within speech, of events such as laughter, coughing, etc. These two
differences have to be considered by automatic systems because they have an impact on phonetic-acoustic analyses and because their study is relevant for linguistic and conversation analysis. In the system we propose, most of the difficulties involving the first point are tackled by the grapheme-to-phoneme system: broken words, repetitions, elisions, mispronunciations, etc. We briefly presented a full solution for the grapheme-to-phoneme conversion and introduced the EOT - Enriched Orthographic Transcription. This solution was designed to be as language-and-task independent as possible. Based on a relevant orthographic transcription and a pronunciation dictionary, the system can work on speech of any language and of any style, including disfluencies. This paper attracted more attention on the second point about embedded events and on the forced-alignment task. The phoneme alignment of read
speech can actually be done quite easily thanks to state-of-the-art systems freely available on the web. However,the automatic forced-alignment of spontaneous speech remain a challenge.
The distributions of 3 selected events in several corpora were presented: the filled pause, laughter and noise. We quantified these events in both read speech and various styles of spontaneous speech. They were observed in a maximum of 3.32 % of the IPUs in a read speech corpus while in spontaneous speech 20 % up to 36 % of the IPUs include at least one of these 3 events. Experiments were performed to estimate their impact on the forced-alignment task. They led us to conclude that forced-alignment can reach very close performances on read speech and on spontaneous speech as soon as the acoustic model includes the events. This result implies that the acoustic model is robust enough to cope with speech reductions and variations, even on spontaneous speech. Qualitative and quantitative analyses of the results pointed a slight weakness of our model for the alignment of short pauses. However, we observed a very close quality in the alignment of phonemes between read speech and spontaneous speech. The alignment of the filled pause performs also as well as the alignment of any phoneme; durations of noise events are overrated by 20 ms on average contrarily to the duration of laughter, which is underestimated, by 20 ms on average.
In the context of this study, we created a robust acoustic model for French language. This model will be included in version 1.9.5 of SPPAS and distributed under the terms of the Creative Commons Attribution-NonCommercial-ShareAlike 4.0 International Public License. The file is saved in HTK-ASCII format2 in order to allow the model of each sound
to be extracted and re-used in another acoustic model, as soon as the latter is based on the same acoustic parameters. Moreover, the Python library and the scripts to train an acoustic model or to estimate the UBPA will also be included in the software under the terms of the GNU Public License version 3. Both will be available as a functionality in the CLI.
2 This format is neither compressed nor encoded. It is simply a readable file that can
Authors’ contributions
Brigitte Bigi designed the study, performed the experiments and implementation of the research. Christine Meunier brought information about the problematic of the segmentation of spontaneous speech and contributed to the interpretation of the results. Both wrote the manuscript.
References
ADDA-DECKER, M.; GENDROT, C.; NGUYEN, N. Contributions du traitement automatique de la parole à l’étude des voyelles orales du français. Traitement Automatique des Langues – ATALA, [s.l.], v. 49, n. 3, p. 13-46, 2008.
BATES, R. A.; OSTENDORF, M.; WRIGHT, R. A. Symbolic phonetic features for modeling of pronunciation variation. Speech Communication, Elsevier, v. 49, n. 2, p. 83-97, 2007. Doi: https://doi.org/10.1016/j. specom.2006.10.007
BELL, A.; JURAFSKY, D.; FOSLER-LUSSIER, E.; GIRAND, C.; GREGORY, M.; GILDEA, D. Effects of disfluencies, predictability, and utterance position on word form variation in English conversation. The
Journal of the Acoustical Society of America, [s.l.], v. 113, n. 2, p.
1001-1024, 2003. Doi: https://doi.org/10.1121/1.1534836
BERTRAND, R.; BLACHE, P.; ESPESSER, R.; FERRÉ, G.; MEUNIER, C.; PRIEGO-VALVERDE, B.; RAUZY, S. Le CID – Corpus of Interactional Data – Annotation et Exploitation Multimodale de Parole Conversationnelle. Traitement Automatique des Langues, – ATALA, [s.l.], v. 49, n. 3, 2008.
BIGI, B. The SPPAS participation to Evalita 2014. In: ITALIAN CONFERENCE ON COMPUTATIONAL LINGUISTICS CLiC-it, 1; INTERNATIONAL WORKSHOP EVALITA, 4., 2014, Pisa, Italy.
Proceedings… Pisa: Pisa University Press, 2014. v. 2, p. 127-130.
BIGI, B. A Multilingual Text Normalization Approach. In: VETULANI, Z.; MARIANI, J. (Ed.). Human Language Technology Challenges for
Computer Science and Linguistics, LTC 2011. Lecture Notes in Computer
Science. Berlin: Springer Berlin Heidelberg, 2014. v. 8387, p. 515-526. Doi: https://doi.org/10.1007/978-3-319-14120-6_42