HAL Id: hal-00299425
https://hal.archives-ouvertes.fr/hal-00299425
Submitted on 5 Apr 2007
HAL is a multi-disciplinary open access
archive for the deposit and dissemination of
sci-entific research documents, whether they are
pub-lished or not. The documents may come from
teaching and research institutions in France or
abroad, or from public or private research centers.
L’archive ouverte pluridisciplinaire HAL, est
destinée au dépôt et à la diffusion de documents
scientifiques de niveau recherche, publiés ou non,
émanant des établissements d’enseignement et de
recherche français ou étrangers, des laboratoires
publics ou privés.
the case of Catalonia for the last century
M. Barnolas, M. C. Llasat
To cite this version:
M. Barnolas, M. C. Llasat. A flood geodatabase and its climatological applications: the case of
Catalonia for the last century. Natural Hazards and Earth System Science, Copernicus Publications
on behalf of the European Geosciences Union, 2007, 7 (2), pp.271-281. �hal-00299425�
www.nat-hazards-earth-syst-sci.net/7/271/2007/ © Author(s) 2007. This work is licensed under a Creative Commons License.
and Earth
System Sciences
A flood geodatabase and its climatological applications: the case of
Catalonia for the last century
M. Barnolas and M. C. Llasat
Meteorological Hazards Analysis Team (GAMA), Department of Astronomy & Meteorology, Faculty of Physics. University of Barcelona, Av. Diagonal 647, 08028 Barcelona, Spain
Received: 22 December 2006 – Revised: 29 March 2007 – Accepted: 29 March 2007 – Published: 5 April 2007
Abstract. Floods are the natural hazards that produce the
highest number of casualties and material damage in the Western Mediterranean. An improvement in flood risk as-sessment and study of a possible increase in flooding oc-currence are therefore needed. To carry out these tasks it is important to have at our disposal extensive knowledge on historical floods and to find an efficient way to manage this geographical data. In this paper we present a complete flood database spanning the 20th century for the whole of Catalonia (NE Spain), which includes documentary tion (affected areas and damage) and instrumental informa-tion (meteorological and hydrological records). This geo-database, named Inungama, has been implemented on a GIS (Geographical Information System) in order to display all the information within a given geographical scenario, as well as to carry out an analysis thereof using queries, overlays and calculus. Following a description of the type and amount of information stored in the database and the structure of the information system, the first applications of Inungama are presented. The geographical distribution of floods shows the localities which are more likely to be flooded, confirming that the most affected municipalities are the most densely popu-lated ones in coastal areas. Regarding the existence of an in-crease in flooding occurrence, a temporal analysis has been carried out, showing a steady increase over the last 30 years.
1 Introduction
Floods are the major cause of loss of human lives and prop-erty damage in Catalonia (Llasat, 2004). Between 1950 and 1990, there were a total of 1400 deaths in Catalonia and material damage amounting to over C301 000 000 per year (Dolz, 1993; Berga, 1995). One of the last catastrophic
Correspondence to: M. Barnolas
events was the 10 June 2000 Montserrat event. That episode caused material damage estimated over C65 000 000 and five casualties (Llasat et al., 2003). The geographical characteris-tics of Catalonia, its precipitation regime and the population distribution (concentrated in coastal and plain areas) con-tribute to make floods the most important natural hazard in this region.
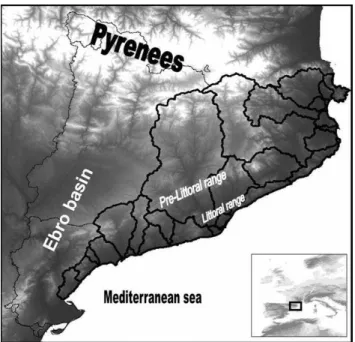
Catalonia has a surface area of 31 930 km2and it is located in the Northeast part of the Iberian Peninsula. To the East it borders on the Mediterranean Sea, to the North, on the Pyre-nees, and to the West, on the Ebro river valley (Fig. 1). The most relevant topographic features are the Pyrenees, which rise to over 3000 m, the Littoral range and the Pre-littoral sys-tem, both located parallel to the coast, reaching higher than 700 m and 1700 m respectively. The hydrographical network covers the tributary waters of the Ebro basin and the Internal Basins of Catalonia (IBC), which include rivers that rise in Catalonia and flow into the Mediterranean Sea. The proxim-ity to the Mediterranean Sea and its complex orography plays an important role in rainfall and flood production.
Its precipitation regime is characterised by a bi-modal yearly distribution, with one main maximum in autumn and a secondary peak in spring. However, high rainfall precipi-tation produced by convective events shows only one peak centered between the end of summer and autumn (Llasat, 2001). Consequently, floods in Catalonia could be associ-ated with different kinds of precipitation systems. In the light of their duration, rainfall intensity, accumulated precipitation and damage, floods arising in Catalonia can be classified as follows (Barrera et al., 2006):
Type 1. Very convective rainfall events: episodes of very short duration (less than 6 h) but very high rainfall intensity. The local amount of rainfall is nevertheless not usually very high. They produce flash floods and local damage. Their associated floods are usually ordinary or extraordinary, fol-lowing the classification shown in Llasat et al. (2005).
Fig. 1. Main orographic systems in Catalonia (NE Spain)
men-tioned within the text. Black lines show the Internal Basins of Cat-alonia.
Type 2. Very convective and moderate rainfall events: episodes of short duration (between 6 and 72 h) with heavy rain sustained for several hours with large amounts of total precipitation (200–500 mm). In the light of their duration and size of catchments, they can produce catastrophic flash floods.
Type 3. Episodes of long duration (approximately 1 week) with weak pluviometric intensity values, with possible peaks of high intensity. Accumulated rainfall can be over 200 mm and usually ordinary or extraordinary floods arise.
Assuming that natural events will occur in the future in similar circumstances as those that led to past events, a valu-able aid to the study of this natural hazard lies in knowl-edge of historical events and the development of accurate databases. Data compilation related to past flood events has been the subject of several studies in various points of Spain. Some of these studies focus on documentary information (Comisi´on Nacional de Protecci´on Civil, 1983, 1985; Bar-riendos and Martin-Vide, 1998; Barrera et al., 2006). Recon-struction of flood events from documentary sources has also been carried out in other regions throughout Europe (Br´azdil et al., 1999; Naulet et al., 2001; Glaser et al., 2003). The AVI archive stores historical information on landslides and floods all over Italy, for the 20th century (Guzzetti et al., 1994). A regional development of the AVI project has been performed through construction of the ASICal database (Petrucci and Versace, 2000). This database contains information on land-slides and floods spanning from the year 1100 to the year 2000, for the Italian region of Calabria. This information has been obtained from the AVI archive and other
documen-tary sources. Other works, such as the palaeoflood database for the Tagus basin (Benito et al., 2003), are also focused on palaeoflood records (Diez-Herrero et al., 1998; Benito et al., 2004).
The use of Geographical Information Systems (GIS) to store and manage geographical data is widespread in envi-ronmental sciences. In Spain palaeoflood and documentary flood data generated within the EU funded SPHERE project was organised into a relational database and implemented on a GIS (Casas et al., 2003). The large amount of data stored in the AVI archive has been implemented in the SICI information system. This information system on hydrologi-cal and geomorphologihydrologi-cal catastrophes is the largest reposi-tory of historical information on landslides and floods in Italy (Guzzetti and Tonelli, 2004). Historical records from the AVI archive and GIS techniques are also used in flood risk analy-sis in the Salento region (Forte et al., 2005).
The spatial distribution of the different kind of floods is neither homogeneous in the region, nor stationary over time. In order to investigate these geographical and time distribu-tions and taking into account the previous consideradistribu-tions, a complete database that covers all the information avail-able for the 20th century all over Catalonia has been gen-erated. The database includes information on affected ar-eas and damage, generally provided by documentary sources, and instrumental information (meteorological and hydrolog-ical records). Meteorologhydrolog-ical information is included, as it can be useful to study the meteorological situations that have led to floods. It is very important to find an efficient way to manage this information. To achieve this purpose, data were organised into a relational database so that it could be implemented on a GIS. From the implementation of the geo-database on a GIS, the new information system Inungama has been obtained. This information system provides an effective way of displaying all the information within a geographical scenario, and is a useful tool to carry out analysis thereof.
The work presented in this paper is structured as follows: first of all, in Sect. 2 (Methodology), the information sources are described and compared with each other. Then, the type of information available for each flood event is described, followed by a description of the structure of the geodatabase. Next comes a section titled “Climatological analyses using GIS” (Sect. 3), where different climatological analyses are provided. These have been obtained as a result of applica-tion of the informaapplica-tion system and thanks to extension of the period of study. Finally, Sect. 4 (Summary) contains a summary of the results obtained and gives some concluding remarks.
65 108 217 33 0 50 100 150 200 250
SPHERE Previous compilations Newspapers Published and unpublished scientific
papers and reports
Sources of information N u m b e r o f e v e n ts
Fig. 2. Distribution of the number of events recorded in the 20th
century for each source of information.
2 Methodology
2.1 Type of information and sources consulted
A total of 217 flood events have been identified and recon-structed for the period 1901–2000, by means of a system-atic analysis of a wide variety of published and unpublished sources. The main sources consulted to collect the informa-tion were: preceding data compilainforma-tions relating to specific localities or regions, as well as scientific papers and reports, available technical notes, newspapers and instrumental in-formation. Results from previous projects such as SPHERE (European Union), among others, have been also taken into account. All this information has been contrasted with the various sources in order to ensure its veracity.
The various sources consulted provided information of varying quality and amounts. Regarding the number of events, preceding data compilations and newspapers are the sources that make most information available (Fig. 2). On the other hand, scientific papers only supply information for a limited number of events. Regarding the kind of informa-tion, scientific papers provide a lot of information on the me-teorological characteristics of the event and high quality data. On the other hand they do not usually show information on the damage produced by floods. This kind of information is available in newspapers and reports from insurance com-panies. Another factor of note is that newspapers emphasise events that have occurred in urban areas, and their impact de-pends on other headline news of the day. The existence of a large variety of sources of information for some of the events implies having conflicting information in some cases. One of the reasons why contradictory information is found is the lack of metadata. For example, in some cases, accumulated rainfall values for a specific day and station differ from one source to another because they had been recorded over differ-ent time spells without this being specified. Significant work was involved in checking and validating all the information in order to have an accurate database.
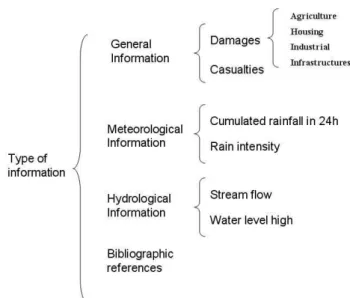
Fig. 3. Type of information diagram.
To update the inventory, some of the documentary sources particularly useful were as follows: scientific papers on spe-cific events (e.g. Llasat and Rodriguez, 1992; Ramis et al., 1994, 1995; Rigo and Llasat, 2000, 2005; Rigo et al., 2001; Llasat et al., 2003), historical catalogues of floods compiled for specific geographical areas (e.g. Comisi´on Nacional de Protecci´on Civil, 1983, 1985; Barriendos and Pom´es, 1993), available technical notes (e.g. Novoa, 1981; Aran et al., 1999), doctoral theses (e.g. Llasat, 1987; Barriendos 1994; Rigo, 2004), and the results obtained in the SPHERE project. The type of information collected can be organised into four groups: general information, which comprises affected area, data related to damage (agriculture, housing, industrial and infrastructures) and casualties; meteorological informa-tion (accumulated rainfall and rain intensity), hydrological information (stream flow and water level high) and the refer-ences consulted (Fig. 3).
2.2 Structure of the database
This large amount of available data is very useful if it is prop-erly organised. In order to find an effective way to manage this information it was organised into a relational database in ACCESS normalized until the third normal form (Barnolas, 2004; Barnolas and Llasat, 2005). The database was struc-tured bearing in mind the kind of available data and the ap-plications required. Taking into account the possibility of ac-quiring additional information and finding new research re-sults, the structure was designed so that it could be updated easily.
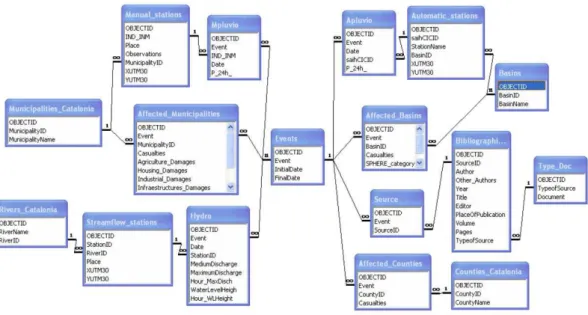
This geodatabase contains a main table called “Events” which includes the initial and final date of the meteorolog-ical event and a key field (Fig. 4). In addition, there are seven complementary tables containing the main information
Fig. 4. Structure of the database.
for each flood event. These tables were organised into four groups: general information (Affected Municipalities, Af-fected Counties and AfAf-fected Basins), meteorological data (MPluvio and APluvio, where MPluvio contains meteoro-logical data recorded in manual stations, and “APluvio” in automatic stations), hydrological data (Hydro), and biblio-graphical references consulted (Bibliographic Ref).
General information includes everything relating to damage and casualties for each event and geographi-cal unit. The geographical units taken into account are municipalities, counties and basins. Each row of the Affected Municipalities, Affected Counties and Af-fected Basins tables implies that one of these geographi-cal units has been flooded in an event. Damage to agri-culture, houses, industry and infrastructures are known for municipalities, so these fields are included in the Af-fected Municipalities table. Casualties are known for each flood event and geographical unit, so this field is included in the three tables. Each one of these tables is annexed to another one by an index that links each geographical unit to its name. For example, in the table Affected Municipalities, the occurrence of a flood in a municipality is indicated by the identification index of that municipality. In this way the name of the geographical unit appears only once in the table that defines each index. Numerical characters are useful in order to avoid possible errors typical from text characters, as in the different use of capital letters or otherwise.
Meteorological data available for each day of the event, mainly accumulated rainfall in 24 h, and rainfall intensity, are included in two tables depending on the kind of rain-gauge (automatic or manual): MPluvio and APluvio. Avail-able rainfall data are at daily resolution until 1996 (recorded in manual stations of the Instituto Nacional de Meteorolog´ıa,
INM, Spanish National Weather Service), while since 1996 they are 5-minutal (recorded in automatic stations of the Automatic System of Hydrological Information-SAIH). The fields included in these tables are the Events key field (in or-der to relate the table with the Events table), the accumulated rainfall value (P 24 h), the date on which it was recorded, and the identification index of the station where this value was recorded (saihCICID and IND INM). Each one of these tables is annexed to another table that identifies each sta-tion (Automatic stasta-tions and Manual stasta-tions). Some of the fields included to identify each station are: its name, the mu-nicipality or basin where it is located, its geographic coor-dinates, and some observations that can be useful if there is more than one station in the same municipality.
Hydrological data is included in the Hydro table. It con-tains information about the stream flow and water level val-ues for each event and measurement station. The fields in-cluded in this table are: mean discharge of the day, maximum discharge value, the hour this value was recorded, water level and the hour this value was measured, and the identification index of the measurement station where these values were recorded. As the other tables explained above, this table is annexed to another one that identifies each measurement sta-tion (Streamflow stasta-tions). The fields included to identify each station are: the location of the station, its geographi-cal coordinates, and the river where it is located. As some stations are located on the same river, an identification in-dex (RiverID) is used once again in order to avoid problems with text characters. This index serves to link the Hydro ta-ble with the Rivers Catalonia tata-ble, which shows the name of the river related to its index.
Finally, the information concerning the bibliograph-ical references consulted is found in three tables
(Bibliographic Ref, Type Doc, and Source). Biblio-graphic Ref contains the main information of the references consulted: the author, other authors, the title of the docu-ment, the year it was published, the volume and pages, the place of publication, the name of the editors, etc. Some of these fields are used in a different way depending on the type of document specified. Type Doc is used to distinguish the type of document (book, book chapter, article, report or newspaper). Source is a support table used to avoid many-to-many relationships.
This relational geodatabase has been integrated into a GIS where spatial data is represented by a raster cover of a digi-tal elevation model and vectorial covers for municipalities, counties, catchments, meteorological stations, and stream flow measure stations. These covers are linked with their re-lated tables by a unique code. For example the table Apluvio is related with the cover of Automatic stations by the code saihCICID.
3 Climatological analyses using GIS
The historical information stored in this geodatabase is used for a large variety of applications. The tool developed, In-ungama, allows the carrying out of spatial and temporal anal-ysis of quantitative parameters of flood events by using sim-ple queries, overlays and calculus. In this paper some ex-amples for each case are shown. For the spatial analysis, a geographical distribution of floods in Catalonia has been un-dertaken. Regarding the temporal analysis, the seasonal dis-tribution of floods is shown, and the existence of a possible increase in the number of floods in recent years, is studied. Furthermore, it is possible to obtain and visualise all the in-formation related with an event, such as the area affected by floods or the availability of data. Since it is possible to inter-polate accumulated rainfall data and to overlay other meteo-rological fields (radar data and MM5 meteometeo-rological model outputs), this GIS has been used as a complementary tool in the study of meteorological episodes.
3.1 Monthly distribution of floods
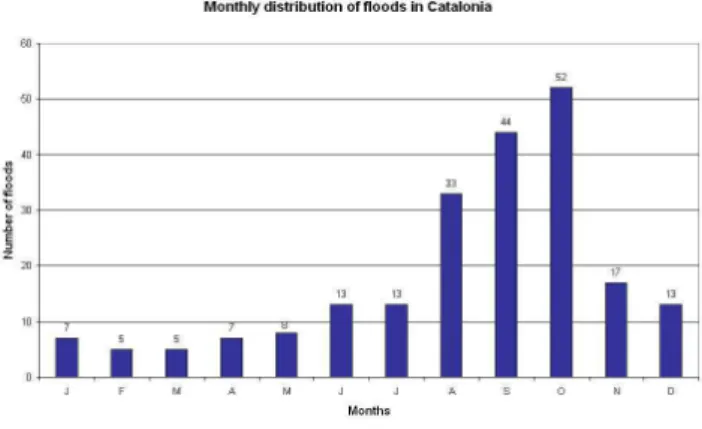
The catalogue of 217 events reports the exact date or period, in the case of events that lasted more than one day, for all the events listed. This information has made it possible to plot a monthly distribution histogram of floods in the 20th century. This distribution (Fig. 5) shows that most of the events take place in autumn. Although floods are a complex hydrometeorological hazard they are usually a direct effect of precipitation. The maximum in the occurrence of floods in autumn coincides with the months with largest precipitation amounts (Llasat and Puigcerver, 1997; Lana and Burgue˜no, 2000) in the region. The largest number of floods occurs in October (52); followed by September (44) and August (33).
Fig. 5. Monthly distribution of floods.
It is important to note that there is no month without flooding occurrence.
Fall season floods are mainly identified with convective episodes of heavy rain sustained for several hours (type 2). These kind of convective events are frequent in fall because the Mediterranean Sea, after the high solar radiation received during the summer season, is warm enough to ensure con-siderable moisture and instability at low atmospheric levels. Other main factors necessary to produce these convective sit-uations are convective instability, and a lifting mechanism (as orography or convergence lines) which permits the low-level parcels to attain the free convection level. Convective insta-bility is triggered when the meteorological synoptic situation is favourable to produce an inflow of warm and moist air mass over Catalonia at low levels that can sometimes com-bine with an entry of cold upper-level Atlantic disturbances. Continuous supply of moisture at low levels towards the con-vective areas is required to sustain the convection and to pro-duce large rainfall amounts. Some examples of these events are the floods of 20–23 September 1971 (Llasat et al., 2007) or the event of 6–8 November 1982 (Llasat, 1991), in which more than 400 mm and 500 mm, respectively, accumulated at some stations.
More local convective situations lasting less than 6 h (episodes of type 1) mainly arise during summer and at the beginning of autumn. This kind of events requires consid-erable local atmospheric instability, and is usually produced by “isolated cells” or “multicells” of limited horizontal ex-tension (Rigo and Llasat, 2004). The flash flood of 28 Au-gust 1998 is an example of this type of episode (Llasat et al., 2005).
Events producing floods in winter are usually episodes of long duration associated with frontal disturbances (type 3). They are slightly convective events usually associated with convection embedded in stratiform rainfall. Although these events are not very frequent, there have been some cases in the 20th century, one of them being the event of 21–30 Jan-uary 1996, where more than 200 mm were recorded (Llasat et al., 2000).
0 10 20 30 40 50 60 J F M A M J J A S O N D 0 1 2 3 4 5 6 7 8 9 J F M A M J J A S O N D 0 1 2 3 4 5 6 7 8 J F M A M J J A S O N D N u m b e r o f fl o o d s Months a b c
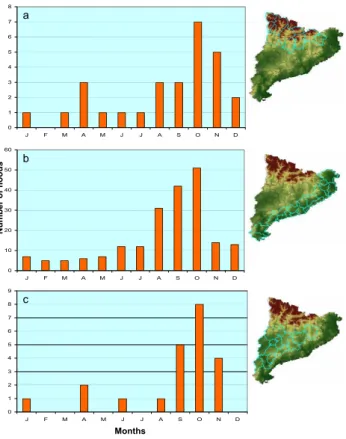
Fig. 6. Monthly distribution of floods in the Pyrenees (a), the littoral (b), and the inland region of Catalonia (c).
Use of the geographical information system makes it pos-sible to combine information on the monthly occurrence of the events with their geographical location, so that the re-gional variation of the monthly distribution of floods in Cat-alonia can be investigated. In this way monthly number of floods in the Pyrenees region, the littoral region and the in-land region of Catalonia are studied separately, as can be seen in Fig. 6.
The Pyrenees represent 46% of the extension of Catalo-nia, but only 5% of the population lives there (Fig. 6a). Of the total amount of 217 events that arose in Catalonia in the period of study, a county of the Pyrenees was affected only in 28 occasions. Despite the number of events not being very high, it is important to remark that floods are distributed over all the months of the year, except February. These counties are then affected by episodes of all three types, with fall sea-son having the most important episodes. In spring, melting of snow around the river springs in the mountains can help to overflow banks of rivers when it is accompanied by heavy rainfall. This fact can be noticed in the monthly distribution of floods in the Pyrenees and the interior region (where the rivers have tributaries from the Pyrenees region), both hav-ing a relative maximum in April. The November 1982 flood mainly affected this region.
In 94% of the events arising in Catalonia in the last cen-tury at least one county of the littoral region was affected (Fig. 6b). On the other hand, only in 10% of the cases was a county of the interior region affected (Fig. 6c). The lit-toral region presents no month without flooding occurrence, being vulnerable to episodes of all the three types, although events of type 1 are the most frequent. This area has plenty of small basins with a quick response to precipitation; there-fore it can be affected by flash floods when rainfall inten-sity is high, in spite of not having very high total amount records. These kind of events arise in summer and at the be-ginning of autumn, where the maximum of the distribution is found, as can be observed in Fig. 6b. The fact that these basins are also densely populated makes them more vulnera-ble to floods. Two examples of floods that affected this region were the event recorded between 2–5 October 1987 (Ramis et al., 1994), that was of type 2, and another recorded on 21 September 1995 (Barrera et al., 2006), that was of type 1. The September 1971 flood also affected this region. On the other hand, inland counties of Catalonia are located in bigger basins in which higher amounts of precipitation are needed to produce overflowing. Besides this, they are located in a plain region, where orographic factors do not have a direct influ-ence. In this case there are several months without flooding occurrence in winter, spring and summer. These counties are mostly affected by episodes of type 3 and sometimes, by ones of type 2. As examples, the events of January 1996 and November 1982 affected this region.
3.2 Geographical distribution of floods in Catalonia Inungama has permitted mapping of how many times each municipality, county, or basin has been affected by floods in the 20th century. The catalogue of 217 events contains episodes that have lasted a few hours and others that have continued for more than two days. Some of these events may have produced floods in different localities of the study re-gion. In this paper the municipality distribution of floods is outlined (Fig. 7). Of the total number of 946 municipalities within Catalonia, more than 200 have been affected at least once by flood. Most of these municipalities have been inun-dated only once, but in the littoral region 22 municipalities have been flooded more than 10 times. In this respect Matar´o, in the Maresme basin (Fig. 8a), might be highlighted, since 61 events have occurred there in the last 100 years. The Maresme is the most affected basin (131 events in the last century), with 11 municipalities affected more than 10 times. This basin is usually affected by local flash floods as a result of type 1 episodes. This kind of events (intense precipitation over small catchments) give rise to road traffic cuts, loss of cars parked in the water courses and in some cases fatalities, as a consequence of the floods’ suddenness. The inland re-gion, which is within big catchments (Ebro basin), affected almost exclusively by events that usually cover a large ter-ritorial extension, as occurred on 6–8 November 1982, with
Fig. 7. Number of events by municipality.
Fig. 8. (a) Municipalities with at least one casualty due to floods in
the 20th century. (b) Population density map.
floods not only in the Ebro basin but also in the Pyrenees. Exceptionally, flood events of type 3 enhanced by snowmelt affect the inland region.
Figure 8a shows municipalities where there has been at least one casualty due to floods on the 20th century. It can be noticed that most of municipalities selected form part of re-gions with highest population density (Fig. 8b), or are located in basins with short response times (the Maresme). Usually, these localities are also affected by convective episodes, as it has been shown before, being more vulnerable to flash floods. The greatest concentration of localities affected by floods is located over the Llobregat basin, partly due to the 25 September 1962 event (Llasat et al., 2003). That event was the most catastrophic recorded in the period of study, with more than 815 deaths. It was an episode of type 2, that produced a flash flood in the Llobregat and the Bes´os rivers (Fig. 8a), with a total rainfall of 212 mm recorded in less than 3 h, and a maximum intensity of 6 mm/ min.
3.3 Temporal evolution of flood events
Within the framework of climate change, one of the cur-rent worries is the existence of an increase in the number of
0 1 2 3 4 5 6 7 8 1 9 0 1 1 9 0 4 1 9 0 7 1 9 1 0 1 9 1 3 1 9 1 6 1 9 1 9 1 9 2 2 1 9 2 5 1 9 2 8 1 9 3 1 1 9 3 4 1 9 3 7 1 9 4 0 1 9 4 3 1 9 4 6 1 9 4 9 1 9 5 2 1 9 5 5 1 9 5 8 1 9 6 1 1 9 6 4 1 9 6 7 1 9 7 0 1 9 7 3 1 9 7 6 1 9 7 9 1 9 8 2 1 9 8 5 1 9 8 8 1 9 9 1 1 9 9 4 1 9 9 7 2 0 0 0 Years N u m b e r o f fl o o d s -0.1 -0.08 -0.06 -0.04 -0.02 0 0.02 0.04 0.06 0.08 1901190519091913191719211925192919331937194119451949195319571961196519691973197719811985198919931997 Year N u m b e r o f fl o o d s /Ye a r a b
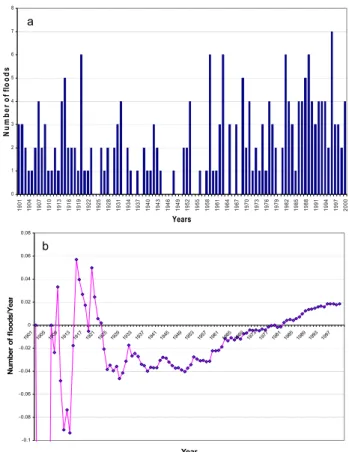
Fig. 9. (a) Temporal distribution of floods in Catalonia (1901–
2000). (b) Accumulated slopes for flood frequency in Catalonia (1901–2000). Data points 2 to 5 lie below up to −0.7 before the slope computation converges to a stable range.
floods. Figure 9a shows the temporal evolution of floods in the 20th century. An increase in the number of floods can be observed in recent years. Also notable is the existence of pe-riods with a large number of floods every year (for example from 1986 to 1994) and other periods without a significant flooding occurrence (1944–1951). In order to find evidence of increased flood occurrence in Catalonia, a temporal analy-sis has been carried out. The initial analyanaly-sis has been a yearly normalisation of the flood events series, smoothed afterwards by Gaussian low-pass filters (10 and 30 years). The method-ology followed to test trends in flood frequency was accumu-lated slopes. It is based on calculating the slope of a straight line, firstly fitted to the first two pairs of values of the data series (time and frequency), secondly to the first three pairs of values, and so on until the end of the data series. Every step of this method is plotted (Fig. 9b). To test the statisti-cal significance of possible linear trend in the flood frequency evolution a Monte Carlo technique has been applied (Livezey and Chen, 1983; Kunkel et al., 1999; Liebmann et al., 2004). This technique consists in the following steps:
0 0.5 1 1.5 2 2.5 1 9 0 1 1 9 0 6 1 9 1 1 1 9 1 6 1 9 2 1 1 9 2 6 1 9 3 1 1 9 3 6 1 9 4 1 1 9 4 6 1 9 5 1 1 9 5 6 1 9 6 1 1 9 6 6 1 9 7 1 1 9 7 6 1 9 8 1 1 9 8 6 1 9 9 1 1 9 9 6 0 1 2 3 4 5 6 7 8 1 9 0 1 1 9 0 6 1 9 1 1 1 9 1 6 1 9 2 1 1 9 2 6 1 9 3 1 1 9 3 6 1 9 4 1 1 9 4 6 1 9 5 1 1 9 5 6 1 9 6 1 1 9 6 6 1 9 7 1 1 9 7 6 1 9 8 1 1 9 8 6 1 9 9 1 1 9 9 6 0 0.5 1 1.5 2 2.5 1 9 0 1 1 9 0 6 1 9 1 1 1 9 1 6 1 9 2 1 1 9 2 6 1 9 3 1 1 9 3 6 1 9 4 1 1 9 4 6 1 9 5 1 1 9 5 6 1 9 6 1 1 9 6 6 1 9 7 1 1 9 7 6 1 9 8 1 1 9 8 6 1 9 9 1 1 9 9 6 Years N u m b e r o f F lo o d s a b c
Fig. 10. Temporal evolution of floods in the Pyrenees (a), the littoral (b), and the interior regions of Catalonia (c) (1901–2000).
i) Calculation of the linear trend of the original series by the linear fitting of data (minimum squares or linear re-gression).
ii) Generation of 10 000 random permutations of the origi-nal series.
iii) Calculation of the linear trends for each 10 000 gener-ated series.
iv) Calculation of the 97.5 and 2.5 percentiles for the 10 000 calculated linear trends.
v) If the first linear trend calculated was higher than 97.5 percentile for positive trend or lower than 2.5 percentile for negative trend, then the obtained trend would be sig-nificant at 95%.
Figure 9b shows a smooth increase in the number of floods over the last 30 years. This curve has a positive slope of 2 floods per century at the end of the series. The observed
-0.1 -0.05 0 0.05 0.1 0.15 1 9 0 1 1 9 0 6 1 9 1 1 1 9 1 6 1 9 2 1 1 9 2 6 1 9 3 1 1 9 3 6 1 9 4 1 1 9 4 6 1 9 5 1 1 9 5 6 1 9 6 1 1 9 6 6 1 9 7 1 1 9 7 6 1 9 8 1 1 9 8 6 1 9 9 1 1 9 9 6 -0.1 -0.08 -0.06 -0.04 -0.02 0 0.02 0.04 0.06 1 9 0 1 1 9 0 6 1 9 1 1 1 9 1 6 1 9 2 1 1 9 2 6 1 9 3 1 1 9 3 6 1 9 4 1 1 9 4 6 1 9 5 1 1 9 5 6 1 9 6 1 1 9 6 6 1 9 7 1 1 9 7 6 1 9 8 1 1 9 8 6 1 9 9 1 1 9 9 6 Years N u m b e r o f F lo o d s /Y e a r a b c -0.1 -0.05 0 0.05 0.1 0.15 1 9 0 1 1 9 0 6 1 9 1 1 1 9 1 6 1 9 2 1 1 9 2 6 1 9 3 1 1 9 3 6 1 9 4 1 1 9 4 6 1 9 5 1 1 9 5 6 1 9 6 1 1 9 6 6 1 9 7 1 1 9 7 6 1 9 8 1 1 9 8 6 1 9 9 1 1 9 9 6
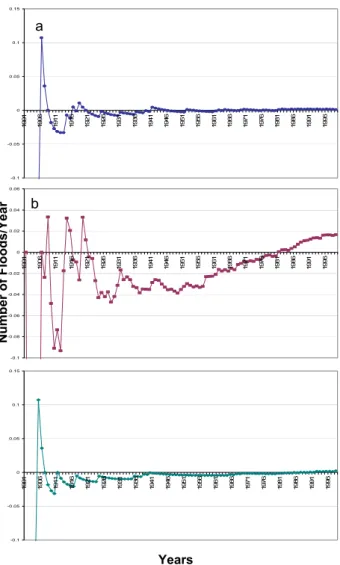
Fig. 11. Accumulated slopes for flood frequency in the Pyrenees (a), the littoral (b), and the interior regions of Catalonia (c) (1901–
2000).
Table 1. Trend analysis results of applying the Monte Carlo
tech-nique for the flood frequency in Catalonia. Linear regression 0.018 flood/year percentile 97.5% 0.012 flood/year percentile 2.5% –0.012 flood/year
trend is statistically significant at 95% confidence level fol-lowing the Monte Carlo procedure (Table 1). Anyway, pre-vious studies had demonstrated that there is no evidence of an increase of precipitation in the Northeast region of Spain (Barrera and Llasat, 2004) in recent years. So, in this way it is remarkable that the positive slope detected for the flood occurrence is not due to an increase of precipitation. This growth in the number of floods must be due to other factors.
Here, factors such as increased urbanisation in recent years, changes in geomorphological or hydrological river condi-tions or major information coverage could be responsible.
The temporal evolution of floods has been analysed for the Pyrenees region, the littoral region and the inland region of Catalonia (Fig. 10) (see Fig. 6 for locations). Once again, it can be noticed that the littoral counties are the most af-fected by floods. It has been applied the same methodology explained to test trends. Figure 11 shows the evolution of the accumulated slopes for the floods in the three regions con-sidered. Figure 11b illustrates a clear increase in the num-ber of floods in the littoral in recent years. This curve has a positive slope of nearly 2 floods per century at the end of the series. The observed trend is statistically significant at 95% confidence level following the Monte Carlo procedure (Table 2). However the evolution for the other two regions does not show any appreciable increase. As mentioned in paragraphs above, there is a clear difference in behaviour be-tween the littoral basins, smaller and close to the sea, and the interior or mountainous ones.
4 Summary
A complete flood database has been developed for the en-tire Catalan territory for the 20th century. This geodatabase has been created, as there had not been a previous system-atic reconstruction of flood events that covered the entire re-gion of Catalonia before. A total of 217 flood events have been identified, and examined, by analysis of a wide vari-ety of sources. Significant efforts have also been made to check and validate all the information. 147 flood events in the IBC have been identified and reconstructed for the period 1900–1983; this represents three times the number of events identified for the same period in previous works focusing on the IBC (Comisi´on Nacional de Protecci´on Civil, 1983). Be-sides its wide geographic coverage, this geodatabase also of-fers the advantage of containing updated information up to 2000. As one of the main objectives in this work is to find evidence of a possible increase in the number of floods in the region of study, it is very important to have the information updated at least until year 2000. Previous historical flood re-constructions in Catalonia, such as the compilation done by the National Civil Protection organisation for floods in the Ebro River valley (Comisi´on Nacional de Protecci´on Civil, 1985), or the reconstruction for the IBC contain information finishing before 1990.
In order to store, manage and analyse all the information available, a relational structure has been chosen. This geo-database has been implemented on a GIS, giving rise to the information system called Inungama. The fact that this geo-database has been implemented on a GIS is also an advantage in relation to preceding studies, as it is a more efficient way to store information and to analyse it. In this way it can be a helpful tool aimed to improving flood risk assessment in
ad-Table 2. Trend analysis results of applying the Monte Carlo
tech-nique for the flood frequency in littoral counties of Catalonia. Linear regression 0.017 flood/year
percentile 97.5% 0.011 flood/year percentile 2.5% –0.011 flood/year
dition to vulnerability information and others. Inungama has a great number of climatic and meteorological applications. In this paper some of these climatic applications, concerning spatial and temporal analysis, are shown. Regarding spatial distribution, results show that the most affected areas are lo-cated in the Northeast of Catalonia and in regions with a high population density. Matar´o, in the Maresme basin, where 61 floods have occurred in the last 100 years, is the most affected municipality. These localities on the littoral have a higher concentration of population and in some cases are affected by local convective situations (episodes of type 1) producing flash floods. Concerning the temporal analysis, monthly dis-tribution histograms have been plotted. It has been observed that autumn is the season that concentrates the highest flood-event occurrence in all the Catalonian regions. Fall season floods are mainly identified with convective episodes with heavy rain sustained for several hours. The inland region is mainly affected by episodes of types 2 and 3. The littoral and the Pyrenees regions are affected by all three types of episodes that produce floods. Littoral counties are the most affected by floods.
As one of the major concerns nowadays is the existence of an increase in the number of floods, a trend test has been carried out. This test has shown a smooth increase in the frequency of floods, with a positive slope of 2 floods per century at the end of the series. Due to the fact that in previous studies it had been demonstrated that there was no evidence of rain increase in recent years in the region of study (Barrera et al., 2006), this rise in the number of floods must be due to other factors. One of these factors is greater information coverage. In recent years we have more sources of information, including newspapers, showing some ordi-nary floods that in the past could have gone unnoticed. A second factor is the increase in urbanisation and population density, which makes people more vulnerable to floods. This fact causes damage and sometimes fatalities in places where a similar flood before would not have caused damage. Other factors involved in flooding increase are changes on geomor-phological or hydrological river conditions. The possitive trend observed in the Littoral region is mainly associated with the increase of vulnerability as well as changes in the use of soil as a consequence of the urbanisation and new roads and highways. This increase is not observed in the Pyrenees and Inland regions where no similar changes have taken place. These results are coherent with those obtained
in the framework of the SPHERE project, when a period of more than 400 years was analysed for some specific catchments (Barriendos et al., 2003; Llasat et al., 2005).
Edited by: U. Ulbrich Reviewed by: two referees
References
Aran, M., Ar´us, J., Garc´ıa, C., L´opez, J. M., Satu´e, S., V´azquez, L., and Werner, E.: Las inundaciones del d´ıa 10 de octubre de 1994, IV Simposio Nacional de Predicci´on, Publicaci´on interna del INM, 1999.
Barnolas, M.: Desarrollo de un sistema ACCESS/SIG en el ´ambito de las ciencias de la atm´osfera: Estudio de las inundaciones en Catalunya, 1901–2000, Bachelor of Meteorology Ph.D. Astron-omy & Meteorology programme (biennium 2002–2004) of the University of Barcelona, Internal publication, 2004.
Barnolas, M. and Llasat, M. C.: Aplicaci´on de una herramienta SIG en el estudio de las inundaciones en Catalunya, 1901–2000, Re-vista del aficionado a la Meteorolog´ıa, 28, 2005.
Barrera, A. and Llasat M. C.: Evoluci´on regional de la precipitaci´on en Espa˜na en los ´ultimos 100 a˜nos, Ingenier´ıa Civil, 135, 105– 113, 2004.
Barrera, A., Llasat, M. C., and Barriendos, M.: Estimation of ex-treme flash flood evolution in Barcelona County from 1351 to 2005, Nat. Hazards Earth Syst. Sci., 6, 505–518, 2006,
http://www.nat-hazards-earth-syst-sci.net/6/505/2006/.
Barriendos, M.: El clima hist´orico de Catalunya. Aproximaci´on a sus caracter´ısticas generales (ss. XV-XIX), Department of Phys-ical Geography, University of Barcelona, Spain, Doctoral thesis, 500, 1994.
Barriendos, M., Coeur, D., Lang, M., Llasat, M. C., Naulet, R., Lemaitre, F., and Barrera A.: Stationarity analysis of historical flood series in France and Spain (14th–20th centuries), Nat. Haz-ards Earth Syst. Sci., 3, 583–592, 2003,
http://www.nat-hazards-earth-syst-sci.net/3/583/2003/.
Barriendos, M. and Mart´ın-Vide, J.: Secular Climatic Oscillations as Indicated by Catastrophic Floods in the Spanish Mediter-ranean Coastal Area (14th–19th Centuries), Climatic Change, 38, 4, 473–491, 1998.
Barriendos, M. and Pom´es, J.: L’aigua a Matar´o. Inundacions i recursos h´ıdrics (segles XVIII–XX), Caixa d’Estalvis Laietana, Matar´o, 278, 1993.
Benito, G., D´ıez-Herrero, A., and Fern´andez de Villalta, M.: Mag-nitude and frequency of flooding in the Tagus Basin (central Spain) over the last millennium, Climatic Change, 58, 171–192, 2003.
Benito, G., Lang, M., Barriendos, M., Llasat, M. C., Franc´es, F., Ouarda, T., Thorndycraft, V., Enzel, Y., Bardossy, A., Coeur, D. and Bod´ee, B.: Use of systematic, palaeoflood and historical data for the improvement of flood risk estimation, Nat. Hazards, 31(3), 623–643, 2004.
Berga, L.: La problem´atica de las inundaciones en Catalunya, in: El agua en Catalunya, edited by: Berga, L., 237–256, 1995. Br´azdil, R., Glaser, R., Pfister, C., Dobrovolny, P., Antoine, J. M.,
Barriendos, M., Camuffo, D., Deutsch, M., Enzi, S., Guidoboni, E., Kotyza, O., and Rodrigo, F. S.: Flood events of selected
Euro-pean rivers in the Sixteenth Century Climatic Change, 43, 239– 285, 1999.
Casas Planes, A., Benito, G., D´ıez Herrero, A., and Barriendos, M.: SPHERE-GIS: Implementation of an historical and palaeoflood geographical information system, in: Palaeofloods, Historical Floods and Climatic Variability: Applications in Flood Risk As-sessment (Proceedings of the PHEFRA Workshop, Barcelona, 16th–19th October, 2002), edited by: Thorndycraft, V. R., Ben-ito, G., Barriendos, M., and Llasat, M. C., 363–368, 2003. Comisi´on Nacional de Protecci´on Civil: Estudio de Inundaciones
Hist´oricas. Mapa de Riesgos Potenciales. Cuenca del Pirineo Oriental, 2 volumes, 1983.
Comisi´on Nacional de Protecci´on Civil: Estudio de Inundaciones Hist´oricas. Mapa de Riesgos Potenciales. Cuenca del Ebro, 3 vol-umes, 1985.
D´ıez-Herrero, A., Benito, G., and Lain Huerta, L.: Regional palae-oflood databases applied to flood hazards and palaeoclimate anal-ysis, edited by: Benir, G., Baker, V. R., and Gregory, K. J., Palaeohydrology and Environmental Change, Wiley, Chichester, 335–347, 1998.
Dolz, J.: The problem of floods in Spain. Report of the US-Spanish joint workshop on Natural Hazards, NSF-UPC, Barcelona, 1993. Forte, F., Pennetta, L., and Strobl, R. O.: Historic records and GIS applications for flood risk analysis in the Salento area (southern Italy), Nat. Hazards Earth Syst. Sci., 5, 833–844, 2005, http://www.nat-hazards-earth-syst-sci.net/5/833/2005/.
Glaser, R. and Stangl, H.: Historical floods in the Dutch Rhine Delta, Nat. Hazards Earth Syst. Sci., 3, 605–613, 2003, http://www.nat-hazards-earth-syst-sci.net/3/605/2003/.
Guzzetti, F., Cardinali, M., and Reichenbach, P.: The AVI Project: A bibliographical and archive inventory of landslides and floods in Italy, Environmental Management, 18, 623–633, 1994. Guzzetti, F. and Tonelli, G.: SICI: an information system on
histor-ical landslides and floods in Italy, Nat. Hazards Earth Syst. Sci., 4, 213–232, 2004,
http://www.nat-hazards-earth-syst-sci.net/4/213/2004/.
Kunkel, K. E., Andsager, K., and Easterling, D. R.: Long-Term Trends in Extreme Precipitation Events over the Conterminous United States and Canada, J. Climate, 12, 2515–2527, 1999. Lana, X. and Burgue˜no, A.: Some statistical characteristics of
monthly and annual pluviometric irregularity for the Spanish Mediterranean coast, Theoretical and applied Climatology, 65(1– 2), 79–98. 2000.
Liebmann, B., Vera, C. S., Carvalho, L. M. V., Camilloni, I. A., Ho-erling, M. P., Allured, D., Barros, V. R., B’aez, J., and Bidegain, M.: An observed trend in central South American precipitation, J. Climate, 17, 4357–4367, 2004.
Livezey, R. E. and Chen, W. Y.: Statistical field significance and its determination by Monte Carlo techniques, Mon. Wea. Rev., 111, 46–59, 1983.
Llasat, M. C.: Episodios de lluvias copiosas en Catalu˜na: g´enesis, evoluci´on y factores coadyuvantes, Doctoral Thesis, University of Barcelona, no. 40, Barcelona, Spain, 543, 1987.
Llasat, M. C: Gota fr´ıa, Ed. Marcombo, (colec.Boixareu Universi-taria), no. 6, Barcelona, Espa˜na, 165, 1991.
Llasat, M. C.: An objective classification of rainfall events on the basis of their convective features. Application to rainfall inten-sity in the North-East of Spain, Int. J. Climatol., 21, 1385–1400, 2001.
Llasat, M. C.: La vuln´erabilit´e en Catalogne. Colloque SHF. Crues M´editerran´eennes. Nimes, Juin 2004 (Publications S. H .F.), 29– 34, 2004.
Llasat, M. C., Barriendos, M., Barrera, T., and Rigo, T.: Floods in Catalonia (NE Spain) since the 14th century. Climatological and meteorological aspects from historical documentary sources and old instrumental records, J. Hydrol., 313, 32–47, 2005.
Llasat, M. C. , Mart´ın, F., and Barrera, A.: From the concept of “kaltluftropfen” (cold air pool) to the cut-off low. The case of September 1971 in Spain as an example of their role in heavy rainfalls, Meteorol. Atmos. Phys., 96, 43–60, 2007.
Llasat, M. C. and Puigcerver, M.: Total Rainfall and Convective Rainfall in Catalonia, Spain, Int. J. Climatol., 17, 1683–1695, 1997.
Llasat, M. C. Rigo, T., and Montes, J. M.: Orographic role in the temporal and spatial distribution of precipitation. The case of the Internal Basins of Catalonia (Spain), Proceedings of the EGS Plinius Conference on Mediterranean Storms held at Maratea, Italy, 14–16 October 1999, GNDCI Publ. n. 2012, 41–55, 2000. Llasat, M. C., Rigo, T., and Barriendos, M.: The ‘Montserrat-2000’
flash-flood event in comparison with spring floods in the North-east of the Iberian Peninsula since the 14th century, Int. J. Clima-tol., 23, 453–469, 2003.
Llasat, M. C. and Rodriguez, R.: Extreme rainfall events in Cat-alonia: the case of 12 November 1988, Nat. Hazards Earth Syst. Sci., 5, 133–151, 1992,
http://www.nat-hazards-earth-syst-sci.net/5/133/1992/.
Naulet, R., Lang, M., Coeur, D., and Gigon, C.: Collaboration be-tween historians and hydrologists on the Ardeche river (France). First step: Inventory of Historical Flood Information. Advances in Natural and Technological Hazards Research, Vol. 17 “The Use of Historical Data in Natural Hazard Assessments”, edited by: Glade, T., Albini, P., and Frances, F., Kluwer Academic Pub-lishers, Dordrecht, 113–129, 2001.
Novoa, M.: Episodio del 12 de octubre de 1907 en la cuenca del r´ıo Cardener. Direcci´on General de Obras Hidr´aulicas. Comisar´ıa de Aguas del Pirineo Oriental. Servicio de Aforos, Ministerio de Obras P´ublicas y Urbanismo, Espa˜na, 110, 1981.
Petrucci, O. and Versace, P.: Conoscere il passato per prevedere il futuro,Dipartimento Protezione Civile Informa, 29, 25–26, 2000. Ramis, C., Alonso, S., and Llasat, M. C.: A comparative study be-tween two cases of extreme rainfall events in Catalonia, Surveys in Geophysics, 16, 141–161, 1995.
Ramis, C., Llasat, M. C., Genov´es, A., and Jans`a, A.: The October-1987 floods in Catalonia: synoptic and mesoscale mechanisms, Meteorological Applications, 1, 337–350, 1994.
Rigo, T.: Study of Occidental Mediterranean Convective Mesoscale Systems using meteorological radar (in Spanish), Doctoral The-sis, University of Barcelona, Internal publication, 2004. Rigo, T., Batlle, J., and Llasat, M. C.: Una comparaci´on de
episo-dios de inundaciones en Catalu˜na no oto˜nales (junio 2000, sep-tiembre 1996 y enero 1996), Publicaciones de la Asociaci´on Espa˜nola de Climatolog´ıa (AEC), Serie A, 2, 401–412, 2001. Rigo, T. and Llasat, M. C.: A winter flood event in Spain: The
January 1996 case, Geophys. Res. Abstr., European Geophysical Society, 2, 2000.
Rigo, T. and Llasat, M. C.: A methodology for the classification of convective structures using meteorological radar, Nat. Hazards Earth Syst. Sci., 4, 59–68, 2004,
http://www.nat-hazards-earth-syst-sci.net/4/59/2004/.
Rigo, T. and Llasat, M. C.: Radar analysis of the life cycle of Mesoscale Convective Systems during the 10 June 2000 event, Nat. Hazards Earth Syst. Sci., 5, 959–970, 2005,