HAL Id: hal-02638189
https://hal.inrae.fr/hal-02638189
Submitted on 28 May 2020
HAL is a multi-disciplinary open access
archive for the deposit and dissemination of sci-entific research documents, whether they are pub-lished or not. The documents may come from teaching and research institutions in France or abroad, or from public or private research centers.
L’archive ouverte pluridisciplinaire HAL, est destinée au dépôt et à la diffusion de documents scientifiques de niveau recherche, publiés ou non, émanant des établissements d’enseignement et de recherche français ou étrangers, des laboratoires publics ou privés.
Structural and Functional Partitioning of Bread Wheat
Chromosome 3B
Frédéric Choulet, Adriana Alberti, Sébastien Theil, Natasha Marie Glover,
Valérie Barbe, Josquin Daron, Lise Pingault, Pierre Sourdille, Arnaud
Couloux, Etienne Paux, et al.
To cite this version:
Frédéric Choulet, Adriana Alberti, Sébastien Theil, Natasha Marie Glover, Valérie Barbe, et al.. Struc-tural and Functional Partitioning of Bread Wheat Chromosome 3B. Science, American Association for the Advancement of Science, 2014, 345 (6194), �10.1126/science.1249721�. �hal-02638189�
Version preprint
Title: Structural and Functional Partitioning of Bread Wheat Chromosome 3B
Authors: Frédéric Choulet1,2, Adriana Alberti3, Sébastien Theil1,2, Natasha Glover1,2, Valérie
Barbe3, Josquin Daron1,2, Lise Pingault1,2, Pierre Sourdille1,2, Arnaud Couloux3, Etienne
Paux1,2, Philippe Leroy1,2, Sophie Mangenot3, Nicolas Guilhot1,2, Jacques Le Gouis1,2,
Francois Balfourier1,2, Michael Alaux4, Véronique Jamilloux4, Julie Poulain3, Céline Durand3,
Arnaud Bellec5, Christine Gaspin6, Jan Safar7, Jaroslav Dolezel7, Jane Rogers8, Klaas
Vandepoele9, Jean-Marc Aury3, Klaus Mayer10, Hélène Berges5, Hadi Quesneville4, Patrick
Wincker3,11,12, Catherine Feuillet1,2
Affiliations:
1INRA UMR1095 Genetics, Diversity and Ecophysiology of Cereals, 5 chemin de Beaulieu,
63039 Clermont-Ferrand, France
2University Blaise Pascal UMR1095 Genetics, Diversity and Ecophysiology of Cereals, 5
chemin de Beaulieu, 63039 Clermont-Ferrand, France
3CEA/DSV/IG/Genoscope, 2 rue Gaston Crémieux, 91000 Evry, France
4INRA, UR1164 URGI Research Unit in Genomics-Info, INRA de Versailles, Route de
Saint-Cyr, Versailles, 78026, France
5Centre National des Ressources Génomiques Végétales, INRA UPR 1258, 24 chemin de
Borde Rouge, 31326 Castanet-Tolosan, France
6Biométrie et Intelligence Artificielle, INRA, Chemin de Borde Rouge, BP 27, 31326
Castanet-Tolosan, France
7Centre of the Region Haná for Biotechnological and Agricultural Research, Institute of
Experimental Botany, Slechtitelu 31, CZ-78371 Olomouc, Czech Republic
Version preprint
9 Department of Plant Systems Biology (VIB) and Department of Plant Biotechnology and
Bioinformatics (Ghent University), Technologiepark 927, 9052 Gent, Belgium
10 MIPS/IBIS, Helmholtz Zentrum Muenchen, D-85764 Neuherberg, Germany
11CNRS UMR 8030, 2 rue Gaston Crémieux 91000 Evry, France
12Université d’Evry, CP5706 Evry, France
*Correspondence to: [email protected]
Abstract:
We produced a reference sequence of the 1 Gb chromosome 3B of hexaploid bread wheat. By
sequencing 8,452 Bacterial Artificial Chromosomes in pools we assembled a sequence of
774 Mb carrying 5,326 protein-coding genes, 1,938 pseudogenes, and 85% of transposable
elements. The distribution of structural and functional features along the chromosome
revealed partitioning correlated with meiotic recombination. Comparative analyses indicated
high wheat specific inter- and intra-chromosomal gene duplication activities that are potential
sources of variability for adaption. In addition to providing a better understanding of the
organization, function, and evolution of a large and polyploid genome, the availability of a
high quality sequence anchored to genetic maps will accelerate the identification of genes
underlying important agronomic traits.
One Sentence Summary: The reference sequence of the bread wheat chromosome 3B reveals partitioning of structural and functional features along the chromosome.
Version preprint
Main text:
Introduction: Bread wheat (Triticum aestivum L.) is a staple food for 30% of the world
population. It is a hexaploid species (6x=2n=42, AABBDD) that originates from two
interspecific hybridizations estimated to have taken place ~0.5 million and 10,000 years ago
(1). The predicted closest extant representatives of the ancestral parental diploid species
(2n=14) are Triticum urartu (A genome), Aegilops speltoides (S genome related to the B
genome) and Aegilops tauschii (D genome). Each of the three ancestral genomes is about
5.5 Gb in size and, therefore, results in a highly redundant 17 Gb hexaploid genome with 3
homoeologous sets of 7 chromosomes (1-7A, 1-7B, 1-7D) each carrying highly similar gene
copies. Moreover, most of the genome was shaped by the amplification of transposable
elements (TEs) that include highly repeated families and sequences (2). This high redundancy
has complicated the assembly of a complete and properly ordered reference sequence of the
bread wheat genome. A fully sequenced genome enables scientists and breeders to have
access to a complete gene set, with the gene order along each chromosome, and identify
candidate genes between markers associated with important traits. It also enables the
identification of recent duplicates, which may be involved in species-specific evolution (3),
and to trace their evolutionary history. Prior to obtaining a full genome sequence, the wheat
gene space has been investigated through various genome and transcriptome survey
sequencing approaches and through microarray hybridizations (4-7). Recently, whole genome
shotgun sequencing of cv. Chinese Spring using Roche/454 technology and synteny driven
assembly yielded around 95,000 gene models (N50=0.9 kb; (8)). Furthermore, the gene space
of the diploid wild relatives Ae. tauschii (DD) and T. urartu (AA) has also been assembled
and led to describe 43,150 and 34,879 genes, respectively (9, 10). While these sequences are
useful templates for marker design and comparative analyses, as a result of assembly
Version preprint
fraction of the genes are unanchored to chromosomes. The maize (Zea mays) and potato
(Solanum tuberosum) sequencing projects, both representing species with highly repetitive
genomes, were able to avoid over-fragmentation by combining multiple sequencing
technologies and through the use of DNA libraries with a diversity of insert sizes (13, 14).
The International Wheat Genome Sequencing Consortium (IWGSC) road map focuses
on physically mapping and obtaining a high quality reference sequence of each of the 21
individual wheat chromosomes rather than approaching the hexaploid genome as a whole.
This strategy relies on flow sorting individual chromosomes and/or chromosome arms from
ditelosomic lines of the cultivar Chinese Spring to construct BAC libraries (15). The largest
chromosome is 3B (~1 Gb). It was the first chromosome for which a BAC library was
constructed (16) and a physical map achieved (17). A pilot sequencing study on 13 contigs (2)
suggested that genes tend to be mainly clustered into small islands, the presence of a 2-fold
gene density increase from the centromere towards the telomeres, and a high proportion of
nonsyntenic genes interspersed within a conserved ancestral grass gene backbone. It provided
a proof of principle for this strategy and opened the way for producing a reference sequence
of the large and polyploidy wheat genome.
Sequencing and construction of a pseudomolecule: We used a hybrid sequencing
and BAC pooling strategy to sequence 8,452 BAC clones from the minimal tiling path (MTP)
that was established during the construction of the chromosome 3B physical map (4, 18).
After the integration of BAC-end sequences, manual curation of the scaffolding, gap filling
and correction of potential sequencing errors (18), we obtained a final assembly of 2,808
scaffolds representing 833 Mb with a N50 of 892 kb (i.e. half of chromosome sequence is
assembled in scaffolds larger than 892 kb). We estimated that about 6% of the chromosome
Version preprint
DNA (19). This suggests that the size of chromosome 3B is nearly 886 Mb i.e. about 11%
smaller than originally predicted (16, 20). We built a pseudomolecule of chromosome 3B by
ordering 1,358 scaffolds along the chromosome using an ordered set of 2594 anchor Single
Nucleotide Polymorphism (SNP) markers. The pseudomolecule represents 774.4 Mb (93% of
the complete sequence) with a scaffold N50 of 949 kb (Table S1). The order of markers was
determined by linkage analysis of a recombination inbred lines (RILs) population derived
from a cross between T. aestivum cultivars Chinese Spring (reference sequence) and Renan (a
French elite cultivar) and refined by integrating linkage disequilibrium data from two panels
and physical BAC contig information (18). This sequence corresponds to an
annotation-directed improved high-quality draft (21) situated between the high quality finished rice
genome sequence and the improved draft maize genome (13).
Annotation of Genes, Transcribed Loci and Transposable Elements: Gene
modeling led to predict 7,264 coding loci on the 3B pseudomolecule (Table 1), including
5,326 with a functional structure and 1,938 (27%) likely corresponding to pseudogenes. An
additional 251 gene models and 188 pseudogenes were annotated in unanchored scaffolds.
RNA-Seq data revealed that 71.4% of the predicted genes/pseudogenes are transcribed and led
to identify 3,692 unannotated transcribed loci that may encode functional non-coding RNAs
or unknown proteins, hereafter referred to as novel transcribed regions (NTRs, Table 1). In
addition, 791 highly conserved non-coding RNA genes involved in RNA maturation and
protein synthesis were also predicted (Table 1). Chromosome 3B appears to contain a high
number of small nuclear RNA genes (U1 to U6) including 9 U1-snRNAs, 7 of which are
tandemly duplicated. As a comparison, there are 14 U1-snRNAs in the entire Arabidopsis
thaliana genome (www.plantgdb.org). The higher number of U1-snRNAs may reflect a
higher level of duplication in the wheat genome. We found 53,288 complete and 181,058
Version preprint
representing 85% (640 Mb) of the 3B pseudomolecule, through similarity-search approach.
Further de novo repeat detection (18) identified 3.6% putatively new TEs.
We estimated the putative location of the centromeric region by plotting the density of
the Long Terminal Repeats retrotransposons (LTR-RTs) CRW (Centromeric
Retrotransposons of Wheat) and Quinta along the pseudomolecule. These LTR-RTs are
recognized by the centromere-specific histone CenH3, and thus are centromere-functional
sequences (22). Two major peaks covering a region of 122 Mb (265-387 Mb, Fig. S1) that
includes 1 Mb previously shown as interacting with histone CenH3 (22) and encompassing
the centromere of the orthologous rice chromosome 1 (23) were identified. This region was
defined as the centromeric-pericentromeric region of chromosome 3B. A strong correlation
has been observed between the size of the centromeres and the chromosomes in grasses (24)
and it is likely that large chromosomes have centromeres larger than 10 Mb. This may be
critical to ensure the structural rigidity of the pericentromeric regions needed for kinetochore
co-orientation (25). Marker assignation to either short or long arm indicated the presence of a
break point between 349.4 and 350.0 Mb that might be the position of the core centromere.
Variability in Recombination Rate and Gene Density Along the Chromosome: We
found 787 crossover (CO) events on chromosome 3B in the Chinese Spring x Renan
population with on average 2.6 COs per chromosome per individual, which is similar to maize
(2.7-3.4; (26)). Distribution of meiotic recombination rate revealed extreme variations along
the chromosome. While the average recombination rate is 0.16 cM/Mb, actual values range
from 0 to 2.30 cM/Mb (per 10 Mb window; Fig. 1A). Segmentation analysis (18) revealed
partitioning with the two distal regions of 68 Mb (region R1) and 59 Mb (region R3) on the
short and long arms, respectively, showing recombination rates of 0.60 cM/Mb and 0.96
cM/Mb on average, and a large proximal region of 649 Mb (region R2) spanning the
Version preprint
provides insight in the actual physical size of the highly recombinogenic regions previously
detected at the end of the wheat chromosomes (27, 28). When a narrower window of 1 Mb
was used, variations ranged from 0 to 12 cM/Mb (Fig. 1A), a range similar to that observed in
maize (0.8-11.5 cM/Mb; (26)) and sorghum (0-10 cM/Mb; (29)). All crossover events
occurred in only 13% of the chromosome in our population of 305 individuals. The largest
region totally deprived of recombination corresponds to 150 Mb that includes the putative
122 Mb centromeric-pericentromeric region. This was confirmed by the linkage
disequilibrium (LD) pattern (Fig. S2). Twenty-two regions showed a recombination ratio
higher than 1.6 cM/Mb i.e. >10 times the average for this chromosome, and, thus, may
contain recombination hot spots (Fig. 1A). However, no significant correlation was observed
between the recombination rate and gene content, coding DNA, or TE content of these
regions.
The 7,264 genes are not evenly distributed and gene density is increasing on both arms
along the centromere-telomere axis correlating with the distance to the centromere (rs=0.79,
P<2.2e-16, R2=0.61; Fig. 1B). Using a 10 Mb window, the average gene density estimate is
9±5 genes/Mb ranging from 1.3 in the centromeric-pericentromeric region up to 27.9 at the
most telomeric end of the short arm, a pattern commonly observed in grass genomes.
Variation of the gene density in wheat chromosome 3B is higher than for chromosomes in the
more compact rice genome (30), lower than in sorghum where genes are mostly found in the
telomeric regions (31), and in the same range as in maize which also contains a high
percentage of TEs (13). Segmentation analysis revealed five major regions with contrasted
gene densities (Fig. 1B) and a four-fold gradient of the gene density i.e. twice as much as
suggested by the pilot study on chromosome 3B (2). The distal segments exhibiting the
highest gene density (19 genes/Mb) correspond nearly to the highly recombinogenic R1 and
Version preprint
density (5 genes/Mb) in a 234 Mb segment encompassing the centromeric-pericentromeric
region. As previously suggested (2, 4), there is no large region completely devoid of coding
sequence (maximum of 3.7 Mb). We confirmed that the intergenic distances (IGDs) are
extremely variable (average 104 kb+/-190 kb) and that a majority (73%) of the genes are
organized in small islands, or “insulae” (32). This suggests that most of the intergenic regions
are under selective constraint prevented from TE insertion. Indeed, only 29% of the IGDs are
larger than 104 kb but they account for 81% of the chromosome size, demonstrating that
TE-mediated genome expansion likely occurred within a limited number of intergenic regions.
Relationships Between Gene Expression, Function, and Chromosome Location:
Of all annotated genes on chromosome 3B, 71.4% are expressed in at least one of the 15
conditions analyzed (5 organs at 3 developmental stages each; Table S2), 33% in all
conditions, and 5% in one only (Fig. S3). On average, genes are expressed in 10.8 of 15
conditions (considering all predictions) and expressed genes are transcribed into 5.8
alternative transcripts, or isoforms. Both the expression breadth and the average number of
isoforms are distributed unevenly along the chromosome, with a clear decrease of the two
parameters towards the telomeres (Fig. 1C-D). Segmentation revealed distal segments with
boundaries similar to that of regions R1 and R3 and with genes expressed in fewer conditions
than in the proximal region: 8.7 versus 11.7, respectively (p-value<2.2e-16, Welch t-test;
Table 2). Similarly, the average number of alternative transcripts is higher in the proximal
(6.5) than in the distal (4.3) regions (p-value<2.2e-16, Welch t-test; Table 2).
Gene ontology (GO) term enrichment was estimated for the R1, R2 and R3 regions
(18) (Tables S3-5). The distal regions are enriched in many GO categories, some being related
to adaptation ("response to abiotic stimulus", "response to stress"). Well-known examples of
genes related to adaptation are those involved in resistance to pathogens. Chromosome 3B
Version preprint
highly biased with 135 (79%) of them located in the distal regions (while these regions
contain 33% of the gene set). Such uneven distribution and the correlation with the
distribution of crossovers suggest that meiotic recombination acts as a main driver for creating
variability in distal regions of chromosome 3B.
To investigate whether such partitioning is a common pattern of large plant genomes,
we analyzed the distribution of the gene expression breadth in maize and barley that both
exhibit large genome size (>1 Gb) and increased recombination rates at chromosomal
extremities (33, 34). In barley, segmentation analysis of the 7 chromosomes based on
recombination data identified the same pattern as on chromosome 3B with two highly
recombinogenic distal regions and a large non-recombinogenic region. Using expression data
of 8 conditions (34), we also observed that the two high-recombination distal regions carry
genes expressed in fewer conditions than those carried by the low-recombination proximal
regions (5.9 versus 6.7; p-value=2.2e-16, Welch t-test; Fig. S4A). Using GO-terms, we found
a significant enrichment of these regions in categories "cell death" and "defense response"
which support previous findings that barley disease resistance genes are clustered in the distal
regions (34), In contrast, in maize, although we observed partitioning of the recombination
rate, no gene expression partitioning was detected using RNA-Seq data of 18 conditions (35).
Overall the expression breadth is 13.2 and 12.7 in high and low recombination regions,
respectively, with chromosome specific patterns (Fig. S4B). Nevertheless, high recombination
regions are also enriched in GO categories "cell death" and "defense response to fungus and
bacteria" suggesting that such genes are consistently found in distal recombinogenic regions
in large plant genomes. These results suggest that the partitioning observed on wheat
chromosome 3B is conserved in the Triticeae and may not reflect a general pattern of large
Version preprint
genome have modified this pattern. Additional evidence will come once other large plant
genomes (1 Gb) are sequenced and analyzed.
Uneven Distribution of Transposable Elements: LTR-RTs represent 66% of the
chromosome 3B sequence (gypsy: 47%, copia: 16%, unclassified: 3%; Table 1) which is
slightly lower than the ~75% of LTR-RT identified in the whole maize genome (36). Only 4%
(3/85) of the LTR-RT families were found in single copies compared to 41% in maize (36)
and 48% in the rice genome (37). Sixteen percent of the sequence is comprised of Class II
DNA transposons that mostly correspond to CACTA elements (Table 1), compared to 3.2% in
the maize genome (13). Only 6 families account for 50% of the wheat chromosome 3B TE
fraction as previously suggested from partial sequence analyses (2, 38) and from observations
in other large genomes (36). However, in contrast to the maize genome in which most of the
intact elements are found in 1-10 copies (36), the majority of the TE families annotated on
chromosome 3B has a higher number of copies (10 to 1000 copies). Estimated insertion dates
for the most abundant LTR-RT families showed a major peak at 1.5 million years (MY) but
also quite specific patterns of TE activity for each family (Fig. S5). Our data support the
hypothesis (2, 38) that most of the transposable elements that shaped the B genome inserted
before polyploidization (0.5 million years ago (MYA)) and have been less active since then.
Distribution of recently inserted elements revealed that TE insertion occurred at a similar rate
in the distal and proximal regions. In contrast, older insertions (>1.5 MYA) were 1.7 fold
more abundant in the R2 region compared to the R1 and R3 regions, suggesting a higher rate
of TE elimination in the distal ends of chromosome 3B.
The TE density distribution was not random (Fig. 1E) with a lower density in the R1
(73%) and R3 (68%) regions compared to the R2 region (88%, Table 2). The 122 Mb
centromeric-pericentromeric region displayed the highest density (93%) of TEs. Beneath the
Version preprint
example, CACTA transposons are more abundant in the distal gene-rich regions (Table 2),
supporting in situ hybridization findings at the whole genome level (39). In addition, the
distribution of TE families varied on the basis of their relative distance to genes (18) (Fig. S7).
DNA transposons Mutator, Harbinger and MITEs are found in close vicinity to genes whereas
LTR-RTs and CACTAs tend to be located at much larger distances from the genes. For
instance, the 17,479 annotated MITEs were significantly found associated with genes (r=0.89;
p-value<1e-10) as previously observed in plant genomes (40).
Synteny Between Chromosome 3B and Related Grass Genomes: Comparative
genomics in grasses has been used to define syntenic relationships between different species
(41, 42) and to provide insight into their evolution since the divergence from a common
ancestor 50-70 MYA (43). We compared the wheat chromosome 3B genes (Ta3B) with the
closest sequenced relative, Brachypodium distachyon (common ancestor: 32-39 MY; (44)),
and with one representative of each of the Ehrhartoideae and Panicoideae grass subfamilies:
Oryza sativa indica (rice, (30)) and Sorghum bicolor (31), respectively. Wheat chromosomes
of group 3 are syntenic with chromosome 1 of rice (Os1), chromosome 3 of sorghum (Sb3),
and the distal parts of B. distachyon chromosome 2 (Bd2). We first investigated potential gene
loss following polyploidization by using the conserved and syntenic genes found on
chromosomes Os1, Bd2 and Sb3. These represent the grass core genes that are expected to be
present on wheat homoeologous group 3, unless they have been lost by fractionation
following polyploidization. The finding that 94% of the conserved genes are also present on
the 3B sequence (Fig. 2A), which represents 94% of the chromosome (see above), suggests
that no major gene loss occurred in the B subgenome yet. This is confirmed at the whole
genome level by the results of the chromosome survey sequences (19). In contrast, 2,065
genes on chromosome 3B (34.6%; including pseudogenes) shared similarity with genes on
Version preprint
genes is much higher than the 5% (between 149 and 207) of nonsyntenic genes found in the
other grass species analyzed (Fig. 2A, Table S6). It confirms previous results showing
substantial modifications and rearrangements of the wheat gene space (2). When looking at
the conservation of the gene order, collinear genes represent 42 to 68% of the genes present
on Os1, Bd2 and Sb3, whereas they represent less than 30% of the Ta3B genes (including
pseudogenes; Table S7 and Fig. S8). The spatial distribution of syntenic and nonsyntenic
genes along the 3B pseudomolecule (Fig. 2B) shows an increased proportion of nonsyntenic
genes in the R1 (44%) and R3 (53%) regions compared to the R2 region (28%; Table 2). This
supports the hypothesis that accelerated evolution occurred in the wheat lineage compared to
other grasses (2, 45, 46) with insertions of nonsyntenic genes intercalated in the ancestral
grass genome backbone via gene duplications or translocations that preferentially occurred in
the distal recombining regions.
Origin and Evolution of Nonsyntenic Genes: With such a high proportion of
nonsyntenic genes, one key question is whether these genes are under selection pressure or in
the process of becoming pseudogenes. On the basis of the coding sequence structure, 32% of
the nonsyntenic genes (vs. 17% of syntenic genes) were annotated as likely pseudogenes or
gene fragments. This ratio is not surprising given that TE activity can duplicate gene
fragments that are dead upon arrival. Expression patterns revealed that a majority of the
nonsyntenic genes (69% vs. 82% of syntenic genes) are expressed in at least one condition
tested (Table S8) thereby suggesting that a large fraction of these relocated genes are unlikely
to be pseudogenes and may contribute to recent wheat genome evolution, and, therefore, to
adaptation. Interestingly, a majority (51%) of the genes expressed in a single condition
corresponds to nonsyntenic genes whereas 80% of the genes that are expressed in all 15
conditions are syntenic genes (Fig. S9). This suggests that nonsyntenic genes are involved in
Version preprint
with essential biological processes. This hypothesis is supported by the fact that putative
resistance genes identified on chromosome 3B are mainly nonsyntenic genes (18). In addition,
GO term enrichment of nonsyntenic genes revealed an overrepresentation of genes involved
in response to stress (Table S9).
The fact that chromosome 3B exhibits a higher number of genes than its orthologs in
other grasses and that at least 94% of the ancestral grass gene backbone is conserved, indicate
that most insertions of nonsyntenic genes result from inter-chromosomal duplication with
retention of the parental copy. To test this hypothesis, we used the sequences of the 18 bread
wheat chromosomes non-homoeologous to group 3 chromosomes (19) to search for potential
parental copies of chromosome 3B genes elsewhere in the genome (18) (Table S10). A
paralog was identified for 87% of the nonsyntenic genes (18), with no bias regarding the
chromosomal origin of the inter-chromosomally duplicated genes (Fig. S10). Duplications of
DNA fragments to different locations in a genome have been shown to result from double
strand break (DSB) repair (in which a copy of the foreign DNA is used as filler to repair the
break) or capture by active TEs (46, 47). We analyzed the composition of the regions flanking
the syntenic versus nonsyntenic genes (20 kb on each side) and found a high association of
nonsyntenic genes with a class II transposon superfamily: 41% more CACTAs were found
around nonsyntenic genes than around syntenic genes (Fig. S11). CACTA transposons are
known to capture genes (31, 48) and may have contributed significantly to inter-chromosomal
gene duplications in wheat.
We also investigated the time since duplication of nonsyntenic genes via the analysis
of nucleotide substitution rates (Ks) (18). In total, 62% of these duplications were older than
10 MY and, thus, are likely shared within other Triticeae species whereas 37% are potentially
wheat-specific. Comparison with the barley genome survey sequence data (34) showed that at
Version preprint
barley chromosome 3H, confirming that part of the nonsyntenic genes were relocated before
the divergence of wheat and barley 10 to 14 MYA.
We next asked if the high gene duplication activity is also observed at the
intra-chromosomal level. We identified 809 gene families with two or more copies comprising
2,216 genes on chromosome 3B, which is about 3 times more than in rice, Brachypodium, and
sorghum (Table S11). This indicates that, in proportion, more than twice as many genes were
duplicated or retained after intra-chromosomal duplications in wheat (~37%) compared to the
other three grasses (~15-18%). About 46% of the duplicated genes of chromosome 3B are
found in tandem whereas 54% are dispersed duplicates ((18); Table S12). In other grass
species, a majority of the duplicated genes are organized in tandem. Given the high
inter-chromosomal duplication activity observed in our analyses (see above), it is possible that
some dispersed duplicates on chromosome 3B originated via independent inter-chromosomal
duplications rather than through intra-chromosomal duplications thereby leading to
overestimate these latter. However, even when considering syntenic dispersed duplicates, i.e.
those genes that have remained at their ancestral locus and have undergone
intra-chromosomal duplication, 23% of the whole gene set appears to have originated from recent
intra-chromosomal duplications which is still higher than in other grass species. Thus, we
conclude that both inter- and intra-chromosomal rates of duplication are higher in wheat than
in the other grass species analyzed so far. Interestingly, inter-chromosomal duplicates were
distributed uniformly along the chromosome whereas the proportion of tandem duplicates
slightly increased in the distal regions (Fig. 2D). This suggests that long distance and tandem
duplications likely arose through different mechanisms. Finally, expression analysis of
intra-chromosomal duplicated genes indicated that 49% of the families show expression of all
copies in at least one condition. Similar to what was observed for the inter-chromosomal
Version preprint
conditions as compared to non-duplicated genes (Fig. S9; Table S8), suggesting they may be
undergoing subfunctionalization.
QTL mining: As exemplified in rice and other crops, a reference genome sequence
provides a resource for gene discovery, marker development, and allele mining in support of
crop improvement (49). We identified 153,190 and 35,579 Insertion Site-Based
Polymorphism (ISBP; (50)) and microsatellite markers, respectively, along the 3B
chromosome. We also located 121 quantitative trait loci (QTLs) for 50 different traits on
chromosome 3B (Table S13). Using these data, we conducted a meta-analysis that integrates
QTLs defined in independent studies (51) and identified 18 metaQTLs with confidence
intervals covering between 1.5 and 620 Mb of the chromosome 3B sequence. The largest one
encompasses the centromeric region where recombination is suppressed. Five metaQTLs with
small intervals (<10 Mb) that contain between 23 and 266 protein-coding genes and between
511 and 4,049 markers are suitable for fine mapping (Table S14).
Discussion: We present a reference sequence of chromosome 3B that can be used to
precisely delineate structural and functional features along a chromosome and establish
correlations between recombination intensity, gene density, gene expression, and evolution
rate. Our results indicate that during evolution, regions with distinct features become
delineated along chromosome 3B, including relatively small distal regions that are preferential
targets for recombination, adaptation and genomic plasticity. Whether our observations reflect
a general pattern for the wheat genome will need to be confirmed by the analysis of other
chromosome reference sequences. Already, some of the features such as the CACTA
distribution, the high rate of intra-chromosomal duplication, the absence of major gene loss
since polyploidization and the gradient of gene density have been confirmed at the whole
genome level (19, 39). Moreover, the ordered chromosome 3B sequence allowed us to
Version preprint
duplications. The high level of gene duplication (allopolyploidy, inter- and intra-chromosomal
duplications) provides the wheat genome with a vast reservoir of functional genes that likely
contribute to wheat adaptation.
On the basis of this work, the IWGSC has already defined an adapted BAC pooling
strategy to reach the same sequence quality while reducing sequencing cost for the remaining
chromosomes. While progress in sequencing technologies and cost reductions allow for more
cost efficient sequence production, the challenge of bioinformatics and limitations of current
sequencing technologies remain (12). Solving this issues and improving methods to efficiently
anchor and orientate scaffolds within pseudomolecules should make the assembly of high
quality reference sequences of complex genomes routine work in the future. There is no doubt
that, as witnessed after the release of the rice genome sequence (49), the number of genes
cloned from wheat will grow exponentially in the near future thereby enabling wheat
researchers and breeders to cope with the urgent need of improving wheat yield in the face of
climate change and food security challenges (52).
Materials and Methods:
Sequencing, assembly and scaffolding: 8452 BACs representing the Minimal Tiling
Path of wheat chromosome 3B were pooled into 922 BAC-pools. Each pool was used to
create a barcoded Roche/454 8-kb long paired-end library. In total, 150 sequencing runs were
performed, leading to an average of 36-fold sequence coverage. After assembly with Newbler
(Roche), we integrated 42,551 BAC end sequences to validate and improve scaffolding.
Illumina reads generated from sorted DNA of chromosome 3B were used to fill gaps within
Version preprint
Anchoring scaffolds: SNP discovery was performed through sequence capture for
52,265 loci flanking TE junctions representing an average density of one locus per 16.2 kb
(18). Out of 39,077 SNPs distributed along the chromosome, a subset of 3,075 evenly
distributed (38.2+/-9.4 SNPs/10 Mb) SNPs was selected to genotype 1025 lines from
recombination inbred and association panels. An anchor genetic map was built first by linkage
analysis and integration of linkage disequilibrium data. A consensus map comprising 5,318
markers was also built using 40 different genetic maps to anchor additional scaffolds (18).
Finally, a position in the pseudomolecule was inferred for scaffolds without marker
information but belonging to an anchored physical BAC contig.
Sequence annotation: Gene modeling was performed using an improved version of
the TriAnnot pipeline (53). Non-coding RNA genes were predicted using three different
programs (18) and predictions were manually curated. Predictions of transposable elements
(TEs) and reconstruction of the pattern of nested insertions were performed through the
development a of specific program (18) that automatically curate similarity-search results
obtained with a dedicated databank, comprising 4,929 known wheat TEs classified into 521
families.
Gene expression analyses: Thirty RNA samples, corresponding to RNAs extracted in
duplicates from five organs (root, leaf, stem, spike, and grain) at three developmental stages
each from hexaploid wheat cv. Chinese Spring (4), were used for gene expression analyses.
RNA-Seq libraries were constructed using the IlluminaTruSeqTM RNA sample preparation Kit
and sequenced. An average of 50+/-11 million paired end reads per sample were mapped on
the chromosome 3B scaffolds and used to reconstruct transcripts and estimate transcript
abundance in units of fragments per kb of exon per million mapped reads (FPKM). Regions
Version preprint
Distribution and segmentation analyses: Distributions of recombination rate, gene
and TE densities, and expression breadth, were calculated within a sliding window of 10 Mb
(and 1 Mb for the recombination rate) with a step of 1 Mb along the chromosome sequence
using a homemade Perl script. Segmentation analyses of these distributions were performed
using the R package changepoint v1.0.6 (54) with Segment Neighbourhoods method and BIC
penalty on the mean change.
Comparative genomics, gene duplications and molecular evolution: We performed
an all-by-all BLASTP (cutoff Evalue: 1e-5) comparison between the amino-acid sequences of
predicted genes of wheat chromosome 3B, rice (MSU version 7.0), Brachypodium
(Brachypodium Sequencing Initiative, 2.0), and sorghum (phytozome, version 1.4). We
filtered out genes with no homology with at least one other gene in a compared species (cutoff
35% amino acid identity and 35% sequence overlap). Syntenic genes were defined as genes
with a reciprocal best BLAST hit on an orthologous chromosome in at least one other species.
Nonsyntenic genes were defined as genes for which best BLAST hit was on a
non-orthologous chromosome in the other species. Clustering of non-orthologous and paralogous genes
was performed using OrthoMCL (e-value cutoff: 1e-5, percent match cutoff: 35%; (55). All
3B genes clustered into the same family were considered intra-chromosomal duplicates. 3B
genes clustered in a family with wheat gene models annotated on another chromosome (19),
not including genes from group 3, were considered as inter-chromosomal duplicates. Tandem
duplicates were defined as genes in the same family with 5 or less spacer genes separating
them on the pseudomolecule, and dispersed duplicates were defined as having more than 5
spacer genes. Synonymous (Ks) and nonsynonymous (Ka) substitution rates were calculated
based on ClustalW 2.1 (56) coding sequence alignments by the Nei and Gojobori method
using codeml (part of the PAML package; (57)). Age of gene divergence was estimated by the
Version preprint
References and Notes:
1. J. Dubcovsky and J. Dvorak, Genome plasticity a key factor in the success of
polyploid wheat under domestication. Science 316, 1862 (2007).
2. F. Choulet et al., Megabase level sequencing reveals contrasted organization and
evolution patterns of the wheat gene and transposable element spaces. Plant Cell 22,
1686 (2010).
3. J. Zhang, Evolution by gene duplication: an update. Trends Ecol Evol 18, 292 (2003).
4. C. Rustenholz et al., A 3000-loci transcription map of chromosome 3B unravels the
structural and functional features of gene islands in hexaploid wheat. Plant Physiol
157, 1596 (2011).
5. I. D. Wilson et al., A transcriptomics resource for wheat functional genomics. Plant
Biotechnol. J. 2, 495 (2004).
6. P. R. Bhat et al., Mapping translocation breakpoints using a wheat microarray. Nucleic
Acids Res, (2007).
7. L. L. Qi et al., A chromosome bin map of 16,000 expressed sequence tag loci and
distribution of genes among the three genomes of polyploid wheat. Genetics 168, 701
(2004).
8. R. Brenchley et al., Analysis of the bread wheat genome using whole-genome shotgun
sequencing. Nature 491, 705 (2012).
9. J. Jia et al., Aegilops tauschii draft genome sequence reveals a gene repertoire for
wheat adaptation. Nature 496, 91 (2013).
10. H. Q. Ling et al., Draft genome of the wheat A-genome progenitor Triticum urartu.
Nature 496, 87 (2013).
11. M. C. Schatz, A. L. Delcher and S. L. Salzberg, Assembly of large genomes using
Version preprint
12. V. Marx, Next-generation sequencing: The genome jigsaw. Nature 501, 263 (2013).
13. P. S. Schnable et al., The B73 maize genome: complexity, diversity, and dynamics.
Science 326, 1112 (2009).
14. The Potato Genome Sequencing Consortium, Genome sequence and analysis of the
tuber crop potato. Nature 475, 189 (2011).
15. J. Dolezel, M. Kubalakova, E. Paux, J. Bartos and C. Feuillet, Chromosome-based
genomics in the cereals. Chromosome Res 15, 51 (2007).
16. J. Safar et al., Dissecting large and complex genomes: flow sorting and BAC cloning
of individual chromosomes from bread wheat. Plant J. 39, 960 (2004).
17. E. Paux et al., A physical map of the 1-gigabase bread wheat chromosome 3B. Science
322, 101 (2008).
18. Supplementary materials are available on Science Online.
19. International Wheat Genome Sequencing Consortium, A chromosome-based draft
sequence of the hexaploid bread wheat genome. Science, (2014).
20. B. S. Gill, B. Friebe and T. Endo, Standard karyotype and nomenclature system for
description of chromosome bands and structural aberrations in wheat (Triticum
aestivum). Genome 34, 830 (1991).
21. P. S. Chain et al., Genomics. Genome project standards in a new era of sequencing.
Science 326, 236 (2009).
22. B. Li et al., Wheat centromeric retrotransposons: the new ones take a major role in
centromeric structure. Plant J. 73, 952 (2013).
23. H. Yan et al., Intergenic locations of rice centromeric chromatin. PLoS Biol 6, e286
(2008).
24. H. Zhang and R. K. Dawe, Total centromere size and genome size are strongly
Version preprint
25. T. Sakuno, K. Tada and Y. Watanabe, Kinetochore geometry defined by cohesion
within the centromere. Nature 458, 852 (2009).
26. Q. Pan, F. Ali, X. Yang, J. Li and J. Yan, Exploring the Genetic Characteristics of
Two Recombinant Inbred Line Populations via High-Density SNP Markers in Maize.
PLoS ONE 7, e52777 (2012).
27. A. J. Lukaszewski and C. A. Curtis, Physical distribution of recombination in
B-genome chromosomes of tetraploid wheat. Theor. Appl. Genet. 86, 121 (1993).
28. C. Saintenac et al., Detailed recombination studies along chromosome 3B provide new
insights on crossover distribution in wheat (Triticum aestivum L.). Genetics 181, 393
(2009).
29. J. Evans et al., Extensive Variation in the Density and Distribution of DNA
Polymorphism in Sorghum Genomes. PLoS ONE 8, e79192 (2013).
30. International Rice Genome Sequencing Project, The map-based sequence of the rice
genome. Nature 436, 793 (2005).
31. A. H. Paterson et al., The Sorghum bicolor genome and the diversification of grasses.
Nature 457, 551 (2009).
32. A. Gottlieb et al., Insular organization of gene space in grass genomes. PLoS ONE 8,
e54101 (2013).
33. M. W. Ganal et al., A Large Maize (Zea mays L.) SNP Genotyping Array:
Development and Germplasm Genotyping, and Genetic Mapping to Compare with the
B73 Reference Genome. PLoS ONE 6, e28334 (2011).
34. The International Barley Genome Sequencing Consortium, A physical, genetic and
Version preprint
35. R. S. Sekhon et al., Maize Gene Atlas Developed by RNA Sequencing and
Comparative Evaluation of Transcriptomes Based on RNA Sequencing and
Microarrays. PLoS ONE 8, e61005 (2013).
36. R. Baucom et al., Exceptional diversity, non-random distribution, and rapid evolution
of retroelements in the B73 maize genome. PLoS Genet 5, e1000732 (2009).
37. R. S. Baucom, J. C. Estill, J. Leebens-Mack and J. L. Bennetzen, Natural selection on
gene function drives the evolution of LTR retrotransposon families in the rice genome.
Genome Res 19, 243 (2009).
38. M. Charles et al., Dynamics and differential proliferation of transposable elements
during the evolution of the B and A genomes of wheat. Genetics 180, 1071 (2008).
39. E. Sergeeva, E. Salina, I. Adonina and B. Chalhoub, Evolutionary analysis of the
CACTA DNA-transposon Caspar across wheat species using sequence comparison
and in situ hybridization. Mol Genet Genomics 284, 11 (2010).
40. C. Lu et al., Miniature Inverted–Repeat Transposable Elements (MITEs) Have Been
Accumulated through Amplification Bursts and Play Important Roles in Gene
Expression and Species Diversity in Oryza sativa. Mol. Biol. Evol. 29, 1005 (2012).
41. M. D. Gale and K. M. Devos, Comparative genetics in the grasses. Proc. Natl. Acad.
Sci. U. S. A. 95, 1971 (1998).
42. K. M. Devos and M. D. Gale, Genome relationships: The grass model in current
research. Plant Cell 12, 637 (2000).
43. F. Murat et al., Ancestral grass karyotype reconstruction unravels new mechanisms of
genome shuffling as a source of plant evolution. Genome Res 20, 1545 (2010).
44. International Brachypodium Initiative, Genome sequencing and analysis of the model
Version preprint
45. E. D. Akhunov et al., Synteny perturbations between wheat homoeologous
chromosomes caused by locus duplications and deletions correlate with recombination
rates. Proc. Natl. Acad. Sci. U. S. A. 100, 10836 (2003).
46. T. Wicker et al., Frequent Gene Movement and Pseudogene Evolution Is Common to
the Large and Complex Genomes of Wheat, Barley, and Their Relatives. The Plant
Cell 23, 1706 (2011).
47. T. Wicker, J. Buchmann and B. Keller, Patching gaps in plant genomes results in gene
movement and erosion of colinearity. Genome Res 20, 1229 (2010).
48. M. Morgante et al., Gene duplication and exon shuffling by helitron-like transposons
generate intraspecies diversity in maize. Nat Genet 37, 997 (2005).
49. C. Feuillet, J. E. Leach, J. Rogers, P. S. Schnable and K. Eversole, Crop genome
sequencing: lessons and rationales. Trends Plant Sci 16, 77 (2011).
50. E. Paux et al., Insertion site-based polymorphism markers open new perspectives for
genome saturation and marker-assisted selection in wheat. Plant Biotechnol J 8, 196
(2010).
51. B. Goffinet and S. Gerber, Quantitative Trait Loci: A Meta-analysis. Genetics 155,
463 (2000).
52. J. A. Foley et al., Solutions for a cultivated planet. Nature 478, 337 (2011).
53. P. Leroy et al., TriAnnot: a versatile and high performance pipeline for the automated
annotation of plant genomes. Front. Plant Sci. 3, 5 (2012).
54. J. Chen and A. K. Gupta, Parametric Statistical Change Point Analysis: With
Applications to Genetics, Medicine, and Finance. (Birkhäuser Basel, Basel, 2012), pp.
273.
55. L. Li, C. J. Stoeckert and D. S. Roos, OrthoMCL: Identification of Ortholog Groups
Version preprint
56. J. D. Thompson, D. G. Higgins and T. J. Gibson, CLUSTAL W: improving the
sensitivity of progressive multiple sequence alignment through sequence weighting,
position-specific gap penalties and weight matrix choice. Nucleic Acids Res 22, 4673
(1994).
57. Y. Ziheng, PAML: a program package for phylogenetic analysis by maximum
likelihood. Computer applications in the biosciences : CABIOS 13, 555 (1997).
58. H. Simkova et al., Coupling amplified DNA from flow-sorted chromosomes to
high-density SNP mapping in barley. BMC Genomics 9, 294 (2008).
59. R. Li et al., SOAP2: an improved ultrafast tool for short read alignment.
Bioinformatics 25, 1966 (2009).
60. S. F. Altschul et al., Gapped BLAST and PSI-BLAST: a new generation of protein
database search programs. Nucleic Acids Res 25, 3389 (1997).
61. J. M. Aury et al., High quality draft sequences for prokaryotic genomes using a mix of
new sequencing technologies. BMC Genomics 9, 603 (2008).
62. R. Philippe et al., Whole Genome Profiling provides a robust framework for physical
mapping and sequencing in the highly complex and repetitive wheat genome. BMC
Genomics 13, 47 (2012).
63. W. J. Kent, BLAT—The BLAST-Like Alignment Tool. Genome Res. 12, 656 (2002).
64. C. Soderlund, S. Humphray, A. Dunham and L. French, Contigs built with
fingerprints, markers, and FPC V4.7. Genome Res 10, 1772 (2000).
65. A. Graner, H. Siedler, A. Jahoor, R. G. Herrmann and G. Wenzel, Assessment of the
degree and the type of Restriction-Fragment-Length-Polymorphism in barley
(Hordeum vulgare). Theor Appl Genet 80, 826 (1990).
66. M. Stanke et al., AUGUSTUS: ab initio prediction of alternative transcripts. Nucleic
Version preprint
67. E. Blanco and J. F. Abril, Computational gene annotation in new genome assemblies
using GeneID. Methods Mol Biol 537, 243 (2009).
68. K. Rutherford et al., Artemis: sequence visualization and annotation. Bioinformatics
16, 944 (2000).
69. T. Schiex, A. Moisan and P. Rouze, in Computational Biology, O. Gascuel, M.-F.
Sagot, Eds. (LNCS 2066, 2001), pp. 111-125.
70. G. S. Slater and E. Birney, Automated generation of heuristics for biological sequence
comparison. BMC Bioinformatics 6, 31 (2005).
71. M. Van Bel et al., Dissecting plant genomes with the PLAZA comparative genomics
platform. Plant Physiol 158, 590 (2012).
72. W. Lin, Y. Chen, J. Ho and C. Hsiao, GOBU: Toward an Integration Interface for
Biological Object. Journal of Information Science and Engineering 22, 19 (2006).
73. S. Jantzen, B. Sutherland, D. Minkley and B. Koop, GO Trimming: Systematically
reducing redundancy in large Gene Ontology datasets. BMC Research Notes 4, 267
(2011).
74. G. van Ooijen et al., Structure–function analysis of the NB-ARC domain of plant
disease resistance proteins. J. Exp. Bot. 59, 1383 (2008).
75. K. Lagesen et al., RNAmmer: consistent and rapid annotation of ribosomal RNA
genes. Nucleic Acids Res 35, 3100 (2007).
76. T. M. Lowe and S. R. Eddy, tRNAscan-SE: a program for improved detection of
transfer RNA genes in genomic sequence. Nucl Acids Res 25, 955 (1997).
77. S. Connelly, C. Marshallsay, D. Leader, J. W. Brown and W. Filipowicz, Small
nuclear RNA genes transcribed by either RNA polymerase II or RNA polymerase III
Version preprint
expression different from that used by their dicot plant counterparts. Mol Cell Biol 14,
5910 (1994).
78. A. J. Enright, S. Van Dongen and C. A. Ouzounis, An efficient algorithm for
large-scale detection of protein families. Nucleic Acids Res 30, 1575 (2002).
79. K. Katoh, K.-i. Kuma, H. Toh and T. Miyata, MAFFT version 5: improvement in
accuracy of multiple sequence alignment. Nucleic Acids Res 33, 511 (2005).
80. T. Flutre, E. Duprat, C. Feuillet and H. Quesneville, Considering transposable element
diversification in de novo annotation approaches. PLoS ONE 6, e16526 (2011).
81. D. Kim et al., TopHat2: accurate alignment of transcriptomes in the presence of
insertions, deletions and gene fusions. Genome Biology 14, R36 (2013).
82. B. Langmead and S. L. Salzberg, Fast gapped-read alignment with Bowtie 2. Nat Meth
9, 357 (2012).
83. H. Li et al., The Sequence Alignment/Map format and SAMtools. Bioinformatics 25,
2078 (2009).
84. C. Trapnell et al., Transcript assembly and quantification by RNA-Seq reveals
unannotated transcripts and isoform switching during cell differentiation. Nat Biotech
28, 511 (2010).
85. A. Mortazavi, B. A. Williams, K. McCue, L. Schaeffer and B. Wold, Mapping and
quantifying mammalian transcriptomes by RNA-Seq. Nat Methods 5, 621 (2008).
86. S. Shen et al., MATS: a Bayesian framework for flexible detection of differential
alternative splicing from RNA-Seq data. Nucleic Acids Res 40, e61 (2012).
87. T. J. Carver et al., ACT: the Artemis Comparison Tool. Bioinformatics (Oxford,
England) 21, 3422 (2005).
88. Y. Wang et al., MCScanX: a toolkit for detection and evolutionary analysis of gene
Version preprint
89. M. Krzywinski et al., Circos: An information aesthetic for comparative genomics.
Genome Res. 19, 1639 (2009).
90. E. R. Sears, The aneuploid of common wheat. Mo. Agr. Exp. Sta. Res. Bull. 572, 1
(1954).
91. E. R. Sears and L. Sears, in Proc. 5th Int. Wheat Genetics Symp., S. Ramanujams, Ed.
(Indian Agricultural Research Institute, New Delhi, India. , 1978 ), pp. 389-407.
92. T. R. Endo and B. S. Gill, The deletion stocks of common wheat. J. Hered. 87, 295
(1996).
93. A. Graner, H. Siedler, A. Jahoor, R. G. Herrmann and G. Wenzel, Assessment of the
Degree and the Type of Restriction-Fragment-Length-Polymorphism in Barley
(Hordeum-Vulgare). Theor. Appl. Genet. 80, 826 (1990).
94. F. Balfourier et al., A worldwide bread wheat core collection arrayed in a 384-well
plate. Theor Appl Genet 114, 1265 (2007).
95. A. Horvath et al., Analysis of diversity and linkage disequilibrium along chromosome
3B of bread wheat (Triticum aestivum L.). Theor Appl Genet 119, 1523 (2009).
96. S. de Givry, M. Bouchez, P. Chabrier, D. Milan and T. Schiex, CARHTA GENE:
multipopulation integrated genetic and radiation hybrid mapping. Bioinformatics 21,
1703 (2005).
97. K. C. Cone et al., Genetic, physical, and informatics resources for maize. On the road
to an integrated map. Plant Physiol 130, 1598 (2002).
98. P. Wenzl et al., Isolated chromosomes as a new and efficient source of DArT markers
for the saturation of genetic maps. Theor Appl Genet 121, 465 (2010).
99. M. E. Sorrells et al., Reconstruction of the synthetic W7984 x Opata M85 wheat
Version preprint
100. P. Sourdille et al., An update of the Courtot x Chinese Spring intervarietal molecular
marker linkage map for the QTL detection of agronomic traits in wheat. Theor Appl
Genet 106, 530 (2003).
101. T. W. Banks, M. C. Jordan and D. J. Somers, Single-Feature Polymorphism Mapping
in Bread Wheat. Plant Gen. 2, 167 (2009).
102. P. A. Wilkinson et al., CerealsDB 2.0: an integrated resource for plant breeders and
scientists. BMC Bioinformatics 13, 219 (2012).
103. A. M. Allen et al., Discovery and development of exome-based, co-dominant single
nucleotide polymorphism markers in hexaploid wheat (Triticum aestivum L.). Plant
Biotechnol J 11, 279 (2013).
104. M. O. Winfield et al., Targeted re-sequencing of the allohexaploid wheat exome. Plant
Biotechnol J 10, 733 (2012).
105. P. J. Bradbury et al., TASSEL: software for association mapping of complex traits in
diverse samples. Bioinformatics 23, 2633 (2007).
106. O. Sosnowski, A. Charcosset and J. Joets, BioMercator V3: an upgrade of genetic map
compilation and quantitative trait loci meta-analysis algorithms. Bioinformatics 28,
2082 (2012).
107. J. C. Zadoks, T. T. Chang and C. F. Konzak, A decimal code for the growth stages of
cereals. Weed Research 14, 415 (1974).
108. C. Groos, N. Robert, E. Bervas and G. Charmet, Genetic analysis of grain
protein-content, grain yield and thousand-kernel weight in bread wheat. Theor Appl Genet
106, 1032 (2003).
109. D. An et al., Mapping QTLs for nitrogen uptake in relation to the early growth of
Version preprint
110. D. Habash, S. Bernard, J. Schondelmaier, J. Weyen and S. Quarrie, The genetics of
nitrogen use in hexaploid wheat: N utilisation, development and yield. Theor. Appl.
Genet. 114, 403 (2007).
111. A. Laperche et al., Using genotype x nitrogen interaction variables to evaluate the
QTL involved in wheat tolerance to nitrogen constraints. Theor. Appl. Genet. 115, 399
(2007).
112. Z. Li et al., Molecular mapping of QTLs for root response to phosphorus deficiency at
seedling stage in wheat (Triticum aestivum L.). Progress in Natural Science 17, 1177
(2007).
113. J.-X. Fontaine et al., A quantitative genetic study for elucidating the contribution of
glutamine synthetase, glutamate dehydrogenase and other nitrogen-related
physiological traits to the agronomic performance of common wheat. Theor. Appl.
Genet. 119, 645 (2009).
114. Y. Zhang et al., QTL mapping for quantities of protein fractions in bread wheat
(Triticum aestivum L.). Theor. Appl. Genet. 122, 971 (2011).
115. D. Bennett et al., Genetic dissection of grain yield and physical grain quality in bread
wheat (Triticum aestivum L.) under water-limited environments. Theor. Appl. Genet.
125, 255 (2012).
116. M. Bogard et al., Anthesis date mainly explained correlations between post-anthesis
leaf senescence, grain yield, and grain protein concentration in a winter wheat
population segregating for flowering time QTLs. J. Exp. Bot., (2011).
117. Y. Guo et al., QTL mapping for seedling traits in wheat grown under varying
Version preprint
118. M. Bogard et al., Identifying wheat genomic regions for improving grain protein
concentration independently of grain yield using multiple inter-related populations.
Mol. Breed. 31, 587 (2013).
119. X. Liu, R. Li, X. Chang and R. Jing, Mapping QTLs for seedling root traits in a
doubled haploid wheat population under different water regimes. Euphytica 189, 51
(2013).
120. S. Griffiths et al., Meta-QTL analysis of the genetic control of ear emergence in elite
European winter wheat germplasm. Theor. Appl. Genet. 119, 383 (2009).
121. S.-L. Mao et al., Confirmation of the relationship between plant height and Fusarium
head blight resistance in wheat (Triticum aestivum L.) by QTL meta-analysis.
Euphytica 174, 343 (2010).
122. L.-Y. Zhang et al., Genomic Distribution of Quantitative Trait Loci for Yield and
Yield-related Traits in Common Wheat. Journal of Integrative Plant Biology 52, 996
(2010).
123. U. M. Quraishi et al., Cross-genome map based dissection of a nitrogen use efficiency
ortho-metaQTL in bread wheat unravels concerted cereal genome evolution. Plant J
65, 745 (2011).
124. S. Griffiths et al., Meta-QTL analysis of the genetic control of crop height in elite
European winter wheat germplasm. Mol. Breed. 29, 159 (2010).
125. T. Wicker et al., A unified classification system for eukaryotic transposable elements.
Version preprint
Acknowledgements:
The authors would like to thank the scientific advisory board (P. Schnable, S. Rounsley, D.
Ware, J. Rogers and K. Eversole) of the 3BSEQ project for fruitful discussions and K.
Eversole for critical reading and editing of the manuscript, H. Rimbert, N. Cubizolles, and E.
Rey for SNP marker discovery and genotyping, Dr. M. Kubaláková and Dr. J. Vrána for the
assistance with the preparation of DNA amplified from flow-sorted chromosome 3B, L.
Couderc, A. Keliet and S. Reboux for their support in database and system administration, C.
Poncet and the "Plateforme GENTYANE" for SNP genotyping. Supported by grant of the
French National Research Agency (ANR-09-GENM-025 3BSEQ), a grant of France Agrimer,
and a grant (project DL-BLE) from the INRA BAP division. NG is funded by a grant of the
European Commission research training program Marie-Curie Actions
(FP7-MC-IIF-NoncollinearGenes). JDa is funded by a grant from the French Ministry of Research. LP is
funded by a grant from the Region Auvergne. KV is supported by the Ghent University
Multidisciplinary Research Partnership (“Bioinformatics: from nucleotides to networks”
[Project 01MR0310W]). JDo is supported by the Czech Science Foundation (award no.
P501/12/G090).
The chromosome 3B BAC library and the pools of the MTP BAC clones are available upon
request under a Material Transfer Agreement at the French Plant Genomic Center,
INRA-CNRGV.
Annotation data and browser are available at
https://urgi.versailles.inra.fr/gb2/gbrowse/wheat_annot_3B. Sequences and annotations of the
reference pseudomolecule and unassigned scaffolds have been deposited in ENA (project
CBUC010000001-Version preprint
CBUC010001450, respectively. RNA-Seq data were deposited under the accession number
Version preprint
Figure legends
Figure 1. Structural and functional partitioning of wheat chromosome 3B. Distribution and
segmentation analysis of (A) meiotic recombination rate (cM/Mb in sliding window of 10 Mb
in black, and 1 Mb in red); (B) gene density (CDS/Mb); (C) expression breadth; (D) average
number of alternative spliced transcripts per expressed gene; (E) TE content along the 3B
pseudomolecule. Distal regions of the chromosome R1 and R3 are represented in red; C:
centromeric/pericentromeric region (black). The borders of these regions are indicated in Mb.
Sliding window size: 10 Mb, step: 1 Mb.
Figure 2: Inter- and intra-specific comparative analyses of the gene content of wheat
chromosome 3B. (A) Venn diagram displaying the number of genes conserved between wheat
chromosome 3B (Ta3b, blue) and orthologous chromosomes in rice (Os1, red), Brachypodium
(Bd2, green), and sorghum (Sb3, purple). The number of nonsyntenic genes is indicated in
bold for each species. Distribution along the 774 Mb of the chromosome 3B pseudomolecule
of the relative proportion of (B) syntenic (blue) vs. nonsyntenic (red) genes, (C)
inter-chromosomal duplications (duplicates in red, group 3 specific genes in blue), and (D) tandem
(yellow) and dispersed (red) intra-chromosomal duplications and singletons (blue).
Chromosome 3B is represented at the bottom with distal regions in red and the
Version preprint
Table 1. General features of the 3B pseudomolecule Pseudomolecule sequence
Length (bps) 774,434,471
G+C content 46.16%
Protein coding genes all full genes pseudogenes
#genes 7,264 5,326 1,938
average size (bps) of coding sequences (+/-standard deviation) 1,095+/-807 1,187+/-821 840+/-710
average number of exons (+/-standard deviation) 4.2+/-4.4 4.4+/-4.6 3.6+/-3.8
gene density (kb-1) 107 145 400
#expressed genes 5,185 4,125 1,060
#gene with alternative splicing 3,185 2,596 589
%genes with alternative splicing 61% 63% 56%
average no. isoforms/expressed gene 5.8 5.8 5.8
NTRs 3,692
Non coding RNA genes
tRNA 589
5S rRNA 85
Others (snRNA, snoRNA) 117
Total 791
Transposable elements (TEs)
Class I Copia 15.6% Gypsy 46.9% Unclassified LTR-retrotransposons 3.5% LINEs 1.2% SINEs 0.01% Total class I 67.1% Class II CACTA 16.4% Harbinger 0.19% Mariner 0.19% Mutator 0.43% hAT 0.02%
Unclassified class II with TIRs 0.22%
Unclassified class II 0.10%
Helitron 0.01%
Total class II 17.6%
Unclassified repeats 0.81%
Version preprint
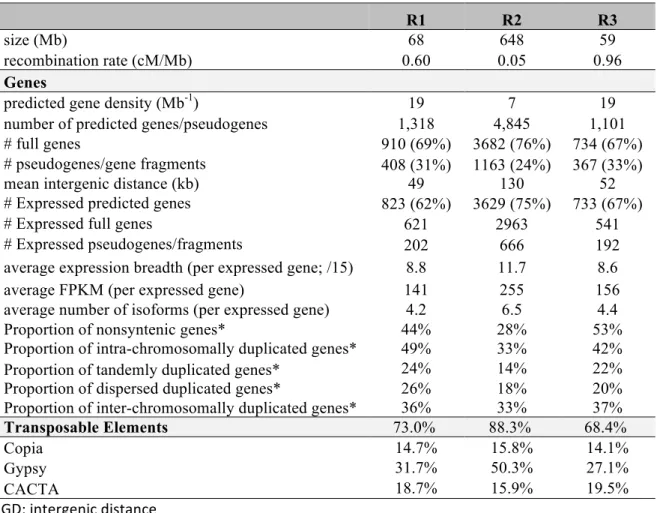
Table 2. Distribution of features in the three regions of chromosome 3B as defined from the
recombination segmentation along the chromosome
R1 R2 R3
size (Mb) 68 648 59
recombination rate (cM/Mb) 0.60 0.05 0.96
Genes
predicted gene density (Mb-1) 19 7 19
number of predicted genes/pseudogenes 1,318 4,845 1,101
# full genes 910 (69%) 3682 (76%) 734 (67%)
# pseudogenes/gene fragments 408 (31%) 1163 (24%) 367 (33%)
mean intergenic distance (kb) 49 130 52
# Expressed predicted genes 823 (62%) 3629 (75%) 733 (67%)
# Expressed full genes 621 2963 541
# Expressed pseudogenes/fragments 202 666 192
average expression breadth (per expressed gene; /15) 8.8 11.7 8.6
average FPKM (per expressed gene) 141 255 156
average number of isoforms (per expressed gene) 4.2 6.5 4.4
Proportion of nonsyntenic genes* 44% 28% 53%
Proportion of intra-chromosomally duplicated genes* 49% 33% 42%
Proportion of tandemly duplicated genes* 24% 14% 22%
Proportion of dispersed duplicated genes* 26% 18% 20%
Proportion of inter-chromosomally duplicated genes* 36% 33% 37%
Transposable Elements 73.0% 88.3% 68.4%
Copia 14.7% 15.8% 14.1%
Gypsy 31.7% 50.3% 27.1%
CACTA 18.7% 15.9% 19.5%
IGD: intergenic distance
*number of duplicated genes (filtered set; including pseudogenes) divided by the total number of genes in each region.
Version preprint
Version preprint