Aftermarket Vehicle Hybridization: Designing a Supply Network for a
Startup Company
by MASSACHUSETTS INSTI
OF TECHNOLOGY
Marcus S. Causton
B.S. Chemical Engineering
JUL 28 2010
Colorado School of Mines, 2000and
LIBRARIES
ARCHIVES
Jianmin
Wu
B.S. Chemical Engineering Cornell University, 2009
Submitted to the Engineering Systems Division in Partial Fulfillment of the Requirements for the Degree of
Master of Engineering in Logistics
at theMassachusetts Institute of Technology
May 2010© 2010 Marcus S. Causton and Jianmin Wu. All rights reserved.
The author hereby grants to MIT permission to reproduce and to distribute publicly paper and electronic copies of this document in whole or in part.
Signature of A uthor... ...
Master of Engineering in Logistics Program, Engineering Systems Division May 2010
Certified by. ... . ...
Dr. Jarrod Goentzel Executive Director, Masters of Engineering in Lo stics Program Xoohesis Sungrvisor A ccepted by . ... ... . . . . ...
Prof. Yossi Sheffi Professor, Engineering Systems Division Professor, Civil and Environmental Engineering Department Director, Center for Transportation and Logistics
Director, Engineering Systems Division
Aftermarket Vehicle Hybridization: Designing a Supply Network for a
Startup Company
by
Marcus S. Causton and
Jianmin
WuSubmitted to the Engineering Systems Division in partial fulfillment of the requirements for the degree of Master of Engineering in Logistics
at the Massachusetts Institute of Technology
Abstract
Our thesis introduces a supply chain framework catered for startup companies. Startup companies face unique circumstances such as constraints on financial and human resources, and greater uncertainty in demand. From our work with XL Hybrids, a startup company that hybridizes aftermarket vehicles, as well as interviews and literature review, we have attempted to distill supply chain strategies that can be applied to startup companies.
To plan XL Hybrids' supply chain, we developed models for the following aspects of their supply chain: production scheduling, capacity planning, inventory policy, and component distribution. By running different demand and pricing scenarios, we gained an understanding of the impact of these variables on the four aspects of XL Hybrid's supply chain. Based on the scenario analysis and
supply chain framework that we developed, we recommend that XL Hybrids be conservative with capacity expansion while strategically sourcing key components after considering volume discounts and different distribution methods.
Thesis Supervisor: Dr. Jarrod Goentzel
Acknowledgements
We extend our appreciation to the following people for offering their time and expertise to aid us in our thesis:
MIT Faculty:
Our Thesis Advisor, Dr. Jarrod GoentZel, Executive Director, Master of Engineering in Logistics
Program, Massachusetts Institute of Technology
William
Haas, Lecturer, Writing and Humanistic Studies, Massachusetts Institute of TechnologyJonathan Byrnes, Senior Lecturer, Massachusetts Institute of Technology. President, Jonathan Byrnes & Co
NxStage Medical, Inc:
Judith Taylor, VP Planning and Logistics Brian Leb, Home Logistics Manager
XL Hybrids:
Tod Hynes, Founder, President
Justin Ashton, Co-Founder, VP Business Development Amy McKnight Fagen, VP Business Operations
Special thanks goes to our thesis sponsor, Clay Siegert, Co-Founder, VP Supply Chain, XL Hybrids. His commitment and enthusiasm towards our project inspired us to explore multiple areas of supply chain management.
TABLE OF CONTENTS
LIST OF FIGURES LIST OF TABLES
1 INTRODUCTION
1.1 XL Hybrids
1.2 Supply Chain Framework for Startup Companies 1.3 Review of Literature
1.3.1 Production Scheduling and Capacity Expansion 1.3.2 Inventory Policy
1.3.3 Warehousing
1.3.4 Transportation Modes
1.3.5 Startup Company Supply Chain Strategy 2 METHODOLOGY
2.1 Production Scheduling 2.1.1 Model Setup 2.2 Capacity Expansion
2.2.1 Model Setup
2.3 Inventory Analysis: Silver-Meal Heuristic Model 2.3.1 Model Setup
2.4 Sourcing and Distribution Network 2.4.1 Model Setup
2.4.2 Calculations
2.5 Others (Interview/Qualitative)
3 MODEL RESULTS AND OUTPUTS
3.1 Production Plan and Capacity Expansion 3.1.1 Low Demand Scenario
3.1.2 Variable Demand Scenario 3.1.3 Exponential Growth Scenario
3.1.4 Fall in Demand after High Initial Spike Scenario 3.1.5 Capacity Expansion Cost Summary
3.2 Silver-Meal Heuristic
3.3 Warehousing/Transshipment
3.3.1 Fast/Medium Growth Scenarios
4 SUPPLY CHAIN FRAMEWORK FOR OTHER STARTUP COMPANIES 4.1 Customer and Market
4.2 Product and Process
4.3 Identifying Competitive Advantage 4.4 Production Plan 4.5 Capacity Expansion 4.6 Network Design 4.7 Sourcing 4.8 Additional Considerations 5 FUTURE WORK
5.1 Improvements to Models for XL Hybrids
5.2 Building upon Supply Chain Framework for Startup Companies
GLOSSARY
REFERENCES
APPENDIX I: Input Parameters into Production Planning and Capacity Expansion Models APPENDIX II: Input Parameters into Warehousing/Transshipment Model
List of Figures
Figure 2-1: Figure 2-2: Figure 3-1: Figure 3-2: Figure 3-3: Figure 3-4: Figure 3-5: Figure 3-6: Figure 3-7: Figure 3-8: Figure 3-9: Figure 3-10: Figure 3-11: Figure 3-12: Figure 3-13: Figure 3-14: Figure 3-15: Figure 3-16: Figure 3-17: Figure 3-18: Figure 3-19: Figure 3-20: Figure 3-21: Figure 4-1: Figure 4-2:Estimating Transportation Cost of Electric Motor
Estimating Transportation Cost from Newark to Somerville with an Exponential Function
Production Plan for Low Demand Scenario Capacity Plan for Low Demand Scenario
Quantity of Mobile Teams, Shifts, Bays, and Facilities for Low Demand Scenario Production Plan for Variable Demand Scenario
Capacity Plan for Variable Demand Scenario
Quantity of Mobile Teams, Shifts, Bays, and Facilities for Variable Demand Scenario Production Plan for Exponential Growth Scenario
Capacity Expansion for Exponential Growth Scenario
Quantity of Mobile Teams, Shifts, Bays, and Facilities for Exponential Growth Scenario
Production Plan for Fall in Demand after Initial Spike Scenario (Regular Order Deadline)
Capacity Expansion for Fall in Demand after Initial Spike Scenario (Regular Order Deadline)
Quantity of Mobile Teams, Shifts, Bays, and Facilities for Fall in Demand after Initial Spike Scenario (Regular Order Deadline)
Production Plan for Fall in Demand after Initial Spike Scenario (Extended Order Deadline)
Capacity Expansion for Fall in Demand after Initial Spike Scenario (Extended Order Deadline)
Quantity of Mobile Teams, Shifts, Bays, and Facilities for Fall in Demand after Initial Spike Scenario (Extended Order Deadline)
Optimal Order Period for the Electric Motor as a Function of Average Demand/Week
Cost Breakdown of Total Relevant Costs of Procuring a Conversion Kit
Unit Cost as a Function of Order Period at Different Levels of Demand (At 15% Holding Cost)
Fast and Medium Growth Scenario Analysis of Total Relevant Unit Cost and Recommended Order Quantity
Fast and Medium Growth Scenario Analysis of Order Quantity and Frequency of Kits
Order Quantity/Frequency and Yearly Savings of Annual Volume Discount Contract under Medium Growth Scenario
Framework for Startup Companies Supply Chain Plan
List of Tables
Table 3-1: Operating and Capital Cost of Different Methods of Increasing Capacity Table 3-2: Cost Summary of Warehousing and Transshipment Option
Table 3-3: Recommended Transition Date from Transshipment to Warehousing as a Function of Percentage Contribution to Volume Discounts
1 INTRODUCTION
Planning an effective supply chain strategy for a company involves complex considerations such as sourcing, distribution, demand forecasting and capacity planning. Supply chain planning for a startup company involves similar complexities with the added challenge of demand uncertainty and
financial and human resource constraints. For our thesis we worked with XL Hybrids, a new company founded by MIT alumni which converts existing vehicles into hybrids, to design its supply chain. XL Hybrids offered us the opportunity to study a startup company that is introducing a new technology into a market that does not exist. In addition to designing supply chain strategies to help XL Hybrids cope with extreme demand uncertainty and resource constraints typical of a startup, we
also helped XL Hybrids identify the parts of its supply chain to outsource versus manage in-house.
Our thesis is divided into two parts. The first part describes our work with XL Hybrids to design its supply chain. The second part describes a broader supply chain framework for startup companies based on our lessons learnt from designing XL Hybrids' supply chain, interviews, and literature review. Typically, companies do not think about supply chain issues at the startup stage due to resource limitations. We believe our framework can help startup companies think about supply chain issues early on. Furthermore, it will enable startups to implement supply chain management strategies that will help them conserve cash, maximize internal resources, cope with uncertain demand, and decide outsourcing strategies.
Section 1.1 and Section 1.2 is dedicated to introducing the motivation and scope of the two parts of our thesis. The rest of Section 1 describes our literature review.
1.1 XL Hybrids
XL Hybrids is a startup company that converts conventional, gas-powered commercial vehicles into hybrids, allowing customers to improve fuel efficiency of their existing vehicles. Five
converging factors are driving the business opportunity for hybridizing commercial vehicles: First, gas prices now exceed $2.50 per gallon and continue to rise. Second, hybrid vehicles have become
accepted as a viable transportation solution with corporate and individual consumers beginning to adopt the technology. Third, the U.S. government is beginning to mandate the adoption of hybrids and fuel-efficient vehicles. Fourth, corporations are adopting carbon emission reduction policies for their vehicle fleets. Fifth, there are millions of low-MPG commercial vehicles in the U.S. This results in thousands of dollars being spent on fuel annually per vehicle. Owners of these types of inefficient commercial vehicles have been exposed to high gasoline prices since 2008 and are now seeking ways to reduce their fuel costs. Hybrid retrofits offer fleet owners lower fuel costs and lower carbon emissions on their existing vehicles. Aftermarket hybridization of these vehicles represents a multi-billion dollar market opportunity for XL Hybrids.
XL Hybrids' hybridization process uses three critical components which are sourced from external suppliers: a battery, a controller and an electric motor. XL Hybrids purchases these components and assembles them into a kit which is installed into vehicles. These components are sourced from overseas suppliers and will be shipped via a U.S. port. Since all the components are sourced externally, careful sourcing is required to ensure the conversion is reliable and of a high quality. The hybridization process involves quality control testing of the individual components before retrofitting them into the vehicle. This entire process takes approximately four hours. The conversion can take place in a XL Hybrids conversion center, or can be performed offsite at a customer's location by sending a XL Hybrids mobile van with the workers, components, and installation equipment. Mobile vans have a higher capital cost, but incur lower operating costs and
are more convenient for the customer. XL Hybrids is planning to open many conversion centers in urban markets over the next couple of years to complement its existing Boston area headquarters.
XL Hybrids' sales cycle lasts approximately six months. The process involves working with the customer to identify the number of vehicles that need to be converted and to schedule the conversions around availability of vehicles and conversion capacity. This allows XL Hybrids to negotiate customer contracts with flexible conversion deadlines and plan capacity around incoming orders. Additionally, since the sales cycle time exceeds both product delivery time and the time required to increase capacity, XL Hybrids is able to lower inventory levels and postpone capacity expansion. This is unique to XL Hybrids, since most startup companies will need to have product and capacity available in advance of confirmed sales.
From our consultations with XL Hybrids, we limit the scope of our thesis to the following four elements of supply chain planning:
* Production planning * Capacity expansion * Order quantity
e Warehousing versus transshipment decision
We built optimization models for production planning and capacity expansion, and built simulation models for order quantity and warehousing/transshipment decision to analyze these aspects quantitatively. Using these models, we stress-tested our results by analyzing multiple scenarios for XL Hybrids' supply chain based on demand projections, supplier locations and other operating conditions. This is especially important for a startup company since there is greater uncertainty in its business during the early stages. Our models focus on the three most important components from XL Hybrids' conversion kit- the battery, the controller, and the electric
motor-which are sourced from three separate specialty suppliers. Based on the results from our four models, we provided XL Hybrids with recommendations for planning its supply chain.
We introduce and explain our four models in Section 2. In Section 3, we summarize the results of our scenario analysis and provide recommendations for XL Hybrids.
1.2 Supply Chain Framework for Startup Companies
As mentioned previously, the second part of our thesis introduces a supply chain framework for startup companies. This framework is for startup companies that have a sellable product or a product at a later stage of development.
We began this project fully intending to find supply chain frameworks for startup companies that we could use. However, while our literature review uncovered supply chain frameworks that are industry specific, we did not find studies that are specific to a company's timeline. Consequently, our literature review did not uncover any supply chain frameworks focused on startup companies. Additionally, books for startup companies such as "Start Your Own Business" (R. Lesonsky, 2001) or online websites like entrepreneur.com do not approach the startup process from a supply chain
viewpoint.
This lack of literature signaled an opportunity for us to contribute meaningful research to the subject of entrepreneurship and startup companies. This also indicates that perhaps most startup companies do not think hard enough about supply chain management and the importance it can play in the growth of a company. Startup companies are restricted in human and financial resources, thus they focus on issues that are core to their business, such as sales, operations, and raising funds. Supply chain is typically viewed as a support function for their core business rather than something that is managed in-house. However, based on our work with XL Hybrids, we
believe that there is value in startups thinking early about supply chain concepts, as these concepts will likely impact fundraising decisions (How much money is needed tofund operations?), hiring decisions
(How manypeople do we need to hire?), expansion decisions (When should we open additionalfaciities?),
sourcing decisions (When should my company begin using an RFP process?), as well as many other future operations.
Having identified the opportunity to contribute meaningful research on an increasingly important business topic, we decided to compile a framework that is angled towards helping startup companies design a supply chain strategy. Our framework is based on our work with XL Hybrids, literature review, and interviews with academics and other professionals in the field. We then
distilled possible strategies in supply chain planning that can be applied to startup companies.
Our framework can be divided into two phases. In the first phase, the company has to define its market, customers, product, process, and competitive advantage. These factors are the core elements of a business plan that affect how the supply chain is designed. Before moving to the next phase, the company has to decide how much of its supply chain to outsource.
In the second phase, the company begins to look at different parts of the supply chain, such as production planning, capacity expansion, and network design. Although this list is similar to what an established company has to consider, a startup company will look at these concepts through a different lens. Startup companies face unique circumstances in planning their supply chain, such as financial constraints and greater uncertainty in demand. Our framework seeks to explain how these unique circumstances affect how startups plan the different parts of the supply chain.
Section 4 of our thesis describes this framework in detail. Finally, Section 5 discusses future steps to expand literature in this field.
1.3 Review of Literature
We looked at five supply chain concepts related to XL Hybrids' supply chain: capacity expansion and production scheduling, warehousing, transportation, distribution options, and assemble-to-order startups. To get a better understanding of these concepts, we surveyed case studies, journals, articles, and textbooks. The bulk of the literature we found focuses on optimizing supply chain networks for established companies, which have greater financial resources, more predictability in their supply chain, and can afford to be more risk-seeking. With little literature found on supply chain design for startups, we modified the concepts of established companies in order to apply them for a startup company such as XL Hybrids.
The literature review starts with an analysis of techniques to optimize production scheduling and capacity planning in Section 1.3.1. In Section 1.3.2 we look into inventory policies that provide background on inventory strategies. Section 1.3.3 then reviews warehousing logistics and basic cost structures to determine how these concepts could be incorporated in our distribution model for XL Hybrids. Section 1.3.4 looks at typical shipping options for freight transport. In Section 1.3.5 we researched startup companies with assemble-to-order production processes to see how they plan and develop their supply chain network.
1.3.1 Production Scheduling and Capacity Expansion
We classify XL Hybrids' service as an assemble-to-order system with few product varieties. This means they should follow a "lag and level" capacity planning strategy (Olhager, Rudberg & Wikner, 2001), which focuses on high utilization of working resources. Capacity expansion typically results in a large incremental step in capacity. A "lag" strategy means that capacity is added when there is enough demand to cover the gain in capacity. A "level" strategy takes a short time horizon
for demand and averages the production to ensure that there is constant production in the short-term. This "lag and level" strategy means that capacity would always be lower than the demand, and results in high utilization of working resources. This concept was captured in the structure of our capacity planning model.
Rajagopalan & Swatminathan (2001) offers another way to optimize production scheduling
by comparing inventory holding costs versus facility expansion costs while ensuring demand is met.
The authors suggest that it is better to build inventory with current excess capacity in order to postpone the need to expand capacity. For XL Hybrids, this is analogous to converting vehicles in advance whenever there is excess capacity. However, this will most likely be infeasible since the vehicles may not be available for conversion. The model developed by Rajagopalan & Swaminathan combines production scheduling with capacity expansion, which we tried to duplicate. However, XL Hybrids' multiple options for expanding capacity, and its long time horizon, introduced too many decision variables which made solving the model infeasible using the Risk Solver Microsoft Excel add in. Thus we separated the model into a production planning and a capacity expansion model. Our approach was primarily focused on optimizing for the most cost effective way to expand the facility given an optimized production plan.
For capacity planning, Yuan and Ashayeri (2009) took a simulation approach using a control theory model to simulate the growth of a firm's supply chain as a function of price change,
intercompany delays and sales effectiveness changes. Our thesis looks at achieving similar results using an optimization model under a fixed demand.
The "lag" strategy also means XL Hybrids has to postpone some of its demand. Current postponement models (Iyer, Deshpande & Wu, 1999) compare the cost between postponing a fraction of the demand versus adding capacity in a two period scenario. Chen (2001) also looks into how companies might fulfill demand differently for different consumers based on how much they
are willing to pay. We incorporated the use of postponement costs in our optimization model, and extended the time frame to consider a multi-period scenario.
1.3.2 Inventory Policy
Our focus of this section was to gain understanding on building a model to determine the
order quantity for the three key parts involved in XL Hybrids' hybridization process.
To optimize the order quantity, we used the modified Silver-Meal heuristic model (Hu, Munson, Silver, 2004) to determine the order quantity that minimizes the total costs related to lost
opportunity cost of volume discounts, transportation costs, and carrying costs. Unlike the more simplistic periodic review and continuous review model, the Silver-Meal heuristic model allowed us to incorporate varying weekly demand as well as non-linear transportation and volume discount cost equations.
More complex models which account for variable lead time from suppliers (Pan & Yang, 2002), and analyze the benefits of Just-In-Time inventory management using lead time efficiency (Olhager, 2002) were also considered to determine the order quantity for XL Hybrids' key parts. However, the increased complexity of Pan's and Olhager's model that better account for lead time variability would not bring about any additional insights beyond the Silver-Meal heuristic model. This is because volume discounts drove the bulk of the total relevant costs, thus lead time had little effect on the inventory policy.
1.3.3 Warehousing
In this section we discuss the literature that helped us understand more about warehousing and how it could be applicable to XL Hybrids. The literature gave us insight into the type of warehousing that a startup company should be using due to limited cash constraints and uncertain demand.
Bolten (1997) states that warehouses can be operated as a private, public, contract, or leased facility. Private warehouses allow for responsiveness, but have high cost of capital. Managing a private warehouse requires the same expertise as running a public warehouse, but all the risk of damage and responsibility is borne by the company. Public warehousing allows for flexibility in inventory location so companies such as XL Hybrids are not tied long term to a private facility in a fixed location. The commitments are often short term monthly contracts. Public warehousing relieves companies of maintaining a professional operation and bearing the burden of safety, insurance, environmental, and legal responsibilities. Contract warehouses are similar to public warehouses however they involve long term contracts and thus have higher service and lower rates than a public warehouse.
One of the key decisions in deciding whether to set up a warehouse is whether to outsource warehousing operations by working with a 3rd party logistics provider (3PL) or whether to manage
the warehousing internally. Feare (2000) highlights several large companies that spend a huge amount of money on 3PL services. For example, Nabisco, with annual revenues of $9 billion per year, spends more than $200 million on 3PL services. Feare discusses in his paper that using companies that work in a multi-client variable-cost environment allows for flexible contracts and "you pay only for the space and labor you use". This flexibility is ideal for a startup company, which should not be tied into long term contracts because its business is still very uncertain. Even Wal-Mart uses 3PL warehousing to supplant its distribution centers for seasonal demand. L.E Mason, a maker of electrical components, works with a 3PL which has allowed it to focus its investments on sales/marketing and on product development. This has enabled L.E Mason to focus on its core business and adapt with agility to marketplace changes and requirements. This flexibility is ideal for XL Hybrids because it is cash constrained, and it needs the ability to adjust to market demand.
Tompkins, Simonson, & Upchurch (2006) state that selecting the fee structure serves as the basis for the service agreement between the company and the 3PL. For startup companies, a transaction fee structure is most ideal. A flat fee is typically charged per unit of work or per unit of pallet handled. For our analysis we have contacted various 3PLs and received cursory public warehousing rates for locations in New Jersey and Pennsylvania, which we have used in our model to estimate the costs of warehousing.
1.3.4 Transportation Modes
For transportation modes, we focused on land and ocean-freight literature to understand the movement of components from suppliers to XL Hybrids. The majority of ocean freight literature involved methods to optimize inventory, capacity, routing, and scheduling under different
conditions. A review of existing models by Christensen (1999) categorized them by the parameter the user wanted to vary. Because of the complexity of planning and scheduling transportation routes, it would be better for a startup company like XL Hybrids not to engage in these tasks. Instead XL Hybrids should initially use a company such as Fed Ex to manage the transportation of their components so that it can focus time and capital on its core business.
1.3.5 Startup Company Supply Chain Strategy
In this section we looked at other companies' supply chains to gain insights into how their supply chains operate and how they were developed to keep costs down while maintaining a high service level. We looked to see what XL Hybrids could learn from successful startup companies to develop and expand its own supply chain.
Dell's supply chain is focused around an assemble-to-order process with low inventory, which is a key factor to their growth and success. Dell has created a supply chain closely linked to Just-in-Time processing through vendor-managed inventory (VMI). S. Kumar and S. Craig (2007)
point is one of the keys to bridge the gap between suppliers and Dell where the suppliers manage the inventory in the revolver and Dell pulls stock from the revolver to fulfill orders. Dell strives to have modular components that can be combined and interchanged at the final assembly to create different products. This postponement strategy allows for flexibility in meeting customer orders while holding less inventory. For XL Hybrids, modularity of some of the assembly parts such as the screws, bolts, and other off the shelf items will help minimize inventory, as it allows for more sharing of parts across conversions of different vehicle models. Another key success factor for Dell is the partnerships it has developed with suppliers through VMI and sharing of sales forecasts. This again allows for less inventory to be held in the supply chain, and prevents the Bull Whip effect. For XL Hybrids, this approach to VMI may be applicable for its off the shelf parts since these parts will
be fast moving and modular.
Aside from Dell, we also looked into the supply chain of CarCo, as it has an assemble-to-order automotive supply chain similar to that of XL Hybrids (Miemczyk and Howard, 2008).
CarCo's assemble-to-order approach stemmed from wanting to reduce inventory in the supply chain and allow flexibility to satisfy market demand. The assemble-to-order business has better profit margins than their to-stock business. One of the key insights from the paper was that build-to-order systems require more flexibility in the supply chain since market demand is more variable thus suppliers are expected to respond faster. This requires close partnerships with supply chain stakeholders. Similarly, XL Hybrids' long sales cycle of converting a fleet of vehicles is essentially an assemble-to-order system which may allow low inventory levels. For XL Hybrids to have low inventories it will need to have close partnerships with its suppliers.
2.
METHODOLOGYWe built models to simulate the following aspects of XL Hybrids' supply chain: production scheduling, capacity expansion, order quantity, and distribution. In our models, we focused on the battery, controller and electric motor, which are the three key parts in the conversion kit's bill of materials. These components make up at least 80% of the cost of goods sold and are, currently, only sourced from overseas suppliers. Hence, these parts account for the bulk of purchasing, transportation, warehousing and holding costs for XL Hybrids.
Section 2.1 describes an optimization model for XL Hybrids' production plan. An overview of the optimization model used to plan XL Hybrids' capacity expansion is found in Section 2.2. Section 2.3 discusses the modified Silver-Meal heuristic model used to determine the economic order quantity for the three key parts. Finally, Section 2.4 describes the simulation model we developed to compare warehousing and cross-docking distribution methods for the key parts.
2.1 Production Scheduling
Our production scheduling model optimizes a production plan to meet the forecasted sales using Microsoft Excel with the Risk Solver add in. The forecasted sales were given as a series of monthly orders from October 2010 through June 2015.
We optimized the production schedule by minimizing costs associated with expanding capacity, maintaining capacity, and postponing vehicle conversions. The decision variables to optimize our production planning model are production capacity addition (A) and conversions performed (x,,).
We assumed the cost of expanding capacity by one unit is a fixed cost and the cost of maintaining one unit of capacity is a constant monthly fee. This model does not take into account the various methods we have at our disposal to increase capacity, such as increasing the number of shifts, mobile teams, or bays. The different methods to increase capacity were considered in the capacity planning model.
2.1.1 Model Setup Objective:
To minimize total production cost
T= min
ET=((Bt x CA) + (At x CB) + Z4=
1(Lo,t
X
CPo,t))
(eq. 2.1)
Decision Variables:
Conversions for order o in a month t (xj) Production capacity addition in month t (A)
Inputs and Constants: Cost of adding capacity (CB)
Cost of maintaining capacity (CD
Cost of postponing conversions by t periods (CPO,)
Demand for order o (O). Customer orders are discrete and will be available the month they are entered. Typically orders are entered in a different month thus XL Hybrids can only start working on the order after the time of entry.
Outputs to the model: Conversions in month t (x)
Production capacity at month t (B)
Outstanding conversion for order o at month t (L,).
The number of outstanding orders is the quantity ordered minus the sum of the vehicles converted for that order:
Lot
o-
t=1Xot
(eq 2.2)Bt = Bt_1 + At (eq 2.3)
The total number of conversions in a month is the sum of the conversions per order in the month:
Xt = Z=1 Xot (eq 2.4)
Constraints:
The production conversions are less than or equal to the capacity:
x t ;
B
tInteger requirements are:
At
E{Z}V
t
The number of late conversions, capacity additions, and current conversions have to be greater than or equal to 0:
L0,t 0 At > 0
Xo,t 0
The list of constants used in the production planning and capacity expansion model is listed in Appendix I.
2.2 Capacity Expansion
In Section 2.1, we explained how we optimized a production plan given a demand scenario. Using this production plan, we now determine the method and size of XL Hybrids' capacity expansion under certain constraints. Our approach is to use Microsoft Excel with Risk Solver Add In to optimize capacity expansion by minimizing operating costs and capital costs while meeting the production plan as well as other constraints that XL Hybrids has. XL Hybrids has the following methods to expand capacity:
" Increase the number of shifts * Increase the number of bays * Increase the number of facilities * Increase the number of mobile teams
We use the production plan which was optimized in our production plan model as a constant, and then minimize the cost to expand capacity to meet or exceed the production plan. We assume the number of employees will be a function of capacity expansions and will expand linearly with capacity
expansion (i.e. these are simply scalar multipliers of shift, bays, facilities, and mobile teams). In our demand scenario, a percentage of conversions must be performed by mobile teams. This is
determined based on service requirements which was stipulated by XL Hybrids because they believe a portion of their customers will require the conversions to be performed at their own facility. We set this as an input in the model which can be modified for different service requirements.
2.2.1 Model Setup Decision Variables:
Number of mobile teams added in month t (z,) Number of bays added in month t (n)
Number of facilities opened in month t (f,) Number of shifts added in month t (s,)
All other variables are derived from these decision variables. The salary and costs of expanding a
unit of capacity are constants in our model.
Objective:
To minimize the cost of expanding capacity (Tc):
Tc = min
ET(FCt + ECt + MTCt)
(eq
2.5)
Where
FC, is the facility costs in month t EC is the employee costs in month t MTCt is the mobile team costs in month t
Facility costs:
Facility costs for month t are calculated using the equation:
FCt = (nt X CBO + Nt x CBM) + (ft X CFO
+
Ft x CFM) + Xt,Fac X CDeI (eq 2.6)Where Variables:
nt is the number of bays added in month t, N, is the total number of bays in month t, f, is the number of facilities opened in month t, Ftis the total number of facilities in month t,
xt is the total number of conversions performed in facilities in month t.
Constants:
CO is the cost of opening a new bay
C,, is the monthly cost of maintaining a bay CF1 is the cost of opening a new facility
CFI is the monthly cost of maintaining a facility
C is the cost of delivering a vehicle to a facility which we designated as a constant and
independent of customer location.
Employee costs:
Employee costs for month t are calculated using the equation
ECt = MFAC,t X PM + CSFAC,t X Pcs + MMT,t X PM+CSMT,t X Pcs (eq. 2.7)
Where
Variables:
MFAC,t is the number of facility technicians at time t
CSACt is the number of facility customer support employees at time t Mf.', is the number of mobile team technicians at time t
CSI', is the number of mobile team customer support employees at time t Constants:
P. is the technician salary which is the same for both mobile team and facility
Pcs is the customer support salary which is the same for both mobile team and facility
Mobile team costs:
The mobile team costs for month t are calculated using the equation
Where Variables:
zt is the number of mobile teams added in month t Zt is the total number of mobile teams in month t Constants:
CM() is the mobile team capital expenditure cost CNINI is the mobile team maintenance cost
Capacity:
The total capacity at time t is determined by:
ft
= (Nt X St X 6FAC + Zt X MT) xd
x w (eq. 2.9)Where
Variables:
N, is the total number of bays St is the total number of shifts
Z, is the total number of mobile teams
Constants:
8FAC is the facility productivity, measured by conversions per bay per shift,
8,, is the mobile team productivity, measured by conversions per mobile team per shift.
d is the number of days per week
w is the number of weeks per month
Employees:
Our model also includes equations to calculate the number of employees.
The number of facility technicians at time t (M 1c) is given by the equation:
MFAC,t =
Nt
XSt
X aFAC (eq. 2.10)The number of facility customer support employees at time t (CSIAjc is given by
The number of mobile team technicians at time t (MNIrrt) is given by
MMT,t =
Zt
x aMrThe number of mobile team customer support employees at time t (CSrr') is given by
CSMT,t = Zt x -MT
Where
Constants:
%FAC is the number of technicians per bay per shift
G[A(c is the number of customer support employees per bay per shift
asT is the number of technicians per mobile team
aFrr is the number of customer support employees per mobile team.
Other Equations: Variables calculated St = St-1 + St Zt = Zt_1
+
ztFt
=Ft-
1+ ft
Nt
=Nt-
1+ nt
from decision variables:
(eq. 2.14)
(eq. 2.15)
(eq. 2.16)
(eq. 2.17)
Constraints:
The optimization model is also constrained by the following: flt
>
xt, V t-t G,V t
Ft ZtY~t <
Y, V tFt
St < 3, V t
(eq. 2.12) (eq. 2.13)zt,nt,ft, st : 0, V t
zt, nt, ft, St
E
{Z}
V
t
Constants:
G is the maximum number of bays per facility
2.3 Inventory Analysis: Silver-Meal Heuristic Model
The Silver-Meal heuristic is an approach to determine the order quantity when there is variable demand. It approximates for the optimal duration of the replenishment quantity based on minimizing total relevant costs per unit time (TRCUT). This heuristic is particularly relevant for startup companies when they are in the developmental phase of their business plan.
2.3.1 Model Setup
The modified Silver-Meal heuristic accounts for inventory carrying cost, order cost, and lost opportunity cost of not taking advantage of the largest possible quantity discount. We have
expanded the model to take into account of economies of scale gained from transportation. Objective:
Minimize total relevant costs per unit time, TRCUT(T) Decision Variables:
Order quantity (q)
Inputs and Constants: Demand for week t (Dt)
Number of weeks (T)
Order Cost (A)
Purchase cost per unit at order quantity q (v)
Lowest possible purchase cost per unit achieved through volume discounts (v) Transportation cost per unit at order quantity q (m)
Inventory carrying cost (r)
The heuristic evaluates TRCUT(T) for increasing values of T until for the first time,
TRCUT(T + 1) > TRCUT(T) (eq. 2.18)
The optimal first replenishment quantity would then be the sum of the demand over t periods,
TRCUT(T) is determined by summing all the relevant costs associated over T periods and dividing by T.
TRCUT(T) = A+Carrying cost+Lost opportunity cost+ mq (eq. 2.20)
Purchase and transportation costs vary as order quantity changes, and are determined through supplier quotes. Transportations costs were modeled with an exponential function that is dependent on the order quantity. Figure 2-1 shows an example of how we estimated transportation cost of the electric motor
Figure 2-1: Estimating Transportation Cost of Electric Motor
0.8 0.7 0.6 J 0.5 80 & 0.2 .3 0.2 0.1 0 0 5000 10000 15000 20000 25000 30000 Weight (bs)
In the calculations for total relevant cost per unit time we define carrying cost and lost opportunity cost:
Carrying cost = ET 0
(t
- 1)Dt * vqrLost opportunity cost
=(vq
- vm) * ZT=0Dt
(eq. 2.21)
2.4 Sourcing and Distribution Network
The main purpose of this section is to describe our simulation model that compares two methods by which component parts can be distributed to XL Hybrids' conversion centers. Our model considers warehousing and transshipment options to get parts from the Newark port to the conversion centers. In the warehousing scenario, different parts are shipped to a central location where they are repacked into individual conversion kits that contain the necessary parts to convert a vehicle. In the transshipment scenario, the components are divided at the port and directly
transported to the individual conversion centers without repacking as a kit.
Due to the complexities and uncertainties of planning the supply chain for a startup, we made several assumptions while designing the model. For a fixed service level, we assumed that transshipment requires higher system inventory levels than warehousing, leading to higher inventory holding costs. There are two reasons for this. First, warehousing allows for risk-pooling between facilities, which reduces overall safety stock levels. Second, repacking components into a conversion kit reduces inventory levels at each conversion center. Since orders come from different suppliers, transshipment means that a separate shipment has to be done for each component. Because there is misalignment of delivery times, there would be mismatched inventory levels between components.
XL Hybrids' key components are currently sourced from foreign suppliers. We chose to focus on planning the distribution network of components from the Newark port to the conversion centers. Because of the cost of air freight and the long sales cycle, component parts will be
transported by ocean freight to the local ports. Planning and scheduling of shipping lanes would be left to the freight forwarders. For both warehousing and transshipment options, we assume
2.4.1 Model Setup
Our model determines the most cost effective distribution option by changing the following variables:
1) Order quantity
2) Demand per month
3) Number of conversion regions
The costs are also affected by several key parameters. Appendix II provides a table summarizing the numbers of all the parameters. These are divided into non-cost components and cost components. The non-cost components are:
1) Safety stock -Since demand forecasts are discrete with unknown variability, we assumed that
each conversion center/warehouse would have 20% of its capacity as safety stock. Given the long sales cycle, this number is based on a market estimate of the percentage of customers that would want expedited conversions.
2) Conversion center storage capacity -Estimated by considering the possible floor sizes of conversion centers. A cost factor is also added to consider the possibility of renting larger floor space.
3) Financial constraint of money tied down in inventory -Determined by capping the number
of months of supply of inventory. It reflects the fact that it is risky for a startup company to have too much money tied in inventory when demand is uncertain.
4) Cost of capital - Set at 20%, which is higher than average, to reflect the expectations of investors and the tighter financial situation that startups have compared to established companies.
The cost parameters are:
1) Transportation cost -Transportation cost for different cargo weight of shipment for one
departure/destination route was requested from Fed Ex freight services. By assuming a fixed and variable component of the cost based on distance, we estimated the transportation costs of different routes.
2) Warehousing costs -Warehousing costs were determined by initial estimates provided by multiple 3rd Party Logistics (3PL) providers located in Newark and Harrisburg which are
proposed locations of the public warehouse that XL Hybrids will use.
3) Transshipment costs -Transshipment costs were estimated by the labor cost required to split
an incoming shipment into smaller shipments for the individual conversion centers.
4) Purchase cost of key components - Determined by quotes from overseas suppliers. A look-up table followed by linear interpolation was used to determine the price. Beyond 400 units ordered, we assumed the price to stay constant.
2.4.2 Calculations
To analyze the cost differences between warehousing and cross-docking, we first determined the total landed cost of obtaining the necessary key components needed for a conversion. As mentioned in the assumption, we ignore the cost of shipping the components from overseas
suppliers to Newark. The model is set up such that order quantity, average demand per month and number of conversion regions opened can be varied to give us the total relevant landed cost for both warehousing and cross-docking scenarios. Simulations were run to determine the optimal
order quantity and the distribution option based on forecasted demand. For each demand scenario, we ran simulations for order quantities of 10, 20, 40, 60, 100, 150, 200, 250, 300, 400, 450, 500, 600,
700 and 800. The order quantity with the lowest total relevant landed cost was then compared to
the demand forecast for that month to estimate inventory and determine the order frequency.
Total relevant landed cost was broken down into sub components: Purchasing,
Transportation, Warehousing, Cross-docking and Inventory. Aside from total relevant landed cost, we also used average money tied up in inventory as a metric. This metric is important for startups to
consider because of greater financial constraints compared to an established company.
Based on the number of units ordered by XL Hybrids, the supplier's price quote for each component would vary. As the order quantity increases, unit cost decreases exponentially up to a certain amount before leveling off. Total purchase cost was obtained by multiplying the number of units ordered with the unit price.
To determine transportation cost, the number of shipments and size of each shipment was calculated. This was based on the structure of the network and the capacity of each conversion center. The weight of the shipment was then used to determine the cost of each shipment based on the following equation:
Shipping Cost = A * Shipment WeightB * Shipment Weight (eq. 2.23)
The coefficients and exponents for the shipment cost are determined by extrapolating from data points obtained from the Fed Ex website. In Figure 2-3 below, A would be 1.89 and B would be
Figure 2-2:Estimating Transportation Cost from Newark to Somerville with an Exponential Function 0.5 045 0.4 0.35 0.3 A Z% 0.25 0.2 0.15 0.15 e Y= 1-89X-02 47 0.1 0.05 0 0 2000 4000 6000 8000 10000 12000 14000 16000 18000 20000 Shipment Weat (bs)
A simplified method to determine warehousing cost was provided by vendors. Warehousing costs consists of four components: storage space ($/pallet/month), order cost ($/order), handling cost ($/pallet), assembling cost ($/kit). Assembling cost is the cost associated with breaking down pallets and reassembling them into conversion kits. We calculated the number of pallets and the frequency that orders will be processed at the warehouse to determine the overall warehousing cost incurred for the warehousing option. For the cross-docking scenario, costs were determined by multiplying the cost of breaking down a pallet with the number of pallets that passes through the port.
Finally, inventory holding cost of each component was determined by the following equation:
Order quantity * Unit cost
Inventory holding cost =
Holding cost per month
*
Average demand per month
The sum of inventory holding cost of each component gives the overall inventory cost. 33
2.5 Others (Interview/Qualitative)
In addition to researching literature and creating models for various parts of XL Hybrids' supply chain, we interviewed supply chain experts and managers at startup companies. We aimed to distill lessons from successful startup companies to assist us in strengthening our Supply Chain framework. In addition we hoped to gain verification of our models and our supply chain approach. In interviewing the various industry experts we asked the following questions and let the discussion
stem from there:
* What are the main constraints that startup companies face?
e Do startup companies typically consider supply chain planning? Is supply chain planning important for startup companies?
* How did your company design the supply chain?
* What factors and key turning points do you consider before making decisions for the following: o Warehousing o Transportation options o Sourcing o Volume discounts o Capacity Expansion o Risk pooling
* What supply chain design factors do you consider most important for startup success? * If you were to change your supply chain, what would you do differently?
e How do supply chains for startup companies differ from an established company, given the constraints they face?
* Can you direct us to good examples of first-rate start up supply chain management? (Literature/case studies?)
3.
MODEL RESULTS AND OUTPUTSOur recommendations for XL Hybrids were based on our models. Some of the key takeaways from our models were:
* Capacity expansion and production scheduling are heavily impacted by customer demand. o If there are few customers then it is recommended to prolong production and delay
capacity expansion in order to decrease capital investments.
o If demand continues to grow, the production and capacity expansion should grow at
a similar rate to demand.
" Increasing work shifts is the most cost efficient method to increase capacity, compared to
adding bays, facilities, or mobile teams.
* From the total cost of goods sold which comprises of inventory holding, purchasing, transportation, warehousing, and order costs, we found that purchasing costs were the primary contributor. Hence, ordering in bulk allows for significant volume discounts. * Negotiating contracts that provide discounts based on annual purchase volumes enables XL
Hybrids to approach Just-In-Time inventory and save on inventory cost. However, these benefits see minimal impact by the 3rd year of operations. This could signal the start of an
RFP process since benefits from annual volume discounts have maxed out.
e XL Hybrids should begin sourcing components via transshipment but quickly transition to warehousing because as volumes increase, it becomes more cost effective to warehouse. Additionally, warehousing allows XL Hybrids to focus on their core business of vehicle conversions.
Scenario analysis was crucial in this context because the business dynamics of a startup company are unpredictable. Understanding the different optimal decisions for each scenario allows XL Hybrids to be prepared to handle uncertainty in their business.
3.1 Production Plan and Capacity Expansion
In this section we focused on four demand scenarios that we believed XL Hybrids (as any startup company) could likely face. For each of the scenarios, we optimized the production plan and the capacity expansion. The scenarios are:
1. Low Demand
2. Variable Demand
3. Exponential Growth
4. Fall in Demand after High Initial Spike 3.1.1 Low Demand Scenario
This scenario is where XL Hybrids has low level demand with some customers and little growth. We ran this scenario as a boundary condition for the model to confirm that the
Figure 3-1: Production Plan for Low Demand Scenario 50 45 40 35 . 30 -D 25 20 -Projected Orders S20 -- Production Plan 15 10 5 0 I Date
When demand is low and remains below capacity, XL Hybrids would perform the conversions as the orders come in since capacity is available. Figure 3-1 illustrates this.
Figure 3-2: Capacity Plan for Low Demand Scenario 70 50 40 30 20 -111-Production Schedule 10 .w-capacity 10 Dat
Figure 3-2 shows that capacity remains constant at the initial current capacity of 60 conversions per month. As expected XL Hybrids should not invest any capital into expansion since XL Hybrids already has the capacity to perform the scheduled production.
Figure 3-3: Quantity of Mobile Teams, Shifts, Bays, and Facilities for Low Demand Scenario 3.5 3 2.5 .2 1 0.5 0 o o '-v Date p-v ~*1 I-v -I I-Vp-1
Figure 3-3 shows capacity to be constant and no additional investment in any of the forms of capacity expansion.
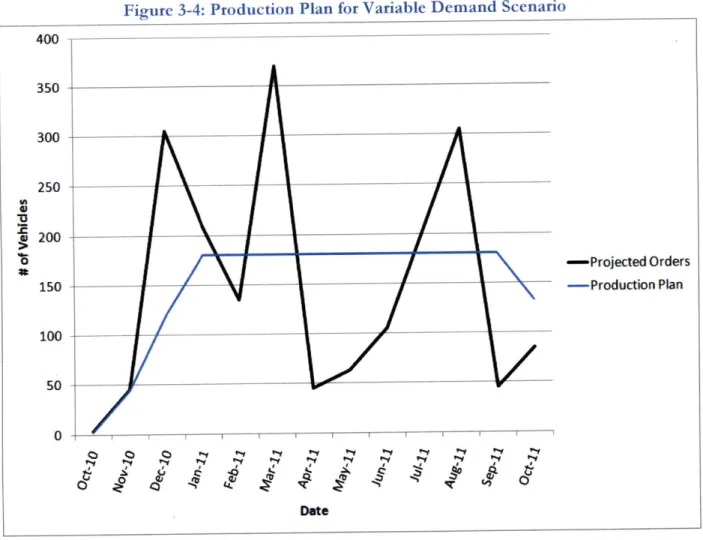
3.1.2 Variable Demand Scenario
In this scenario we envisioned a circumstance where a couple of big customers such as UPS and Staples approach XL Hybrids to hybridize their delivery fleet. In addition to the big customers, XL Hybrids would also receive orders from smaller companies. In this scenario, the big customers would account for a couple of large orders that are sparsely distributed whereas there would be
continuous demand from the small customers.
U ___ U U U fl W I F~ ~F- T T T 1 p-v I Mobile Teams Facilities ActiveShifts I Active Bays 0 I-v
6
0Figure 3-4: Production Plan for Variable Demand Scenario 400 350 300 250 U1 200 -- Projected Orders 150 -Production Plan 100 50 0 : I I I i i I i Q Q CQ . Date
In Figure 3-4, the production plan ramps up, but then levels off. In this scenario, the production plan acts as a demand smoothing technique, so production becomes constant in comparison to the
Figure 3-5: Capacity Plan for Variable Demand Scenario 200 180 160 140 120 00 080 60 40 onSchedule -a-Capacity 20 0 -Date
Figure 3-5 shows that the capacity starts higher than production thus there is no expansion at this point. However, as production grows, the capacity expands and tracks closely with production.
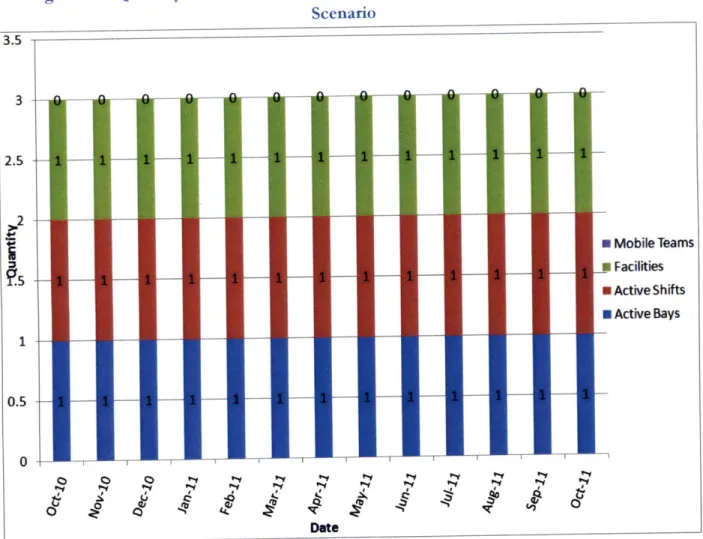
---Figure 3-6: Quantity of Mobile Teams, Shifts, Bays, and Facilities for Variable Demand Scenario
As capacity increases, the method to increase capacity starts with increasing shifts since this is the least expensive way to expand capacity. This is because increasing shifts do not require capital
investment. The increased labor needed with increasing shifts would be the same for adding a bay or adding a facility. We discuss the option to increase the mobile teams in Section 3.1.5.
The incremental increase in capacity associated with adding a shift for one bay is 60
conversions per month. This is low relative to the variability in demand, thus we are able to closely track capacity with production to have high utilization.
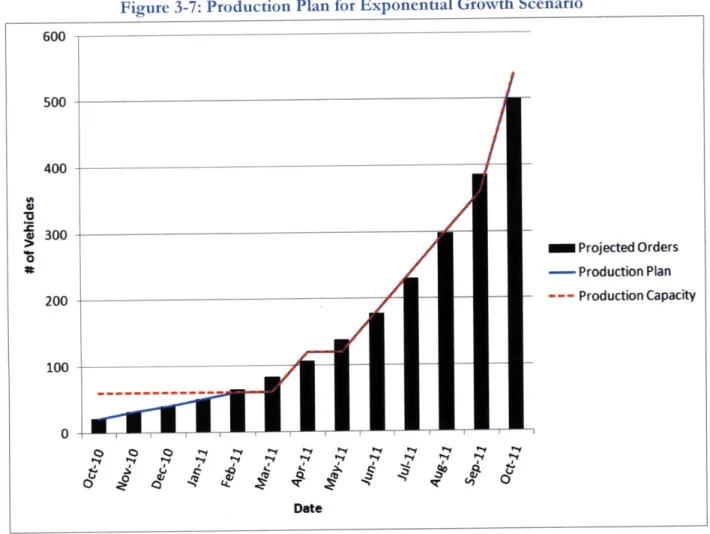
3.1.3 Exponential Growth Scenario
In this scenario, XL Hybrids' sales takes off and customers love the service. As more vehicles are converted, more customers seek XL Hybrids to hybridize their vehicles. We modeled this with close to exponential growth.
Figure 3-7: Production Plan for Exponential Growth Scenario 600 500 400 -300 0
oProjected
Orders - Production Plan 200 - --- Production Capacity 100 -0 0 - I 1 1 1 1 (J0 q) 0 "1 fly DateResults from Figure 3-7 indicate that production will follow the order cycle very closely as demand continues to increase.
Figure 3-8: Capacity Expansion for Exponential Growth Scenario 600 500 400 FA ;300 200 --ProductionSchedule 100 -.- Capacity 0 Date '~1 '0
When expected production continues to increase, capacity will grow very quickly, and trends well with the production schedule. As constrained in the model, capacity follows or exceeds the production schedule.
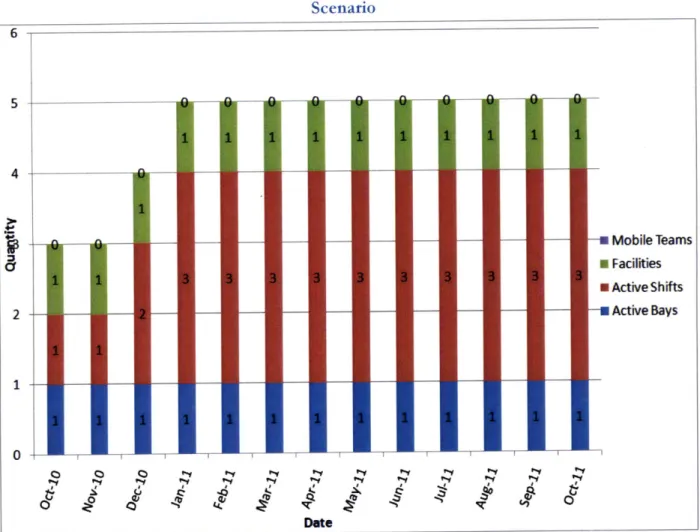
Figure 3-9: Quantity of Mobile Teams, Shifts, Bays, and Facilities for Exponential Growth Scenario 8 7 6 5 3 2 1 0 Date - Mobile Teams * Facilities a Active Shifts M Active Bays
Figure 3-9 shows that capacity expansion starts by increasing the number of shifts. Once this is maximized at three, then the optimal way to expand capacity would be to increase the number of bays.
3.1.4 Fall in Demand after Initial Spike Scenario
In this scenario we propose a situation where two big customers like UPS and Fed Ex contract XL Hybrids to hybridize their fleet of delivery vehicles in the New England area. After the initial success, XL Hybrids is unable to attract more demand in the subsequent months.
Figure 3-10: Production Plan for Fall in Demand after Initial Spike Scenario (Regular Order Deadline) 2500 1-Projected Orders - Production Plan - - - Production Capacity
V
C, 0i C)1 V W~
Vo
IT
IT 0 DateWhen there are two big orders, the production model averages out the demand over 6 months. Thus there is fairly constant production until June 2011, after which the production drops to zero since there are no new orders.
2000
-,,
1500-a 1000
-500
---Figure 3-11: Capacity Expansion for Fall in Demand after Initial Spike Scenario (Regular Order Deadline) 450 400 350 300 250 200 150 100 - -- ProductionSchedule -&-Capacity 50 0 -Date
In order for capacity to meet the production requirements calculated in the production scheduling model, the capacity has to increase in November 2010. The capacity expansion model does not allow for capacity to drop, thus once investment has been put into adding capacity, there is no salvage or selling opportunity for reducing capacity. This means that having excess capacity results in having high operating costs while not earning revenue.
Figure 3-12: Quantity of Mobile Teams, Shifts, Bays, and Facilities for Fall in Demand after Initial Spike Scenario (Regular Order Deadline)
12 10 -8 --a Mobile Teams U Facilities * Active Shifts 4 - Active Bays 2
h i0-
- - -Date "1 .~ q, q~. ~4) 0We found that once again shifts are the least expensive way to increase capacity. For this scenario, it is also recommended to increase the number of mobile teams.
The cost for maintaining and adding the capacity from October 2010 to October 2011 is $2,786,100. This cost is driven by an aggressive production plan. With this production plan, there is excess capacity after the completion of the initial orders, resulting in high operating costs to
maintain capacity that is not used. If we could postpone the production deadline, less capital investment would be needed upfront to complete the orders. Postponing the production deadline by six months yields a total cost of $2,010,900 which is $775,200 less expensive. See plots below for scenario with extended due dates:
Figure 3-13: Production Plan for Fall in Demand after Initial Spike Scenario (Extended Order Deadline) 2500 2000 , 1500 -Projected Orders a 100- Production Plan --- Production Capacity 500 0 Date
When the production deadline is extended by 6 months, the monthly conversions peaks at 300 conversions per month, which is ~120 lower than the production plan using the regular deadlines.
Figure 3-14: Capacity Expansion for Fall in Demand after Initial Spike Scenario (Extended Order Deadline) 350 300 250 200
.A
>150 100 -U-ProductionSchedule 50 -0 DateFor the extended due date, the capacity reaches 300 vehicles per month converted compared to 420 vehicles per month converted for the regular production schedule. Having lower capacity allows for both lower capital investments and lower operating costs.
Figure 3-15: Quantity of Mobile Teams, Shifts, Bays, and Facilities for Fall in Demand after Initial Spike Scenario (Extended Order Deadline)
9 8 7 6 E Mobile Teams --- Facilities N Active Shifts 3 Active Bays 2 -0 C) 0 Q v~
~
I. r1 W 0~~.
. 0 DateFor the slower production schedule, there are 3 mobiles teams in comparison to 6 mobile teams for the regular production schedule expansion plan.
Under this scenario of a few very large orders followed by low demand our recommendation is for XL Hybrids to drag out production so that there is less investment in capital. This also allows for lower operating costs to maintain capacity. Conclusion: "Don't put all your eggs in one basket" since the extra capital investment may result in excess capacity.
3.1.5 Capacity Expansion Cost Summary
In looking at the four methods to increase capacity, we found that increasing mobile teams has the lowest operating cost since hybridizing vehicles using a mobile team does not incorporate a