Supplement of Atmos. Meas. Tech., 14, 819–851, 2021 https://doi.org/10.5194/amt-14-819-2021-supplement © Author(s) 2021. This work is distributed under the Creative Commons Attribution 4.0 License.
Supplement of
Detailed characterization of the CAPS single-scattering albedo monitor
(CAPS PMssa) as a field-deployable instrument for measuring aerosol
light absorption with the extinction-minus-scattering method
Rob L. Modini et al.
Correspondence to:Rob L. Modini (robin.modini@psi.ch)
1
Supplementary information:
Supplementary text S1:
Truncation correction sensitivity analysis
We performed a sensitivity test to determine how the choice of truncation model input parameters affects the calculated,
time-5
resolved truncation correction factors. The results of this analysis are presented in Fig. S12. The following ranges of model
input parameters were investigated. The real and imaginary parts of the aerosol refractive index were varied from 1.50 to 1.59
and 0.00 to 0.01, respectively, based on the summary of measurements presented by Espinosa et al. (2019). The extra path
length beyond the integrating sphere l was varied from 0 to 4.7 cm, based on the results and approach presented and discussed
in Sect. 5. Finally, we tested the sensitivity of γ to a third dimension of information, the accuracy of the measured coarse mode
10
size distribution measurements. Here only two limiting cases were considered with the size distributions integrated up to 10
µm (i.e., PM10) and 2.5 µm (PM2.5). The first case represents the size distributions measured as they were, and the second
case crudely represents the possibility that the CAPS630b sampled coarse particles less efficiently than the APS due, for
example, to sampling line losses.
15
2
Figure S1: Theoretically-calculated relative uncertainty in 1-minute averaged (left panel) and 1-second averaged (right panel) CAPS
20
PMssa babs measurements as a function of the relative uncertainty in the combined scattering correction factor (defined in Eq. 6
using the ratio of the truncation correction factor γ and the instrument cross-calibration factor β). Curves are shown for four different SSA values (grey shading) and two different aerosol loadings (bext of 10 and 100 Mm-1). The curves were generated using
the error model presented in Sect. 2.3 and Appendix A2 with inputs that were chosen to represent instrument characteristics during the Cabauw field campaign, as detailed in the main text.
3
30
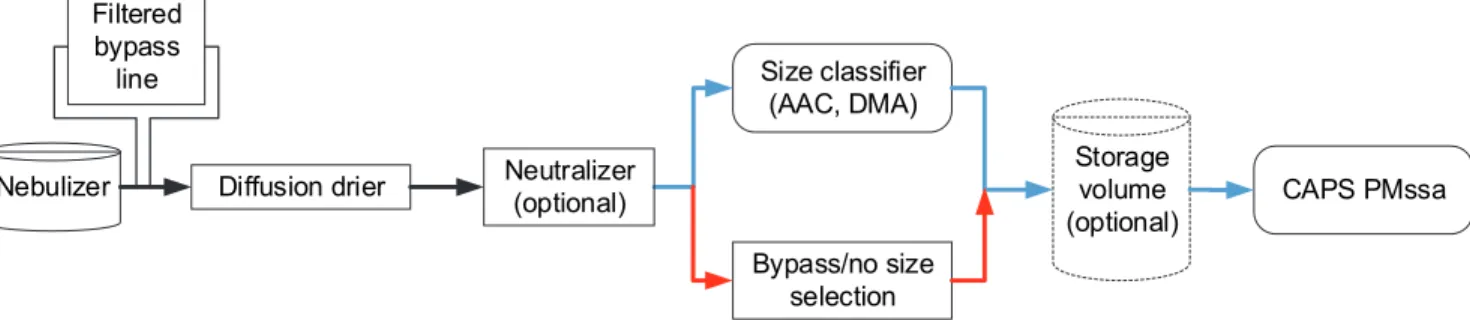
Figure S2: Experimental arrangement for measuring CAPS PMssa scattering cross-calibration (βRayleigh) and scattered light
truncation (γ) factors. Solutions of non-absorbing particles (PSL spheres, ammonium sulfate, DEHS) were used in the nebulizer. When PSL spheres with diameters less than ~200 nm were used, a simplified arrangement involving no size classifier was investigated as a way of measuring cross-calibration factors in the field.
35
Figure S3: Example number 1 of laboratory measurements used to determine the scattering cross calibration factor βRayleigh. The
calibration aerosol was 240 nm PSL particles and a storage volume was employed to cover a broad range of aerosol loadings.
Nebulizer Diffusion drier
Size classifier (AAC, DMA)
CAPS PMssa Bypass/no size
selection
-- Laboratory setup -- Simplified setup for field work
(if solution of small PSL particles used in nebulizer) Storage volume (optional) Filtered bypass line Neutralizer (optional)
4
40
Figure S4: Example number 2 of measurements used to determine the scattering cross calibration factor βRayleigh. The calibration
aerosol was 240 nm PSL particles. These particles were passed directly to the CAPS PMssa without passing through a storage volume, which means the calibration covers a narrower range of aerosol loadings than the calibration shown in Fig. S3.
45
5
50
Figure S6: Example measurements from a field campaign in Melpitz, Germany showing the effect that contamination of the CAPS PMssa optical cavity has on measured extinction and scattering coefficients.
55
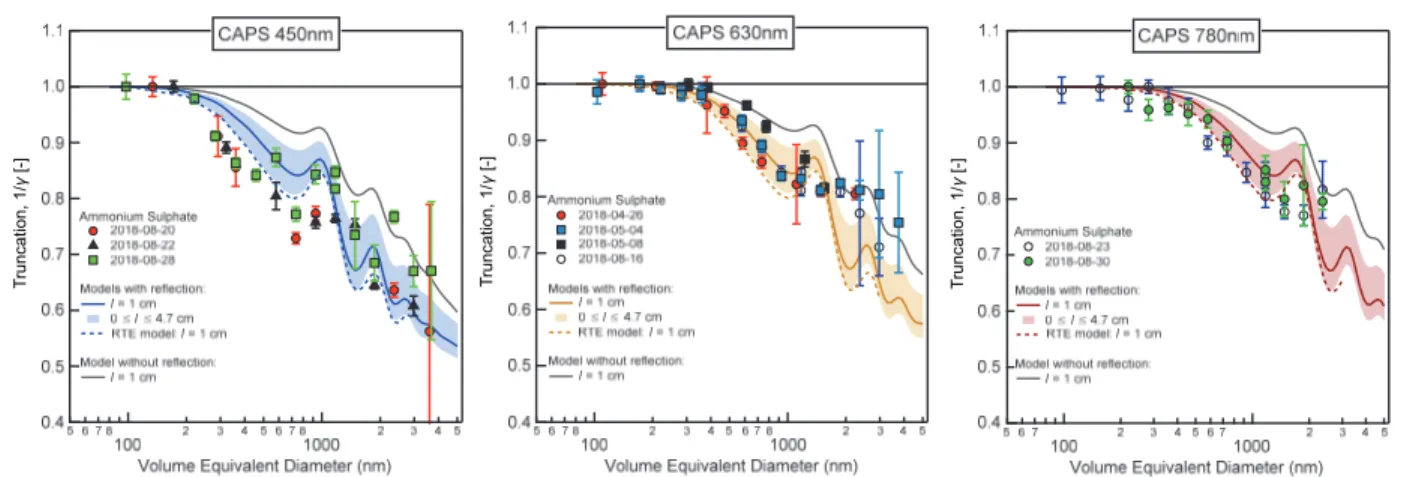
Figure S7: Measured and modeled truncation values as a function of volume equivalent particle diameter for ammonium sulfate. Discrepancies between these measurements and the DEHS measurements in the manuscript are interpreted as being due to the asphericity of the ammonium sulfate particles.
60
3 4 5 6 7 8 10 2 3 4 5 6 7 8 100 2 3 Scattering at 450 [Mm -1 ] (C APS-PMssa) 3 4 5 6 7 8 9 10 2 3 4 5 6 7 8 9100 2 3 Scattering at 450 [Mm-1] (Nephelometer) 4 5 6 7 8 9 10 2 3 4 5 6 7 8 9 100 2 3 E xt in ct ion at 450 [ M m -1 ] (C APS-PMssa) 4 5 6 7 8 9 10 2 3 4 5 6 7 8 9100 2 3 Extinction at 450 [Mm-1] (CAPS-PMex) Clean cavity (Avg. bext,baseline= 758 Mm-1) Medium contamination (Avg. bext,baseline= 1145 Mm-1
) High contamination (Avg. bext,baseline= 1248 Mm
-1
)
Bias of the CAPS-PMssa relative to CAPS-PMex: +5% (clean cavity) +8% (medium contamination) +17% (high contamination) Bias CAPS-PMssa: +2% T runcation, 1/ γ [-] T runcation, 1/ γ [-] T runcation, 1/ γ [-]
6
7
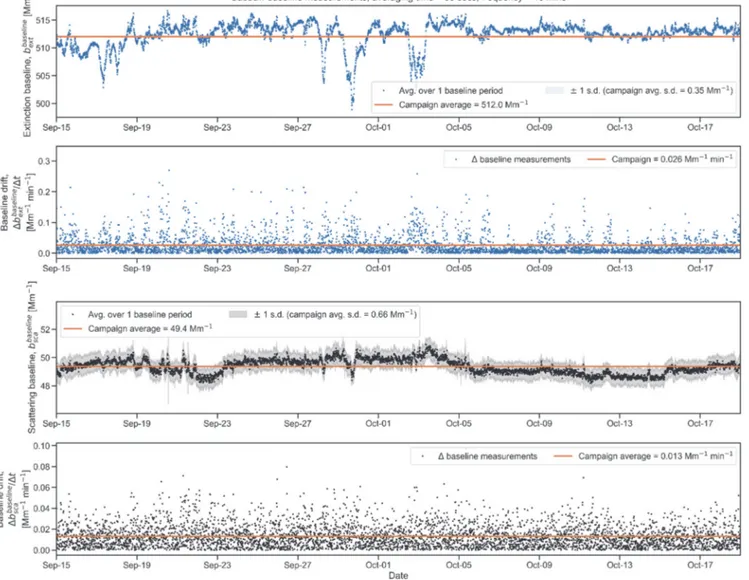
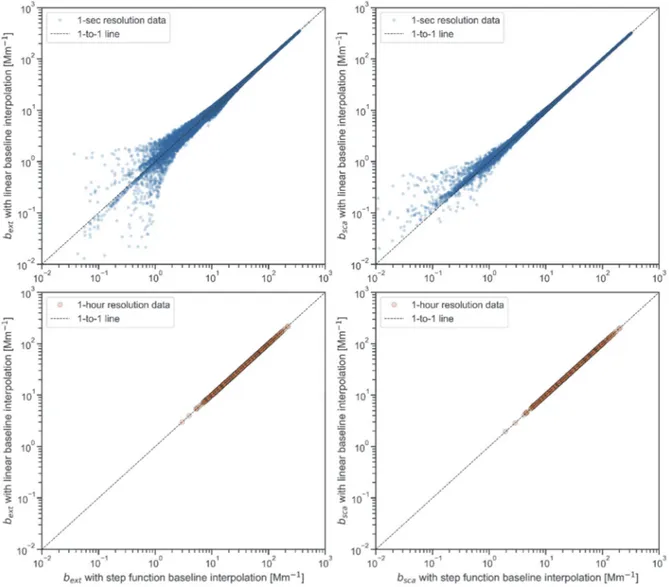
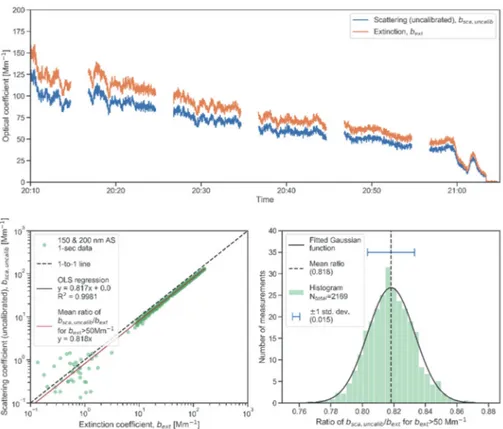
Figure S9: Scattering and extinction coefficients measured by the CAPS630b during the Cabauw field campaign processed with
65
8
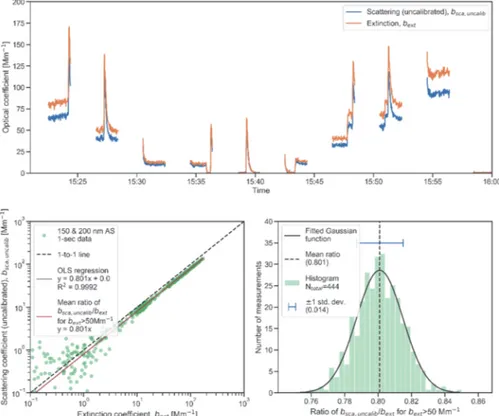
Figure S10: Cross calibration performed for the instrument unit CAPS630b on 2016-09-09 at the beginning of the Cabauw field campaign.
9
Figure S11: Cross calibration performed for the instrument unit CAPS630b on 2016-10-10 at the beginning of the Cabauw field campaign.
10
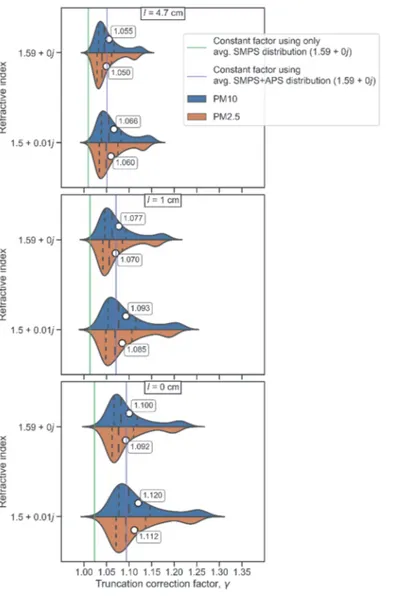
Figure S12: The distributions of hourly time-resolved truncation correction factors (γ) for the Cabauw campaign calculated with the new model introduced in Sect. 2.2.3 and presented in Appendix A1. A range of different model input parameters were chosen to investigate the sensitivity of γ to these parameters. In particular, we varied the refractive index (two values shown on the y-axis), the
80
extra path length l considered in the calculation (three values shown as separate figure panels), and the accuracy of the coarse mode size distribution measurements between diameters of 2.5 and 10 µm, which was crudely represented by changing the upper limit of integration across the size distribution from 10 µm (i.e., PM10) to 2.5 µm (i.e., PM2.5). The vertical green and purple lines in each panel indicate the values of γ that result from using constant, campaign-averaged SMPS and SMPS+APS size distributions in the calculations, respectively, rather than the corresponding time-resolved size distribution measurements.
11
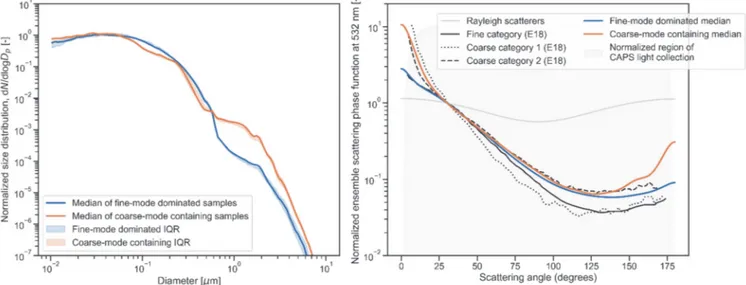
Figure S13: Median normalized size distributions for the fine-mode dominated and coarse-mode containing samples measured during the Cabauw campaign (left panel) along with their corresponding scattering phase functions at 532 nm calculated using Mie
90
theory and an assumed refractive index of 1.59 + 0.01i (right panel). Three average scattering phase functions measured by Espinosa et al. (2018; referred to as ‘E18’ in the legend) are also displayed in the left panel. These measurements were made for ambient aerosols in the USA. The E18 fine category is comprised of measurements of aerosols that were classified by Espinosa et al. (2018) as ‘urban’, ‘biomass burning’, and ‘biogenic’. The E18 coarse categories numbered 1 and 2 correspond to the ‘SEAC4RS dust’ and
‘CO storms’ categories, respectively, that were reported by Espinosa et al. (2018). Both of these aerosol types likely contained
95
significant dust fractions. A normalized scattering phase function for an ensemble of Rayleigh light scatterers is also displayed in the right panel for reference.
12
100
13
Figure S15: Comparison of CAPS PMssa absorption coefficients at 630 nm (࢈ࢇ࢈࢙) and MAAP absorption coefficients at 637 nm
105
(࢈ࢇ࢈࢙ૠ) for five different truncation correction scenarios. The three columns represent different subsets of the dataset, as indicated
14
points are colored by the SSA values calculated from the same CAPS PMssa data shown in each panel. The mean ratios of CAPS PMssa to MAAP babs are plotted as solid orange lines in each panel. The uncertainty bands represent the 95th percentiles of theoretical
uncertainties calculated with the error model and inputs described in Sect. 2.3, with relative uncertainties in γ of 4, 9, and 6% for
110
the fine-mode dominated, coarse-mode containing, and full dataset, respectively.
Figure S16: Curves representing the probability that light is reflected from the glass sampling tube of the CAPS PMssa for a single
115
reflection event (Eq. A7), the number of reflection events that is needed for light to exit the integrating sphere in the instrument (Eq. A8), and the resulting total fraction of light that is reflected out of the sphere (Eq. A9), all as a function of scattering angle θ and for the case of a particle at the center of the optical cavity of the instrument (z = 0 cm)