HAL Id: hal-02350367
https://hal.archives-ouvertes.fr/hal-02350367
Submitted on 25 Nov 2020HAL is a multi-disciplinary open access archive for the deposit and dissemination of sci-entific research documents, whether they are pub-lished or not. The documents may come from teaching and research institutions in France or abroad, or from public or private research centers.
L’archive ouverte pluridisciplinaire HAL, est destinée au dépôt et à la diffusion de documents scientifiques de niveau recherche, publiés ou non, émanant des établissements d’enseignement et de recherche français ou étrangers, des laboratoires publics ou privés.
Atmospheric nitrate export in streams along a montane
to urban gradient
Ilann Bourgeois, Joel Savarino, Julien Nemery, Nicolas Caillon, Sarah
Albertin, Franck Delbart, Didier Voisin, Jean-Christophe Clement
To cite this version:
Ilann Bourgeois, Joel Savarino, Julien Nemery, Nicolas Caillon, Sarah Albertin, et al.. Atmospheric nitrate export in streams along a montane to urban gradient. Science of the Total Environment, Elsevier, 2018, 633, pp.329-340. �10.1016/j.scitotenv.2018.03.141�. �hal-02350367�
Atmospheric nitrate export in streams along a montane to
1
urban gradient
2 3
Ilann Bourgeoisa,b,§, Joel Savarinoa, Julien Némerya, Nicolas Caillona, Sarah
4
Albertina, Franck Delbartc, Didier Voisina, and Jean-Christophe Clémentb,d
5 6
a
Université Grenoble Alpes, CNRS, IRD, Grenoble INP*, IGE, F-38000, Grenoble,
7
France
8 b
Université Grenoble Alpes, CNRS, LECA, F-38000, Grenoble, France
9 c
Université Grenoble Alpes, CNRS, SAJF, F-38000, Grenoble, France
10
d
Université Savoie Mont Blanc, INRA, CARRTEL, F-74200, Thonon-Les Bains,
11
France
12 13
* Institute of Engineering Univ. Grenoble Alpes
14
§ ilann.bourgeois@noaa.gov
Abstract 16
Nitrogen (N) emissions associated with urbanization exacerbate the atmospheric
17
nitrogen influx to remote ecosystems – like mountains –, leading to well-documented
18
detrimental effects on ecosystems (e.g., soil acidification, pollution of freshwaters).
19
Here, the aim was to evaluate the importance and fate of N deposition in a watershed
20
along a montane to urban gradient, using a multi-isotopic tracers approach (Δ17
O,
21
δ15N, δ18O of nitrate, δ2H and δ18
O of water). In this setting, the montane streams
22
had higher proportions of atmospheric nitrate compared to urban streams, and
23
exported more atmospheric nitrate on a yearly basis (0.35 vs 0.10 kg-N ha-1 yr-1). In
24
urban areas, nitrate exports were driven by groundwater, whereas in the catchment
25
head nitrate exports were dominated by surface runoffs.The main sources of nitrate
26
to the montane streams were microbial nitrification and atmospheric deposition
27
whereas microbial nitrification and sewage leakages contributed most to urban
28
streams. Based on the measurement of δ15N and δ18O-NO3-, biological processes 29
such as denitrification or N assimilation were not predominant in any streams in this
30
study. The observed low δ15N and δ18
O range of terrestrial nitrate (i.e., nitrate not
31
coming from atmospheric deposition) in surface water compared to literature
32
suggests that atmospheric deposition may be underestimated as a direct source of
33
N.
34 35 36
Keywords: Nitrogen, deposition, Δ17O, subalpine, isotope, Lautaret
37 38
Highlights 39
40
How is nitrogen deposition reflected in streams NO3- exports in the French Alps? 41
42
NO3- exports in seven streams along an altitude gradient were monitored for two 43
years.
44 45
NO3- isotopic composition (Δ17O, δ15N, δ18O) was analyzed to apportion the sources. 46
47
Up to 21% of NO3- in montane streams and 5% in urban streams was unprocessed 48
NO3-atm.
49 50
Nitrification of atmospheric and mineralized NH4+ was the ubiquitous main NO3 -51
source.
1. Introduction 53
Atmospheric nitrogen (N) deposition has increased 10-fold over the past
54
century, increasingly contributing to the global N availability (Galloway et al., 2004).
55
Anthropogenic activities such as fossil-fuel combustion, agriculture, and fertilizers
56
use are responsible for this increase (Fowler et al., 2015; Galloway et al., 2008;
57
Vitousek et al., 1997), with impacts observed in remote ecosystems (Hastings et al.,
58
2009; Holtgrieve et al., 2011; Preunkert, 2003). High N loading to the environment
59
has been documented for many ecosystems (Aber et al., 1989; Clark et al., 2017;
60
Elser et al., 2009; Matson et al., 2002). To address this issue, global efforts are
61
underway to alleviate N inputs into ecosystems, aiming at “minimizing the
62
consequent harm to humans and the environment” (International Nitrogen Initiative,
63
http://www.initrogen.org).
64
Nitrate concentrations, and fluxes in soils and streams have often been used
65
to assess the N saturation status in watersheds (Aber et al., 1989; Baron and
66
Campbell, 1997; Lovett and Goodale, 2011). However, N exports in stream depend
67
on multiple parameters such as basin topography (Balestrini et al., 2013; Clow and
68
Sueker, 2000), cover (Barnes et al., 2014; Williams et al., 2016) and
land-69
management (Barnes and Raymond, 2010; Burns et al., 2009; Lefebvre et al., 2007).
70
As streams integrate many processes at the watershed scale, understanding the
71
specific sources of NO3- is important to (1) evaluate the respective contribution of 72
biological and anthropogenic sources, (2) clarify the fate of deposited N in the
73
environment, and (3) understand the origin and the development of N saturation.
74
Mountainous ecosystems are particularly sensitive to increased N inputs by
75
atmospheric deposition (Baron et al., 2000, 2005, 2011), as they are historically
N-76
limited (Kaye and Hart, 1997). Critical loads for these ecosystems are among the
lowest for pristine environments (Baron et al., 2011; Bowman et al., 2006; Nanus et
78
al., 2017), making them vulnerable to long-range transport of atmospheric N emitted
79
from distant sources (Mast et al., 2014; Wasiuta et al., 2015). Atmospheric deposition
80
of N has been shown to contribute significantly, either directly or indirectly, to
year-81
round NO3- exports from mountainous catchments (Hundey et al., 2016; Nanus et al., 82
2008), typically showing a pulse at spring as soils subsurface NO3- reservoirs are 83
flushed by snowmelt water (Kendall et al., 1995; Williams et al., 2009; Williams and
84
Melack, 1991).
85
Atmospheric deposition is also a major source of N to urban areas, which
86
receive much higher loads than adjacent environments (Bettez and Groffman, 2013;
87
Fang et al., 2011; Hall et al., 2014; Rao et al., 2014; Templer et al., 2015). Local and
88
regional emissions and subsequent deposition of fuel-combustion derived NOx and 89
ammonia (NH3) are responsible for this pattern (Galloway et al., 2004; Kean et al., 90
2000). NOx compounds are oxidized into NO3- within hours (Beirle et al., 2011), then 91
scavenged from the atmosphere by wet and dry deposition (Hertel et al., 2012). In
92
the atmosphere, NH3 is in equilibrium with ammonium (NH4+), the other primary 93
component of bulk N deposition. Because of the particular topography of urban
94
basins (extended impervious surface, rapid precipitation runoff), urbanization can
95
lead to high NO3- exports in freshwater bodies (Groffman et al., 2004; Riha et al., 96
2014), with major ecological, economic and health consequences (Dodds et al.,
97
2009).
98
This study aims at evaluating how atmospheric deposition of N is reflected in
99
NO3- exports in several streams along a montane to urban gradient in the French 100
Alps. Isotopic (Δ17O, δ15N, δ18O of nitrate, δ2H and δ18O of water) and
hydro-101
chemical techniques were combined to evaluate the drivers of NO3- inputs and 102
removal in all streams. The first hypothesis was that due to a higher contribution from
103
other sources (e.g., sewage, fertilizers) in urban areas compared to the mountains,
104
coupled with higher local atmospheric N inputs, total NO3- and atmospheric nitrate 105
(NO3-atm) exports should increase along the gradient. The second hypothesis was
106
that different NO3-atm export dynamics should be observed in urban streams compare
107
to montane streams, due to different hydrological drivers that need to be determined.
108
To test these hypotheses, (1) NO3- concentration and isotopic composition were 109
determined in six streams and one lake, ranging from 2000m above sea level (a.s.l.)
110
to 200m (a.s.l.) in the French Alps, (2) the annual export fluxes of NO3-atm and total
111
NO3-were compared across sites along the gradient, (3) the hydrological drivers of 112
the seasonal variability in NO3-atm proportion were identified and (4) the additional
113
sources of NO3- in each watershed were determined. 114
2. Methods 116
2.1 Study site and selected streams 117
The Romanche Valley, located in the central French Alps, spreads from the
118
Lautaret pass (2058m a.s.l.) down to Grenoble (250m a.s.l.) (Figure S1a and b). The
119
Grenoble conurbation counts around 500 000 inhabitants, and is the biggest alpine
120
metropolis in France.
121
Six streams and one lake were sampled from the Lautaret pass to Grenoble,
122
draining watersheds of increasing size and with distinct geomorphic and
123
biogeographic characteristics (Table 1). Two alpine streams were sampled at
124
~2000m a.s.l.. These drain the South exposed side of the Lautaret pass (S-upper
125
montane, n = 157) and the North exposed side (N-upper montane, n=93), where for
126
the latter the stream is mainly fed by glacier melt (Figure S1c). The mid montane
127
stream (n=67) was sampled at ~1600 m a.s.l., 6km down from the Lautaret pass
128
(Figure S1c). All three streams are tributaries of Romanche (lower montane stream,
129
n=127) that was sampled 15km down from the Lautaret pass at ~1000m a.s.l., before
130
ending in Chambon lake (Figure S1d). The lake (~ 900m a.s.l., n=29) is an artificial
131
reservoir managed by the French national electricity company (EDF), 21km down
132
from the Lautaret pass. The two urban streams (~210 m a.s.l.) were located, for one,
133
upstream from Grenoble main urbanized area (upper urban stream, n=48) and, for
134
the other, downstream (lower urban stream, n=45), and were separated by 8km
135
(Figure S1e). The lower urban stream waters are derived from the lower montane
136
stream (and the lake). The upper urban stream, Isère, has surface water from
137
another alpine valley. The upper urban stream flows through residential areas,
138
gardens, and some arable fields prior to the sampling location whereas the lower
urban site abuts industrial developments as well as residential neighborhoods
140
(Dutordoir, 2014).
141 142
2.2 Deposition and streams sampling, discharge and conductivity 143
Atmospheric wet and dry deposition samples were collected using a WADOS
144
Kroneis collector (GmbH Austria) at the S-upper montane site from April 2016 to April
145
2017. A moving lid – connected to heated moisture sensor – ensured the separated
146
collection by covering alternatively the dry funnel (under rain or snow conditions) and
147
the wet funnel (the rest of the time). The deposition collector was installed on the roof
148
of the Lautaret pass Alpine Research Station (~210 m a.s.l.),
149
https://www.jardinalpindulautaret.fr) to reduce the impact of ground turbulence and
150
input of soil particles. Samples were collected approximately every three weeks.
151
Precipitation samples were kept at 4°C during the sampling period, then frozen until
152
further analysis. After exposure to the atmosphere, the dry deposition funnel was
153
rinsed with 500 mL of MilliQ water, and the sample was stored at -20°C.
154
Stream and lake water was sampled at all sites according to the Niwot Ridge
155
LTER protocol (Williams and Melack, 1991). In short, samples (total n = 566) were
156
collected manually in 1L Nalgene bottles, previously washed 3 times with MilliQ water
157
(18.2 MΩ.cm-1
at 25°C) and rinsed three times with stream water before collection.
158
All samples were then kept at -20°C until further treatment. Water samples were
159
collected on a weekly to monthly basis from January 2015 to December 2016, with
160
increased sampling frequency in two of the upper tributaries from April to May 2016.
161
During this intensive sampling period, water was collected using three automatic
162
water samplers (Teledyne ISCO® 3700) every two or three hours at the S-upper and
163
lower montane sites. Water conductivity, shown to be a good proxy of discharge
(Weijs et al., 2013), and water temperature were also intensively monitored (2
165
minutes stepwise) over that period using CTD-Diver® sensors. Spring sampling was
166
sporadic in the N-upper montane site because of persistent snow cover. Winter
167
sampling was not possible at the lake site as it was frozen.
168
Discharge data was obtained from the national discharge-monitoring network
169
(Banque Hydro) or measured every hour for both lower montane and urban site.
170
Stream stage at the upper urban site was monitored every 30 minutes using water
171
level gauge sensor (OTT®) at Grenoble Campus station (more details in Mano, 2008;
172
Némery et al., 2013). Discharge was estimated from stage measurements by using
173
rating curve (water level vs discharge) (Némery et al., 2013). Continuous discharge
174
could not be measured at the upper and mid montane sites due to the torturous
175
nature of the streams. Precipitation data were obtained from the Alpine Mountain
176
Meteorological Office Network (www.romma.fr) at the upper montane site and using
177
a rain gauge (Précis Mécaniques®) on a building roof of the Grenoble Campus, close
178
to the upper urban site.
179 180
2.3 Chemical and isotopic analysis 181
All stream and deposition samples were left to unfreeze at ambient
182
temperature prior to being filtered using 0.45μm Whatman GD/X syringe filters linked
183
to a peristaltic pump. They were subsequently analyzed for ion concentrations
184
([NH4+], [NO3-], [SO42-], [Cl-], [Ca2+]) using a colorimetric technique (Gallery Plus, 185
Thermo Fisher Scientific, Waltham, Massachusetts, USA). An analytical error <0.01
186
mg L-1 was determined for all ions based on the standard deviation of commercial
187
control solutions (ThermoFisher®) analyzed as unknowns. Major ions such as sulfate
188
and calcium and chloride are often used as hydro-chemical tracers of water
flowpaths or water sources (Briand, 2014; Devito et al., 2000; Hall et al., 2016;
190
Stoewer et al., 2015), and were measured to identify the dominating hydrological
191
regimes in the studied sites.
192
All samples were concentrated on an anionic resin (0.6mL AG 1-X8 resin, Cl−
-193
form, Bio-Rad) with recovery efficiency over 98.5% (Erbland, 2011) and eluted with
194
10mL of a 1M NaCl solution for isotopic analysis (Templer and Weathers, 2011).
195
Isotopic analyses of NO3- (Δ17O, δ18O and δ15N) were conducted on an MAT 253 196
IRMS using an adapted version of the denitrifier method (Kaiser et al., 2007; Morin et
197
al., 2008). More details about the experimental setup can be found elsewhere (SI
198
Text). The analytical errors – calculated as the standard deviation of the residuals
199
from the linear regression between raw data of the reference standards (USGS 32,
200
USGS 34 and USGS 35) and their accepted values – were ± 0.4, 1.5 and 0.3‰ for
201
Δ17
O, δ18O and δ15N of NO3-, respectively. Slopes and intercepts of the linear 202
regressions are then used to convert raw sample data into calibrated values
203
(VSMOW scale for O isotopes, and N2-air scale for N isotopes).
204
A subset of stream, rain, and snow samples (collected in winter 2015-2016)
205
were sent for δ2H and δ18
O analyses on a Picarro L2130-i at the Laboratoire des
206
Sciences et du Climat (LSCE) in Paris, France. The analytical error – inferred from
207
the replicate analysis of internal standards calibrated against V-SMOW2 et V-SLAP2
208
standards – was ± 0.7 and 0.2 ‰ for δ2
H and δ18O of H2O, respectively. 209
210
2.4 NO3- sources apportionment
211
A number of previous studies have used the dual isotope approach (δ18
O and
212
δ15
N of NO3-) to track the spatio-temporal variability of sources contribution to NO3 -213
pools in a large variety of environmental matrixes (Campbell et al., 2002; Durka et al.,
1994; Elliott et al., 2009; Yang and Toor, 2016). Biochemical processes such as
215
denitrification or assimilation have also been shown in laboratory experiments to
216
distinguishably enrich residual NO3- in heavier isotopes, here 15N and 18O (Granger et 217
al., 2004, 2010; Treibergs and Granger, 2017), although this enrichment can be
218
diluted by newly nitrified NO3- with low N and O isotopic values (Granger and 219
Wankel, 2016; Mayer et al., 2002). Environmental studies also reported characteristic
220
NO3- isotopic enrichment for denitrification (Clément et al., 2003; Fang et al., 2015; 221
Wexler et al., 2014), assimilation (Emmerton et al., 2001; Estrada et al., 2017; X.-Y.
222
Liu et al., 2013) or photolysis (Frey et al., 2009; Shi et al., 2015; Ye et al., 2016).
223
However, the isotopic fingerprint of biological processes can lead to inaccurate NO3 -224
source apportionment in some cases, especially in delineating the respective
225
contribution of the microbial and the atmospheric sources (Michalski et al., 2004;
226
Riha et al., 2014; Rose et al., 2015a).
227
In the past few years, a growing number of studies have used an isotopic
228
particularity of NO3-atm to quantify the contribution of atmospheric deposition to
229
terrestrial N pools (Costa et al., 2011; Hundey et al., 2016; Tsunogai et al., 2014).
230
NO3-atm is enriched in 17O due to its production pathways (i.e., oxidation of NOx by 231
O3), showing a deviation from the Terrestrial Fractionation Line (Thiemens, 2006). 232
Δ17O is a quantification of this deviation, calculated as Δ17O = δ17O - 0.52 * δ18
O in
233
the present work. Δ17
O value of NO3-atm generally ranges between 20 and 35‰ in
234
temperate latitudes (Morin et al., 2009; Savarino et al., 2007), whereas Δ17
O value of
235
NO3- from all other sources (industrial fertilizers, nitrification) or of biologically 236
processed NO3-atm, is 0‰ (Michalski et al., 2004, 2015). In this study, these two
237
distinct Δ17
O values were used as end-members in a simple mixing model to quantify
238
unprocessed NO3-atm proportion (ƒatm) in streams, according to Michalski et al.
(2004):
240 241
(Eq. 1) ƒatm = (Δ17O-NO3-sample / Δ17O-NO3-atm)
242 243
The atmospheric fraction (ƒatm) and the terrestrial fraction of NO3- (ƒter = 1 -
244
ƒatm) can be used to remove the isotopic influence of NO3-atm on samples, and allow
245
for a better interpretation of biological processes that affect δ15N and δ18
O (Dejwakh
246
et al., 2012; Michalski et al., 2004; Riha et al., 2014; Tsunogai et al., 2010). δ18
O vs
247
δ15
N plots have been intensively used to evaluate sources of N and potential
248
processes (denitrification, assimilation) in the environment (Burns et al., 2009; Durka
249
et al., 1994; Griffiths et al., 2016; Kendall et al., 1995; X.-Y. Liu et al., 2013).
250
However, because of strongly distinct δ18
O-NO3-atm values compared to δ18O-NO3-ter,
251
even a low ƒatm can lead to scatter in a dual-isotope plot. Removing the atmospheric
252
δ15
N and δ18O components from environmental samples leads to an easier
253
assessment of biological processes, such as assimilation or denitrification. This
254
isotope correction was applied on the samples using the isotopic mass balances from
255
Riha et al. (2014):
256 257
(Eq.2) δ18Oter = (δ18Osample - δ18Oatm * ƒatm)/ƒter
258 259
(Eq.3) δ15Nter = (δ15Nsample - δ15Natm * ƒatm) / ƒter
260 261
δ15
Natm and δ18Oatm were inferred from NO3- in wet and dry atmospheric deposition 262
(see section 3.2). A formal propagation of uncertainty was performed to assess the
263
error associated with individual values of ƒatm, δ18O-NO3-ter and δ15N-NO3-ter. Although
the error associated with individual values can be large (Figure S2), averaging across
265
samples throughout the year results in a robust estimate of annual ƒatm, δ18O-NO3-ter
266
and δ15
N-NO3-ter values (Dejwakh et al., 2012).
267 268
2.5 Fluxes of NO3- and NO3-atm
269
NO3- yields (Fm in kg-N w-1) were calculated at each site – when possible – on 270
a weekly basis using the mean weekly discharge (Qm in m3 s-1) and instantaneous 271
concentrations ([NO3-]i in mg-N L-1), as follows: 272
273
(Eq.4) Fm = Qm * [NO3-]i
274 275
Total specific annual stream loads of NO3- (Ftot in kg-N ha-1 yr-1) were calculated as 276
the annual sum of weekly NO3-exports during the study period (2015 and 2016), as 277
follows:
278 279
(Eq.5) Ftot = / (watershed area)
280 281
Finally, total annual NO3-atmloads (Fatm) were calculated for each year by multiplying 282
the total annual stream yield of NO3-(Ftot) by the discharge-weighted annual mean 283
ƒatm in the stream (see Eq. 1), according to Tsunogai et al. (2014, 2010):
284 285
(Eq. 6) Fatm = Ftot * ƒatm
286 287
When [NO3-] or Δ17O values were not available for a given date (n=4, 2 and 2 for the 288
lower montane, upper urban and lower urban streams, respectively), they were
replaced by the mean [NO3-] or Δ17O-NO3- values measured on the previous and the 290
following dates, to capture temporal variations due to hydrological events. Note that
291
the use of instantaneous [NO3-] to calculate weekly streams NO3- loads might over or 292
under estimate the real NO3- yield in streams. 293
294
2.6 Statistical analysis 295
A Mann-Whitney test was applied to surface water data to determine whether
296
mean concentrations and isotopic values were significantly different between
297
streams. A Spearman test was applied to evaluate the correlation between stream
298
water parameters (typically Δ17O, δ18O, δ15
N and ion concentrations). Differences
299
and correlations were considered significant when the p value was ≤0.05. All
300
statistical analyses were conducted using R software (v3.2.3). Unless specified
301
otherwise, the uncertainty accompanying the mean values is the standard deviation.
302 303
3. Results 304
3.1 Precipitation and discharge 305
Cumulated precipitation was 537 and 609mm in 2015 and 804 and 740mm in
306
2016 at the upper montane and the urban sites, respectively. Discharge at the lower
307
montane site reflects a snowmelt influenced hydrological regime. It peaked up to 30
308
m3 s-1 in spring, and was significantly higher from April to October compared to the
309
rest of the year. Discharge at both urban sites was consistent with a hydrological
310
regime driven by snowmelt in spring-summer (main maximum), and rainfall in autumn
311
(secondary maximum), a dual contribution similar to what was obtained in the
312
Colorado Front Range (Cowie et al., 2017). At the upper urban site, discharge
313
peaked at 900 m3 s-1, whereas maximum discharge was 300 m3 s-1 at the lower
urban site, a difference due to the streams draining two distinct watersheds (Figure
315
S3).
316 317
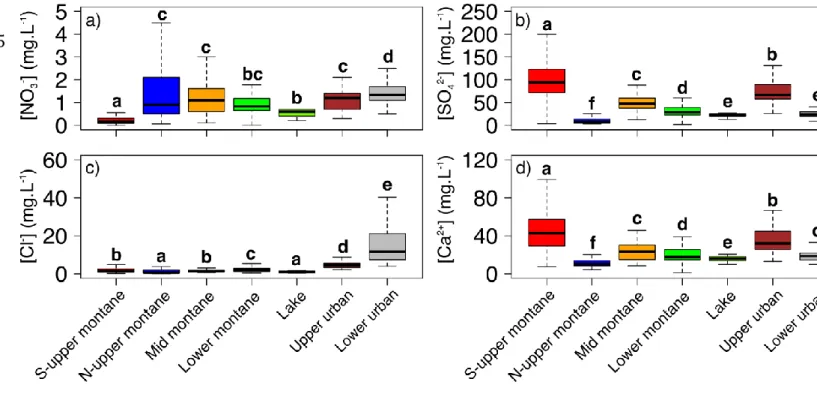
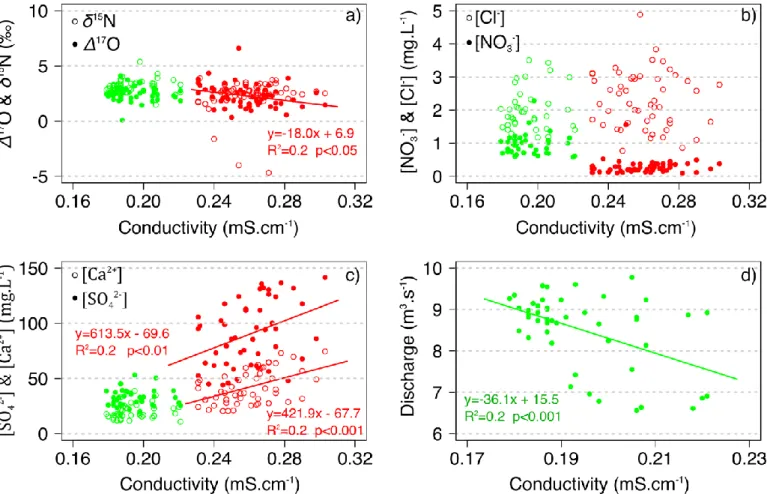
3.2 Comparison of dissolved solutes across sites
318
Solutes concentration varied by up to 3 orders of magnitude among
319
precipitation and streams samples (Table S2 and Figure 1). [NH4+] was low in both 320
dry and wet deposition at the S-upper montane site, and mostly (>90%) under the
321
detection limit (<0.02 mg L-1) in all streams. [NO3-] was significantly higher in rain 322
samples compared to stream samples. The highest annual mean [NO3-] was 323
measured in the lower urban stream (1.4 ± 0.5 mg L-1) and the lowest in the S-upper
324
montane stream (0.2 ± 0.2 mg L-1). [NO3-] at the N-upper montane, mid montane, 325
lower montane and upper urban sites were not statistically different (1.4 ± 1.3, 1.1 ±
326
0.6, 1.0 ± 0.6 and 1.1 ± 0.4 mg L-1, respectively). [SO42-] and [Ca2+] were both very 327
low in precipitation relative to streams. The S-upper montane stream exhibited the
328
highest annual mean [SO42-] and [Ca2+] (98.5 ± 39.5 and 44.5 ± 18.2 mg L-1, 329
respectively), followed by the upper urban stream (74.1 ± 26.9 and 35.2 ± 13.1 mg L
-330 1
, respectively), and the lowest concentrations were measured at the N-upper
331
montane site (22.1 ± 35.9 and 16.5 ± 16.0 mg L-1, respectively). [Cl-] was very low in
332
precipitation samples and in most montane streams (mean values all < 3 mg L-1),
333
respectively. Higher annual mean [Cl-] were measured in the urban streams (4.7 ±
334
1.8 and 16.6 ± 12.3 mg L-1 for the upper and lower urban stream, respectively).
335 336
3.3 Isotopic composition of NO3- in precipitation and streams 337
Mean annual NO3-atm isotopic values (Table S1) were non-significantly higher
338
in dry deposition than in wet deposition (significant only for δ15
N-NO3-), a pattern 339
widely monitored at temperate latitudes (Beyn et al., 2014; Freyer, 1991; Mara et al.,
340
2009). Mean and associated standard deviation of Δ17
O-NO3- in precipitation and dry 341
deposition were 26.4 ± 3.2 and 24.7 ± 3.5 ‰, respectively. These values are in the
342
same range as previously reported data for Δ17
O-NO3-atm (Costa et al., 2011;
343
Michalski et al., 2004; Tsunogai et al., 2010, 2016). The mean Δ17
O value for total
344
deposition was 25.6 ± 3.3 ‰, and was used to quantify the atmospheric component
345
of NO3- pools in streams (see section 2.4, Eq. 1). Mean annual total δ18O-NO3-atm
346
(70.8 ± 7.2 ‰) and δ15
N-NO3-atm (-4.8 ± 5.9 ‰) are also consistent with a reservoir of
347
exclusively NO3-atm (Kendall et al., 2007), and these values were used to correct
348
samples from their atmospheric δ18O and δ15
N components (see section 2.4, Eq.2
349
and 3).
350
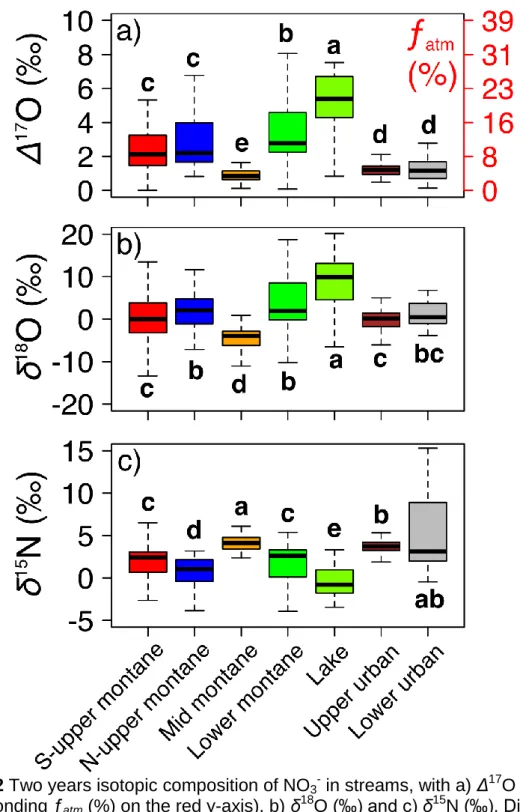
Significantly higher annual mean Δ17
O-NO3- was measured in montane 351
streams compared to urban streams, with the exception of the mid montane site (1.0
352
± 0.7 ‰), which exhibited the lowest values (Figure 2a). Both upper and lower urban,
353
along with the mid montane streams were also characterized by the highest annual
354
mean δ15
N-NO3- (3.7 ± 1.0 ‰, 4.9 ± 5.6 ‰ and 4.0 ± 2.0 ‰, respectively) (Figure 2c). 355
The lake, fueled by the lower montane stream, presented the highest annual mean
356
Δ17
O-NO3- (5.1 ± 1.8 ‰) and δ18O-NO3- (8.6 ± 6.2 ‰), and the lowest δ15N-NO3- (-0.2 357
± 2.4 ‰) (Figure 2a, b and c). It must be stressed out again that the lake was only
358
sampled when unfrozen (i.e., late spring, summer and autumn), potentially biasing
359
NO3- mean isotopic values at this site. 360
361 362
3.4 Trends in isotope composition of NO3- across sites
Seasonal variations of stream NO3- isotopes and corresponding ƒatm are
364
shown in Figure 3. The three montane streams followed a similar pattern of seasonal
365
variations in 2015 and 2016. At the S-upper montane site, Δ17
O-NO3- and δ15N-NO3- 366
were significantly negatively correlated, with brief but high Δ17
O-NO3- peaks in spring, 367
followed by a slow but continuous increase peaking late summer/beginning of
368
autumn. At the N-upper site, a saw tooth pattern in summer and autumn occurred
369
right after a small but temporally wider increase at snowmelt, in early summer. Δ17
O-370
NO3- and δ15N-NO3- in the mid montane stream presented little variations throughout 371
the seasons, apart from a raise in δ15
N-NO3- in spring/summer 2016. Δ17O-NO3- and 372
δ15
N-NO3- were significantly negatively correlated in the lower montane stream and in 373
the lake, with significantly higher Δ17
O-NO3- from April to October – relative to the 374
rest of the year – in a very similar way to discharge (Figure S3). Finally, Δ17
O-NO3 -375
and δ15
N-NO3-were not correlated and did not vary much in urban streams, except for 376
some occasional high δ15
N peaks in spring and winter 2015 at the lower urban site.
377 378 4. Discussion 379 4.1 NO3-exports in streams 380
4.1.1 [NO3-] across the altitude gradient 381
There were little differences in streams [NO3-] along the elevation gradient 382
despite an expected higher contribution from anthropogenic activities to streams N
383
pool closer to urbanized areas (Groffman et al., 2004; Tsunogai et al., 2016). The
384
0.2-1.4 mg L-1 mean [NO3-] range at the montane sites is consistent with the 0.6-1.6 385
mg L-1 range in other Alpine valleys (reviewed in Balestrini et al., 2013), and the
0.9-386
1.5 mg L-1 range in elevated sites of the Colorado Front Range (Baron and Campbell,
387
1997; Campbell et al., 1995). The N-upper montane site had a much wider [NO3-] 388
range than the S-upper montane site, which is attributed to glacier melt influence
389
(Barnes et al., 2014; Williams et al., 2007). [NO3-] in urban streams was low when 390
compared to other concentrations measured in urban settings, such as the Tucson
391
basin where values up to 62 mg L-1 were determined (Dejwakh et al., 2012) or up to
392
26 mg L-1 in the Gwynns Falls watershed (Groffman et al., 2004).
393 394
4.1.2 NO3-atm contribution to total NO3 -395
Atmospheric deposition contributed significantly more to NO3- pool in streams 396
at the montane sites relative to the urban sites – exception being the mid montane
397
site (Figure 2). The Chambon lake showed the highest ƒatm, although it is possible
398
that sampling of this reservoir exclusively in summer resulted in a biased estimate of
399
mean annual NO3-atm. High NO3-atm inputs in montane streams (up to 47%) clearly
400
outline the influence of the melting snowpack releasing its load of atmospheric nitrate
401
(see section 4.2.1), as widely reported elsewhere (Kendall et al., 1995; Ohte et al.,
402
2004; Pellerin et al., 2012; Tsunogai et al., 2014, 2016). The mid montane stream
403
exported the lowest proportion of NO3-atm. Smoother topography gradient on this
404
watershed (slopes are 17%, Table 1) can account for this by impeding direct runoff to
405
stream during hydrological extremes (e.g., snowmelt), thus exerting a strong control
406
over NO3- isotopic values in the stream (Balestrini et al., 2013; Clow and Sueker, 407
2000). In addition, a smoother topography gradient also drives a higher NO3-atm
408
residence time in soils that would overwrite its Δ17O signature when recycled by
409
microorganisms. The low ƒatm in urban streams is dissimilar to others results that
410
have shown an increasing ƒatm in streams along an urbanization gradient (Riha et al.,
411
2014), or high NO3-atm inputs in urban runoff (Yang and Toor, 2016). In urban areas,
412
the combination of more impervious surface area coupled to higher atmospheric
deposition inputs is a strong driver that was expected to promote a higher proportion
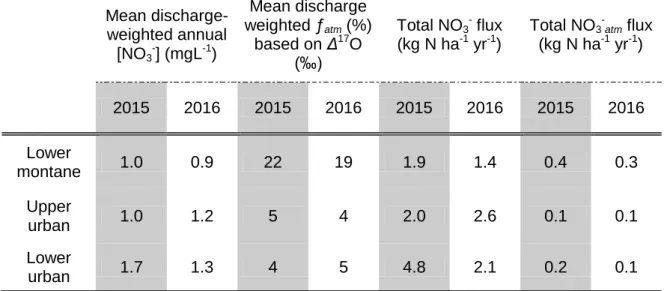
414
of NO3-atm in urban streams, relative to montane sites. Indeed, NO3- atmospheric 415
concentrations in Grenoble’s urban area are 10 to 100 times higher than atmospheric
416
concentrations observed at the Lautaret pass (Bourgeois, 2017; Tomaz et al., 2017),
417
which should have promoted higher NO3-atm loads in urban streams. However, higher
418
total NO3-atm loads are calculated at the lower montane site where NO3-atm
419
represented 21% of the total annual NO3- exports (Table 2). 420
Elevated N deposition in the Alps – also illustrated by higher [NO3-] in wet and 421
dry deposition compared to streams (Table S2) – is a well-documented phenomenon
422
(Kirchner et al., 2014; Rogora et al., 2006). Sustained nitrogen deposition in addition
423
to the steep slopes of the lower montane watershed (Table 1) can account for the
424
higher total NO3-atm flux at the montane site. Grenoble conurbation land cover is
425
mainly constituted of forest and lower vegetation (64%) followed by agricultural fields
426
(24%), and impervious surfaces (10%) are only a minor surface occupation
(UE-427
SOeS, CORINE Land Cover, 2006). NO3-atm inputs are thus likely to move to multiple
428
sinks, be biologically recycled or lost via different processes (e.g., denitrification,
429
photolysis (Clément et al., 2003; Ye et al., 2016)) before being collected by the urban
430
streams (Rao et al., 2014). Furthermore, a strong decoupling between atmospheric N
431
deposition and urban soils N cycling has recently been proposed, pointing at a
432
distinct urban biogeochemical N cycle – that entails that land-management practice,
433
not N deposition, is the ultimate driver of N cycling – and that would need further
434
investigation (Decina et al., 2017). Additionally, in France urban rainwater and
435
domestic wastewater are traditionally collected in the same pipe system before being
436
purified in a sewage treatment plant downstream of the cities. This would also limit
437
direct rainwater runoff to the streams, as illustrated by the statistically similar [NO3-] in 438
urban streams compared to montane streams (Figure 1). One, or a combination of
439
several of these factors would lower NO3-atm exports in urban streams, even lower
440
than montane streams NO3-atm exports in this case.Therefore, the low ƒatm in urban
441
streams certainly reflects the recycling and replacement of NO3-atm by terrestrial NO3 -442
sources along the smoother topography gradient, in a similar way to the
mid-443
montane stream.
444 445
4.2 Links between hydrology, topography and NO3-atm exports
446
4.2.1 Seasonal variations of NO3-atm proportion in streams
447
Seasonal variations of NO3-atm exports at the montane sites reflected the
448
influence of hydrologic and topographic features of the basins, and are thoroughly
449
discussed elsewhere (Bourgeois, 2017). The S-upper montane site exports are
450
governed by quick runoff to streams in the early stages of spring, followed by a
451
diffuse resurgence of infiltrated snowmelt water in summer and autumn. The period
452
between these two event lasts about 5 months both in 2015 and in 2016, an indicator
453
of either the water transit time in the calcareous substrate of the watershed or of the
454
aquifer refill time before flushing to the stream. The N-upper montane stream is
455
fueled by glacier melt, leading to higher [NO3-] than its southern counterpart by 1 456
order of magnitude (Figure 1). This is a consequence of the permafrost thawing at
457
that site (Bodin et al., 2009), thus increasing nitrification and/or mobilization of stored
458
N from disturbed soils (Barnes et al., 2014; Hood and Scott, 2008; Louiseize et al.,
459
2014). Occasional higher ƒatm at the N-upper site are triggered by rainstorm events
460
(Figure S3). The lower montane stream and the lake had very similar seasonal
461
variations of Δ17
O-NO3-, featuring the gradual melting of upstream snowpack 462
throughout the growing season (May to October). The mid montane and the urban
streams showed no marked seasonal variation, because of the buffering effect of
464
soils and the higher N cycling rates inherent to more intensive land management
465
treatments that prevented NO3-atm inputs to streams (Table 1).
466 467
4.2.2 Groundwater and surface runoff respective influence NO3-atm proportion in
468
streams
469
Significant correlations between rock-derived solutes (SO42- and Ca2+) in all 470
streams (Figure S4) indicate groundwater contribution to streams as a unifying
471
feature along the montane to urban gradient. Varying concentrations of rock-derived
472
solutes are in good agreement with the geologic characteristics of each watershed
473
(i.e., highest concentrations in the S-upper montane and the upper urban streams
474
draining calcareous basins, lowest concentrations in the N-upper montane stream
475
draining a less erodible bedrock, see Table 1 and Figure 1). In this study, year-round
476
detectable Δ17
O-NO3- translate the continuous NO3-atm exports in all streams (Figure
477
3), even during baseflow when streams are mostly fueled by groundwater. Most
478
studies focusing on NO3- dynamics in runoff reported NO3-atm only during stormflow or
479
snowmelt periods (Burns et al., 2009; Campbell et al., 2002; Pellerin et al., 2012).
480
However, these studies used the dual isotope approach (i.e., δ18O and δ15
N of NO3-), 481
which does not account accurately for NO3-atm in streams compared to the Δ17O
482
tracer (Michalski et al., 2004; Rose et al., 2015a). In a growing body of work using
483
Δ17
O-NO3- in streams, NO3-atm presence during baseflow is a unifying feature (Rose
484
et al., 2015a; Sabo et al., 2016; Tsunogai et al., 2016). In all these studies, ƒatm
485
ranged from 1-12% in baseflow, except for a coniferous watershed in West Virginia,
486
which led to ƒatm of 54% in stream, due to low sampling resolution (n=4). Here, ƒatm
487
ranged from 1-20% (with a median associated error of 3%, Figure S2) in all streams
during the dormant season (in grey, Figure 3), somewhat higher than the literature
489
data range – because of the extended influence of snowmelt in mountainous sites
490
during the growing season. The high Δ17
O-NO3- peaks at the S-upper montane site in 491
March 2015 are due to a shorter winter this year.
492
However, even if groundwater contributed at all sites to streams water, its
493
influence on streams ionic exports had most impact in the urban reaches. No or near
494
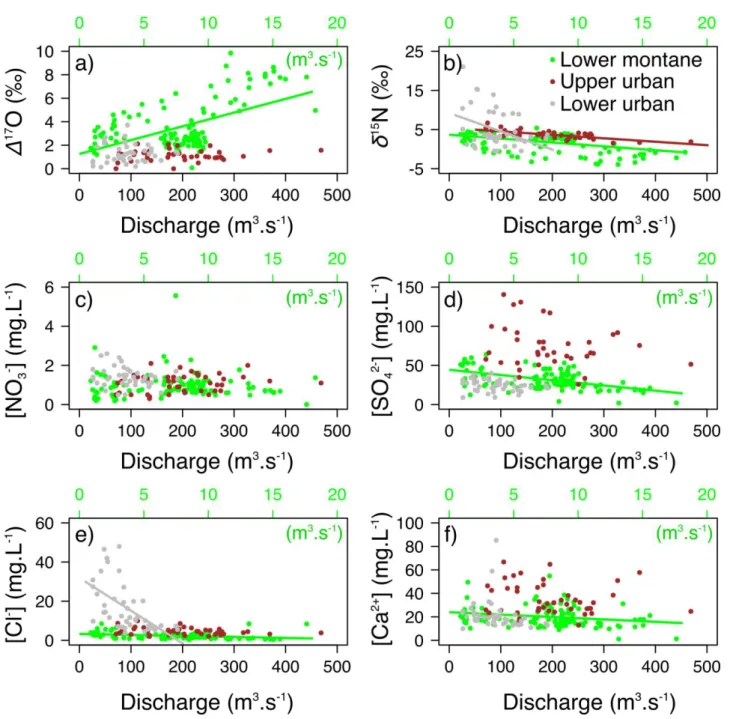
static correlations between either NO3- isotopes or conservative ions and discharge 495
(Figure 4) imply that a geochemically equilibrated groundwater reservoir dominates
496
stream exports at the urban sites, instead of surface runoff (Hall et al., 2016).
497
Oppositely, Δ17
O-NO3- increased significantly with discharge at the lower montane 498
site, highlighting the influence of snowmelt on NO3-atm exports (Figure 4a).
499
Decreasing weathering products concentrations with high flow also evidence the
500
decreasing contribution of groundwater towards more surficial water at snowmelt
501
(Figure 4d and f). No significant correlation of [NO3-] with discharge in any stream 502
implies a homogenized NO3- pool in groundwater reservoirs by infiltrated snowmelt 503
inputs. In line with this hypothesis, a dual isotope plot of water illustrates that
504
snowmelt more than rain fueled the streams, even down to the outskirts of Grenoble
505
(Figure S5). Other studies also reported similar findings of underground reservoirs
506
fed by snowmelt in mountains vicinity (Brooks et al., 1999; Hall et al., 2016; Williams
507
et al., 2009).
508 509
4.2.3 A focus on snowmelt period in montane streams
510
The intensive sampling campaign in spring 2016 at the S-upper montane and
511
the lower montane sites provided no evidence of diurnal pattern for any solutes in the
512
streams (data not shown). However, Δ17
O-NO3-did follow a diurnal pattern at the S-513
upper montane site, a pattern not seen in the lower montane stream (Figure S6a).
514
Conductivity (at both sites) and discharge (lower montane site only) showed very
515
pronounced diurnal variations, highlighting the hydrological influence of snowmelt
516
during the day (Figure S6b and c), also consistent with previous studies in the same
517
location (Mano et al., 2009). At the lower montane site, discharge and conductivity
518
were negatively correlated (Figure 5d), as their diurnal variations were driven by
519
distinct hydrological regime (i.e., baseflow for conductivity, snowmelt for discharge).
520
That conductivity is controlled by baseflow is also supported by significant positive
521
correlations between weathering solutes and conductivity at the S-upper montane
522
site (Figure 5c). Therefore, assuming a similar relationship between conductivity and
523
discharge is true at the S-upper montane stream, and considering that conductivity
524
and Δ17
O-NO3- were also negatively correlated (Figure 5a), snowmelt-induced 525
discharge in daytime is certainly the driver of the diurnal variations of NO3-atm exports.
526
Oppositely to another study showing in stream diurnal [NO3-] variations at snowmelt 527
in northern Vermont (Pellerin et al., 2012), no significant temporal trend in any of the
528
two streams was observed here. Yet, the lower montane stream was only on the
529
rising limb of discharge when sampled, at the very beginning of the snowmelt period.
530
Therefore, the absence of observed diurnal cycle at this site at this time may not be
531
representative of day-night variations later in the season.
532 533
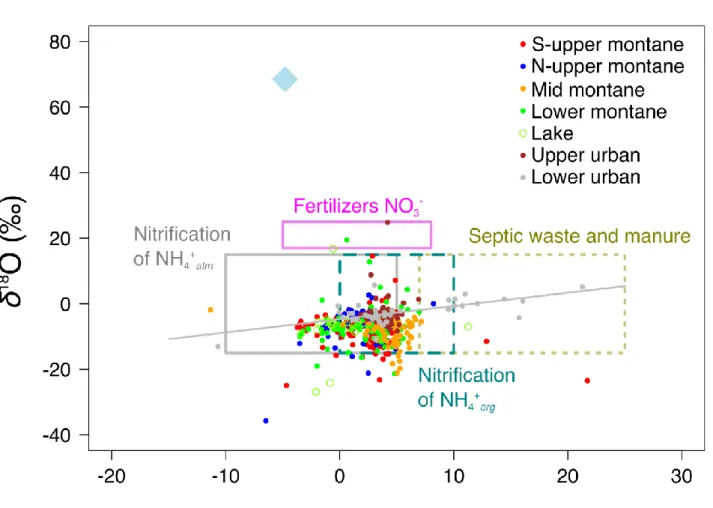
4.3 Isotopic composition of NO3-ter
534
4.3.1 NH4+ nitrification is the main source of NO3-ter in all streams
535
Isotopic values of NO3-ter (i.e., NO3- corrected from the atmospheric component 536
accordingly to Eq. 2 and 3) are reported in a dual isotope (δ18O and δ15
N) plot in
537
Figure 6. This allows the evaluation of the respective contribution of terrestrial
sources of NO3-ter to streams. Here, most δ15N-NO3-ter in streams span a 0 to 7‰
539
range, delineating nitrification of NH4+ as the main source of stream NO3-ter contents
540
(Figure 6). This is in line with watersheds land cover consisting principally in natural
541
or semi-natural vegetation (Table 1), where NO3- fertilizers are rarely used. Only very 542
few samples (n = 4) had both δ15
N-NO3-ter and δ18O-NO3-ter characteristic of NO3 -543
fertilizers. It is complicated to segregate the substrate of nitrification (i.e., deposited
544
atmospheric NH4+ (NH4+atm) or mineralized soil NH4+ (NH4+org)) that led to the
545
production of NO3-ter in streams. Indeed, nitrification of NH4+atm and NH4+org produces
546
NO3- with overlapping δ15N ranges (Kendall et al., 2007). However, a fraction of 547
samples, mostly from montane streams, had δ15
N-NO3-ter lower than 0‰, consistent
548
with nitrification of NH4+atm (Kendall et al., 2007; T. Liu et al., 2013).
549 550
4.3.2 Biological removal of NO3- was not predominant in any stream 551
Weak negative correlations between δ18
O-NO3- and δ15N-NO3- at all sites, 552
exception made of the lower urban site, indicate that biological processes such as
553
denitrification or assimilation do not control NO3- cycling in streams. Indeed, such 554
processes, if dominant, should enrich residual δ18
O-NO3- and δ15N-NO3- along a 555
positively correlated line (Granger et al., 2008, 2010; Kendall et al., 2007), in a similar
556
fashion to what is observed at the lower urban site. Yet, that δ15
N-NO3- was 557
significantly correlated to [Cl-] in this stream (data not shown) rather proves that the
558
high δ15
N-NO3- values are due to interception of sewage-originated wastewater (Hall 559
et al., 2016). Decreasing δ15
N-NO3- and [Cl-] with discharge (Figure 4b and e) at this 560
specific site also supports a groundwater origin of these nitrate pollution episodes.
561 562
4.3.3 Low δ18O-NO3-ter calls for a more systematic use of the Δ17O tracer
δ18
O-NO3-ter values as low as -20‰ were obtained after removing the
564
atmospheric imprint (Figure 6 and Figure S7). The mean δ18
O-NO3-ter ranged
565
between -6.3 and -8.0‰ in the mountainous streams, significantly lower than
566
previously reported values of terrestrial δ18
O-NO3- in freshwater systems (from -2.9 to 567
-4.2‰ in Tsunogai et al. (2016, 2014, 2010)) or produced through in vitro incubation
568
experiments (> 0‰ in Burns and Kendall (2002), Mayer et al. (2001) and Spoelstra et
569
al. (2007)).The mean δ18
O-NO3-ter range between -2.6 and -2.8‰ in the urban
570
streams, far lower than values > 9‰ inferred in other urban areas (Riha et al., 2014)
571
or mostly positive values in a semiarid urban setting (Dejwakh et al., 2012).
572
The theoretical range for δ18
O-NO3-nit (i.e., theoretical δ18O-NO3- after 573
nitrification) is -15 to 15‰, assuming soil-water and O2 respectively contribute to NO3 -574
-O accordingly to δ18
O-NO3- = 1/3 (δ18O-O2) + 2/3 (δ18O-H2O) (Kendall et al., 2007). 575
Here, a subset of 5 snow-water samples and 2 rain samples were analyzed for δ18
O,
576
with respective mean values of -16.6 and -8.2‰. Soil-water isotopes were not directly
577
measured, but assimilated to precipitation water isotopes. Assuming δ18
O values of
578
air-O2 of 23.88‰ (Barkan and Luz, 2005), we ended up with δ18O-NO3- = -3.3‰ (if 579
the end-member is snow water) and +2.3‰ (if the end-member is rain water) for NO3 -580
nit. Even though this approach comes with a number of assumptions and caveats
581
(Rose et al., 2015b; Snider et al., 2010), the calculated values are significantly higher
582
– by ca 4‰ – than the mean annual δ18
O-NO3-ter (Table 3). In a study focusing on an
583
estuarine system in San Francisco Bay, it was postulated that rapid recycling of NO3 -584
under low [NO3-] conditions (<0.9 mg L-1) could result in an increased incorporation of 585
H2O-O atoms into the NO3- molecule (Wankel et al., 2006). Another work focusing on 586
nitrification in forests soils of central Japan attributed low δ18
O-NO3- to a combination 587
of O atoms exchange between H2O and NO2- and kinetic isotope fractionation 588
associated with oxygen incorporation throughout the nitrification process in acidic
589
soils (Fang et al., 2012). The latter hypothesis could explain the generally acidic
590
subalpine soils characterized by slow N cycling (Robson et al., 2007), but further
591
investigation is warranted to understand the cause of 18O depleted NO3-. 592
When calculating ƒatm using the approach described by Barnes et al. (2008):
593 594
(Eq.7) ƒatm = (δ18Osample - δ18Onit) / (δ18Oatm - δ18Onit)
595 596
and by using either δ18
O-NO3-ter or δ18O-NO3-nit as nitrification end-member,
597
significant differences between the estimated ƒatm are obtained (Table 3). These
598
findings suggest that atmospheric NO3- inputs to an ecosystem are underestimated 599
(e.g., up to 6% in this study, Table 3) when calculated using Eq.7 with δ18
O-NO3-nit as 600 nitrification end-member. 601 602 5. Conclusions 603
The results showing higher NO3-atm exports in a montane stream relative to
604
urban streams have several key implications. First, it sheds light on the contribution
605
of snowmelt-derived groundwater to year-round NO3-atm exports in all streams at
606
baseflow. Contamination of groundwater by NO3-atm may be a widespread
607
phenomenon, regardless of emitting sources proximity: other studies also reported
608
ubiquitous presence of NO3-atm in groundwater (Dejwakh et al., 2012; Dietzel et al.,
609
2014; Nakagawa et al., 2013; Stoewer et al., 2015). Second, hydrological events
610
(e.g., snowmelt) are the main controls of upland NO3-atm exports, whereas a
611
chemically equilibrated groundwater reservoir dominates discharge in urban streams.
612
In a context of climate change, with temporally shorter and shallower snow coverage
of altitude catchments, decreasing exports of NO3-atm by snowmelt water could result
614
in proportional NO3-atm enrichment of alpine soils. However, how this would correlate
615
with elsewhere reported snow cover removal effects on microbial communities, N
616
retention, plants biomass and soil respiration is a complex question yet to be
617
addressed (Brooks et al., 2011; Gavazov et al., 2017; Sorensen et al., 2016;
618
Vankoughnett and Henry, 2013). Third, the association of Δ17O, δ15N and δ18O is a
619
potent tool to unravel the respective atmospheric and terrestrial sources contribution
620
to NO3- pools. To correct the δ18O-NO3- from its atmospheric composition enables the 621
determination of the δ18
O-NO3-ter, which came significantly lower at all sites than the
622
theoretically calculated δ18
O-NO3-nit. This resulted in significantly higher estimated
623
ƒatm when using a more robust δ18O-NO3-ter (compared to δ18O-NO3-nit) as nitrification
624
end-member in Eq.7. Studies that did not use δ18
O-NO3-ter in Eq.7 to determine ƒatm
625
may have underestimated atmospheric nitrate inputs to the environment (e.g.,
626
Barnes et al. (2008), Durka et al. (1994), Griffiths et al. (2016), Pellerin et al. (2012),
627
Sebestyen et al. (2014)). It is recommended that more work be conducted using the
628
triple isotope technique to revise the assessment of NO3-atmubiquity in the
629 environment. 630 631 Ackowledgments 632
This study was supported by grants from the Labex OSUG@2020 (“Investissements
633
d’avenir” - ANR10 LABX56), the ARC – Environnement Région Rhone-Alpes, the
634
Grenoble-Chambéry DIPEE CNRS. This work also benefited from the National
635
Research Agency supports (“Investissements d’avenir” ANR11 INBS0001AnaEE
-636
Services and “FloodScale project” - ANR 2011 BS56 027) and from the SAJF
637
research station (UMR 3370, UGA-CNRS) infrastructures and competences. The
study took place on a Long Term Ecological Research site of the ZAA (Zone Atelier
639
Alpes) and the Isère Campus monitoring site is a CNRS-labeled site of the ZABR
640
(Rhone Basin Long Term Ecological Research site). We would like to thank G. Nord,
641
J.-L. Jaffrezo, F. Masson, V. Lucaire, E. Vince and C. Arnoldi for help with either
642
laboratory or field work. We also want to acknowledge J. Renaud for help with SIG.
643 644
Appendix A 645
The supplementary information provides additional Text on the analytical methods,
646
Figures S1-S7 and Tables S1-S2.
647 648
References 649
Aber, J.D., Nadelhoffer, K.J., Steudler, P., Melillo, J.M., 1989. Nitrogen Saturation in 650
Northern Forest Ecosystems. BioScience 39, 378–386. 651
https://doi.org/10.2307/1311067 652
Balestrini, R., Arese, C., Freppaz, M., Buffagni, A., 2013. Catchment features controlling 653
nitrogen dynamics in running waters above the tree line (central Italian Alps). Hydrol. 654
Earth Syst. Sci. 17, 989–1001. https://doi.org/10.5194/hess-17-989-2013 655
Barkan, E., Luz, B., 2005. High precision measurements of 17O/16O and 18O/16O ratios 656
in H2O. Rapid Commun. Mass Spectrom. 19, 3737–3742. 657
https://doi.org/10.1002/rcm.2250 658
Barnes, R.T., Raymond, P.A., 2010. Land-use controls on sources and processing of 659
nitrate in small watersheds: insights from dual isotopic analysis. Ecol. Appl. 20, 1961– 660
1978. https://doi.org/10.1890/08-1328.1 661
Barnes, R.T., Raymond, P.A., Casciotti, K.L., 2008. Dual isotope analyses indicate efficient 662
processing of atmospheric nitrate by forested watersheds in the northeastern US. 663
Biogeochemistry 90, 15–27. 664
Barnes, R.T., Williams, M.W., Parman, J.N., Hill, K., Caine, N., 2014. Thawing glacial and 665
permafrost features contribute to nitrogen export from Green Lakes Valley, Colorado 666
Front Range, USA. Biogeochemistry 117, 413–430. https://doi.org/10.1007/s10533-667
013-9886-5 668
Baron, J.S., Campbell, D.H., 1997. Nitrogen fluxes in a high elevation Colorado Rocky 669
Mountain basin. Hydrol. Process. 11, 783–799. 670
Baron, J.S., Driscoll, C.T., Stoddard, J.L., Richer, E.E., 2011. Empirical Critical Loads of 671
Atmospheric Nitrogen Deposition for Nutrient Enrichment and Acidification of Sensitive 672
US Lakes. BioScience 61, 602–613. https://doi.org/10.1525/bio.2011.61.8.6 673
Baron, J.S., Nydick, K.R., Rueth, H.M., Lafrançois, B.M., Wolfe, A.P., 2005. High Elevation 674
Ecosystem Responses to Atmospheric Deposition of Nitrogen in the Colorado Rocky 675
Mountains, USA, in: Huber, U.M., Bugmann, H.K.M., Reasoner, M.A. (Eds.), Global Change 676
and Mountain Regions. Springer Netherlands, Dordrecht, pp. 429–436. 677
Baron, J.S., Rueth, H.M., Wolfe, A.M., Nydick, K.R., Allstott, E.J., Minear, J.T., Moraska, B., 678
2000. Ecosystem Responses to Nitrogen Deposition in the Colorado Front Range. 679
Ecosystems 3, 352–368. https://doi.org/10.1007/s100210000032 680
Beirle, S., Boersma, K.F., Platt, U., Lawrence, M.G., Wagner, T., 2011. Megacity Emissions 681
and Lifetimes of Nitrogen Oxides Probed from Space. Science 333, 1737–1739. 682
https://doi.org/10.1126/science.1207824 683
Bettez, N.D., Groffman, P.M., 2013. Nitrogen Deposition in and near an Urban Ecosystem. 684
Environ. Sci. Technol. 47, 6047–6051. https://doi.org/10.1021/es400664b 685
Beyn, F., Matthias, V., Dähnke, K., 2014. Changes in atmospheric nitrate deposition in 686
Germany – An isotopic perspective. Environ. Pollut. 194, 1–10. 687
https://doi.org/10.1016/j.envpol.2014.06.043 688
Bodin, X., Thibert, E., Fabre, D., Ribolini, A., Schoeneich, P., Francou, B., Reynaud, L., Fort, 689
M., 2009. Two decades of responses (1986–2006) to climate by the Laurichard rock 690
glacier, French Alps. Permafr. Periglac. Process. 20, 331–344. 691
https://doi.org/10.1002/ppp.665 692
Bourgeois, I., 2017. Atmospheric nitrate deposition on subalpine meadows of the 693
Lautaret pass (phdthesis). Université Grenoble Alpes. 694
Bourgeois, I., Savarino, J., Caillon, N., Angot, H., Barbero, A., Delbart, F., Voisin, D., 695
Clement, J.-C., n.d. Tracing the fate of atmospheric nitrate in a subalpine watershed using 696
Δ17O. Environ. Sci. Technol. in review. 697
Bowman, W.D., Gartner, J.R., Holland, K., Wiedermann, M., 2006. Nitrogen Critical Loads 698
For Alpine Vegetation And Terrestrial Ecosystem Response: Are We There Yet? Ecol. 699
Appl. 16, 1183–1193. https://doi.org/10.1890/1051-700
0761(2006)016[1183:NCLFAV]2.0.CO;2 701
Briand, C., 2014. Approche multi-traceurs pour la détermination de l’origine des nitrates 702
dans les eaux souterraines: exemple d’une source karstique dans les Landes. Université 703
Pierre et Marie Curie-Paris VI. 704
Brooks, P.D., Campbell, D.H., Tonnessen, K.A., Heuer, K., 1999. Natural variability in N 705
export from headwater catchments: snow cover controls on ecosystem N retention. 706
Hydrol. Process. 13, 2191–2201. 707
Brooks, P.D., Grogan, P., Templer, P.H., Groffman, P., Öquist, M.G., Schimel, J., 2011. 708
Carbon and Nitrogen Cycling in Snow-Covered Environments. Geogr. Compass 5, 682– 709
699. https://doi.org/10.1111/j.1749-8198.2011.00420.x 710
Burns, D.A., Boyer, E.W., Elliott, E.M., Kendall, C., 2009. Sources and Transformations of 711
Nitrate from Streams Draining Varying Land Uses: Evidence from Dual Isotope Analysis. 712
J. Environ. Qual. 38, 1149. https://doi.org/10.2134/jeq2008.0371 713
Burns, D.A., Kendall, C., 2002. Analysis of δ15N and δ18O to differentiate NO3− sources 714
in runoff at two watersheds in the Catskill Mountains of New York. Water Resour. Res. 715
38, 9–1. https://doi.org/10.1029/2001WR000292 716
Campbell, D.H., Clow, D.W., Ingersoll, G.P., Mast, M.A., Spahr, N.E., Turk, J.T., 1995. 717
Nitrogen deposition and release in alpine watersheds, Loch Vale, Colorado, USA. IAHS 718
Publ.-Ser. Proc. Rep.-Intern Assoc Hydrol. Sci. 228, 243–254. 719
Campbell, D.H., Kendall, C., Chang, C.C.Y., Silva, S.R., Tonnessen, K.A., 2002. Pathways for 720
nitrate release from an alpine watershed: Determination using δ 15 N and δ 18 O: ALPINE
721
WATERSHED NITRATE δ 15 N AND δ 18 O. Water Resour. Res. 38, 10-1-10–9.
722
https://doi.org/10.1029/2001WR000294 723
Clark, C.M., Bell, M.D., Boyd, J.W., Compton, J.E., Davidson, E.A., Davis, C., Fenn, M.E., 724
Geiser, L., Jones, L., Blett, T.F., 2017. Nitrogen-induced terrestrial eutrophication: 725
cascading effects and impacts on ecosystem services. Ecosphere 8, e01877. 726
https://doi.org/10.1002/ecs2.1877 727
Clément, J.-C., Holmes, R.M., Peterson, B.J., Pinay, G., 2003. Isotopic investigation of 728
denitrification in a riparian ecosystem in western France. J. Appl. Ecol. 40, 1035–1048. 729
https://doi.org/10.1111/j.1365-2664.2003.00854.x 730
Clow, D.W., Sueker, J.K., 2000. Relations between basin characteristics and stream water 731
chemistry in alpine/subalpine basins in Rocky Mountain National Park, Colorado. Water 732
Resour. Res. 36, 49–61. https://doi.org/10.1029/1999WR900294 733
Costa, A.W., Michalski, G., Schauer, A.J., Alexander, B., Steig, E.J., Shepson, P.B., 2011. 734
Analysis of atmospheric inputs of nitrate to a temperate forest ecosystem from Δ 17 O
735
isotope ratio measurements: ATMOSPHERIC NITRATE INPUTS TO A FOREST. Geophys. 736
Res. Lett. 38, n/a-n/a. https://doi.org/10.1029/2011GL047539 737
Cowie, R.M., Knowles, J.F., Dailey, K.R., Williams, M.W., Mills, T.J., Molotch, N.P., 2017. 738
Sources of streamflow along a headwater catchment elevational gradient. J. Hydrol. 549, 739
163–178. https://doi.org/10.1016/j.jhydrol.2017.03.044 740
Decina, S.M., Templer, P.H., Hutyra, L.R., Gately, C.K., Rao, P., 2017. Variability, drivers, 741
and effects of atmospheric nitrogen inputs across an urban area: Emerging patterns 742
among human activities, the atmosphere, and soils. Sci. Total Environ. 609, 1524–1534. 743
https://doi.org/10.1016/j.scitotenv.2017.07.166 744
Dejwakh, N.R., Meixner, T., Michalski, G., McIntosh, J., 2012. Using 17 O to Investigate
745
Nitrate Sources and Sinks in a Semi-Arid Groundwater System. Environ. Sci. Technol. 46, 746
745–751. https://doi.org/10.1021/es203450z 747
Devito, K.J., Fitzgerald, D., Hill, A.R., Aravena, R., 2000. Nitrate dynamics in relation to 748
lithology and hydrologic flow path in a river riparian zone. J. Environ. Qual. 29, 1075– 749
1084. 750
Dietzel, M., Leis, A., Abdalla, R., Savarino, J., Morin, S., Böttcher, M.E., Köhler, S., 2014. 751
<sup>17</sup>O excess traces atmospheric nitrate in paleo-groundwater of 752
the Saharan desert. Biogeosciences 11, 3149–3161. https://doi.org/10.5194/bg-11-753
3149-2014 754
Dodds, W.K., Bouska, W.W., Eitzmann, J.L., Pilger, T.J., Pitts, K.L., Riley, A.J., Schloesser, 755
J.T., Thornbrugh, D.J., 2009. Eutrophication of U.S. Freshwaters: Analysis of Potential 756
Economic Damages. Environ. Sci. Technol. 43, 12–19. 757
https://doi.org/10.1021/es801217q 758
Durka, W., Schulze, E.-D., Gebauer, G., Voerkeliust, S., 1994. Effects of forest decline on 759
uptake and leaching of deposited nitrate determined from 15N and 18O measurements. 760
Nature 372, 765–767. https://doi.org/10.1038/372765a0 761
Dutordoir, S., 2014. Bilan des flux de métaux, carbone organique et nutriments contenus 762
dans une rivière alpine: part des rejets urbains de l’agglomération de Grenoble et 763
apports amont (Isère et Drac). Université Grenoble Alpes. 764
Elliott, E.M., Kendall, C., Boyer, E.W., Burns, D.A., Lear, G.G., Golden, H.E., Harlin, K., 765
Bytnerowicz, A., Butler, T.J., Glatz, R., 2009. Dual nitrate isotopes in dry deposition: 766
Utility for partitioning NO x source contributions to landscape nitrogen deposition. J.
767
Geophys. Res. 114. https://doi.org/10.1029/2008JG000889 768
Elser, J.J., Andersen, T., Baron, J.S., Bergström, A.-K., Jansson, M., Kyle, M., Nydick, K.R., 769
Steger, L., Hessen, D.O., 2009. Shifts in lake N:P stoichiometry and nutrient limitation 770
driven by atmospheric nitrogen deposition. Science 326, 835–837. 771
https://doi.org/10.1126/science.1176199 772
Emmerton, K.S., Callaghan, T.V., Jones, H.E., Leake, J.R., Michelsen, A., Read, D.J., 2001. 773
Assimilation and Isotopic Fractionation of Nitrogen by Mycorrhizal and Nonmycorrhizal 774
Subarctic Plants. New Phytol. 151, 513–524. https://doi.org/10.2307/1353802 775