HAL Id: hal-02557501
https://hal.sorbonne-universite.fr/hal-02557501
Submitted on 28 Apr 2020
HAL is a multi-disciplinary open access
archive for the deposit and dissemination of
sci-entific research documents, whether they are
pub-lished or not. The documents may come from
teaching and research institutions in France or
abroad, or from public or private research centers.
L’archive ouverte pluridisciplinaire HAL, est
destinée au dépôt et à la diffusion de documents
scientifiques de niveau recherche, publiés ou non,
émanant des établissements d’enseignement et de
recherche français ou étrangers, des laboratoires
publics ou privés.
genomic lens
Sheree Yau, Marc Krasovec, L. Felipe Benites, Stéphane Rombauts, Mathieu
Groussin, Emmelien Vancaester, Jean-Marc Aury, Evelyne Derelle, Yves
Desdevises, Marie-Line Escande, et al.
To cite this version:
Sheree Yau, Marc Krasovec, L. Felipe Benites, Stéphane Rombauts, Mathieu Groussin, et al..
Virus-host coexistence in phytoplankton through the genomic lens. Science Advances , American Association
for the Advancement of Science (AAAS), 2020, 6 (14), pp.eaay2587. �10.1126/sciadv.aay2587�.
�hal-02557501�
O C E A N O G R A P H Y
Virus-host coexistence in phytoplankton through
the genomic lens
Sheree Yau1,2*, Marc Krasovec1, L. Felipe Benites1, Stephane Rombauts3,4, Mathieu Groussin5,
Emmelien Vancaester3,4, Jean-Marc Aury6, Evelyne Derelle1,7, Yves Desdevises1,
Marie-Line Escande1, Nigel Grimsley1, Julie Guy6, Hervé Moreau1, Sophie Sanchez-Brosseau1,
Yves van de Peer3,4,8, Klaas Vandepoele3,4, Sebastien Gourbiere9, Gwenael Piganeau1*
Virus-microbe interactions in the ocean are commonly described by “boom and bust” dynamics, whereby a numerically dominant microorganism is lysed and replaced by a virus-resistant one. Here, we isolated a microalga strain and its infective dsDNA virus whose dynamics are characterized instead by parallel growth of both the microalga and the virus. Experimental evolution of clonal lines revealed that this viral production originates from the lysis of a minority of virus-susceptible cells, which are regenerated from resistant cells. Whole-genome sequencing demon-strated that this resistant-susceptible switch involved a large deletion on one chromosome. Mathematical modeling explained how the switch maintains stable microalga-virus population dynamics consistent with their observed growth pattern. Comparative genomics confirmed an ancient origin of this “accordion” chromosome despite a lack of sequence conservation. Together, our results show how dynamic genomic rearrangements may account for a previously overlooked coexistence mechanism in microalgae-virus interactions.
INTRODUCTION
Phytoplankton-virus interactions are major determinants of geo-chemical cycles in the oceans. Viruses are responsible for the redirec-tion of carbon and nutrients away from macroorganisms back toward microorganisms via the lysis of their hosts in a process coined the “viral shunt.” Resolving the mechanisms underlying these interactions and their impact on phytoplankton dynamics represents one of the major challenges for future projections of ocean ecosystems under climate change (1, 2). Nucleocytoplasmic large DNA viruses (NCLDV) are estimated to be present at 104·ml−1 in the photosynthetic zone
(3), a large proportion of which are prasinoviruses, a monophyletic group known to infect Mamiellophyceae, a class of cosmopolitan marine picophytoplankton (4), which can be dominant primary pro-ducers in coastal areas (5).
Unlike bacteriophages that may integrate into their hosts as prophages and develop complex lysogeny-lysis switch strategies (6), by which the prophage is excised from the host genome and whose transcription induces cell lysis, all known NCLDV-infecting unicellular organisms replicate by cell lysis (7). Nonetheless, acquisition of viral resistance after initial viral lysis has been reported in several phylo-genetically diverse microalga-NCLDV populations, which displayed
continuous production of infective viruses (8). Here, we define as “coexistence” of microalgae and viruses the situation where infec-tive viruses are produced by healthy microalgal cultures grown from one single cell and are thus isogenic except for the presence of spon-taneous mutations. The process allowing a sustained virus produc-tion in these isogenic microalgal cultures has remained unsolved.
Virus and microalga coexistence has been previously reported in the freshwater green alga Chlorella variabilis N64A infected by
Paramecium bursaria chlorovirus (PBCV-1), and this phenotype was
coined a “carrier” state (9). Coexistence was also observed in the haptophyte Emiliania huxleyi upon infection by EhV-99B1 over 12 days (8) and subsequently in the marine Mamiellophyceae picoalga
Ostreococcus tauri upon infection by Ostreococcus tauri virus 5 (OtV5)
over 18 days (10). More recently, a study of the population dynamics of C. variabilis and PBCV-1 reported that stable coexistence evolved 30 days after infection, which was maintained until the end of the experiment 45 days later (11).
Ostreococcus and their prasinoviruses represent ecologically relevant
cultivable microalga-NCLDV model systems for focused study of host- virus interaction mechanisms and dynamics (12). Ostreococcus
mediterraneus is the most recently described species, and gene phylogeny
of the 18S ribosomal RNA (rRNA) indicated that it is the earliest branch-ing member of the Ostreococcus genus (13). The analysis of the complete genome sequence of O. mediterraneus (strain RCC2590) unexpectedly revealed the sequence of a previously unidentified prasinovirus, hereafter named OmV2 for Ostreococcus mediterraneus virus 2. Because the DNA extraction was performed shortly after the environmental sampling of the strain and because subsequent inspections of the culture revealed the presence of infective OmV2 particles for over a decade, we concluded that this microalga-NCLDV system was isolated as a coexisting system, rather than upon the selection of resistant (R) cells after an initial lytic event. We investigate the evolutionary history of this system by whole-genome analysis and the mechanisms underlying viral pro-duction by experimental evolution. Last, mathematical modeling of host-virus coexistence as a resistant-susceptible phase switch in the host allows us to explain the observed microalga-virus dynamics. 1Sorbonne Université, CNRS, UMR 7232 Biologie Intégrative des Organismes Marins
(BIOM), Observatoire Océanologique, F-66650 Banyuls-sur-Mer, France. 2Department
of Marine Biology and Oceanography, Institute of Marine Sciences (ICM), CSIC, Barcelona, Spain. 3Ghent University, Department of Plant Biotechnology and
Bio-informatics, Technologiepark-Zwijnaarde 71, 9052 Ghent, Belgium. 4VIB Center for
Plant Systems Biology, Technologiepark-Zwijnaarde 71, 9052 Ghent, Belgium. 5
Depart-ment of Biological Engineering, Massachusetts Institute of Technology, 500 Technology Square NE47-378, Cambridge, MA 02139, USA. 6Genoscope, Institut de biologie
François Jacob, Commissariat à l’Energie Atomique (CEA), Université Paris-Saclay, Evry, France. 7Univ. Brest, CNRS, IRD, Ifremer, LEMAR, F-29280 Plouzane, France. 8Department of Biochemistry, Genetics and Microbiology, University of Pretoria,
Pretoria 0028, South Africa. 9Laboratoire Génome et Développement des Plantes,
Université de Perpignan Via Domitia, UMR 5096, 52 Avenue Paul Alduy, 66860 Perpignan, France.
*Corresponding author. Email: [email protected] (G.P.); syau@ icm.csic.es (S.Y.)
Copyright © 2020 The Authors, some rights reserved; exclusive licensee American Association for the Advancement of Science. No claim to original U.S. Government Works. Distributed under a Creative Commons Attribution NonCommercial License 4.0 (CC BY-NC). on April 28, 2020 http://advances.sciencemag.org/ Downloaded from
RESULTS
Production of virions is the consequence of lysis of a subpopulation of microalgae
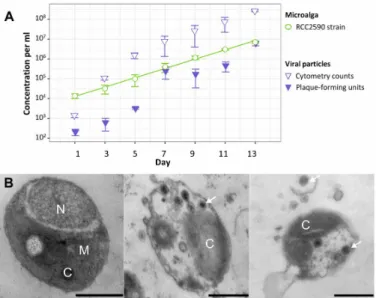
Population dynamics of microalgal cells and OmV2 in culture was followed over 2 weeks. The logarithm of microalgal concentration,
C, increases linearly with time, t, in RCC2590 cultures (Fig. 1A;
ln(C) = 0.557 × t + 7.559, R2 = 0.94). Virus concentration was
esti-mated by flow cytometry and by plaque assay, which measure the total number of DNA-containing particles in the culture medium and the number of infectious viruses, respectively. Despite variation in the estimation of the number of viruses between replicates and between the two methods, the number of viruses increases with the number of microalgae, providing evidence of continuous production of viruses in culture.
We performed transmission electron microscopy (TEM) on theses cultures to examine how the virus was being produced. The majority of cells had typical morphology (Fig. 1B) described for Ostreococcus, while 0.9% of cells (5 of 573 individuals) contained icosahedral particles of approximately 110 nm in diameter within the cytoplasm (Fig. 1, C and D). Viral particles could also be visualized in the medium (Fig. 1D), often as aggregates around cellular debris. The capsid size and icosahedral morphology, as well as virion development within the cytoplasm, are consistent with the lytic replication cycle observed in other isolated prasinoviruses (14). This led us to conclude that viruses are produced from the lysis of a subset of virus-susceptible cells in the majority of virus-resistant RCC2590 culture. We did not observe nonlytic virus production from budding or extrusion through the cell membrane. Since the cultures are isogenic, having been iso-lated from one single cell, this raised the question of how susceptible (S) cells originate from a majority of R cells.
Susceptible (S) cells derive from resistant (R) cells and vice versa
To validate the existence of a switch by which S phenotypes could be generated by R cells within isogenic cultures, we performed ex-perimental evolution. First, we established a clonal culture line that was free of viruses by diluting the original OmV2-producing RCC2590 culture to a single cell. This parent line (hereafter referred to as ML for “mother line”) was confirmed to be virus-free by polymerase chain reaction (PCR) screening for OmV2. The ML was not lysed after readdition of purified OmV2, showing that the ML remained R. Furthermore, this demonstrated that uninfected individual cells were in the original RCC2590 culture that could be physically separated from OmV2. Second, the virus-free ML was used to generate hundreds of clonal cultures, again from a single cell, in four inde-pendent tests. As the phenotype at the level of a single cell cannot yet be determined, we screened these newly cloned cultures for sus-ceptibility to OmV2 after 7 days of growth; thus, the phenotype of the majority of the cells in culture would reflect the phenotype of the starting cell. In the first test, the ML was repeatedly cloned via single-cell bottlenecks every 2 weeks for 1 year in multiple lines as part of a mutation accumulation experiment in which 3 of 24 independent lines were visibly lysed upon addition of OmV2 (15). To determine whether S phenotypes could evolve over short time periods, three independent experiments were performed, where the ML was sub-cloned once by end-point dilution to generate a total of 204 clonal cultures and tested for susceptibility to OmV2. Visual inspection revealed no lysis in 159 clones, while 45 clones lysed with the addition of OmV2. This demonstrated that cultures containing a majority of S cells evolved from a single R cell at a 12.5 to 22% frequency.
To test whether cultures containing a majority of S cells similarly could regenerate an R phenotype, the three independent S lines from the first mutation accumulation experimental evolution study were exposed to OmV2. Infected S cultures showed a sharp decrease in cell concentration in the first 15 days, consistent with a lytic event, dropping as low as 167 cells ml−1, after which cultures recovered and cell concentrations reached that of uninfected controls (fig. S1). These cultures subsequently showed no visible lysis when rechallenged with OmV2, demonstrating that S cultures can reliably switch to an R state. Exposure to OmV2 was performed independently a second time on 24 S lines and confirmed systematic resistance acquisition. What is the genomic signature of the R-to-S switch?
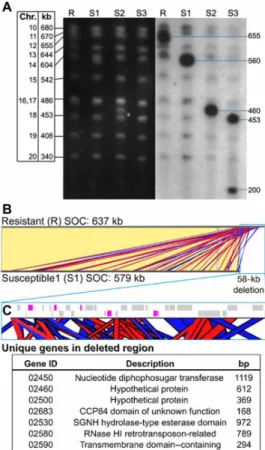
The three S lines—S1, S2, and S3—obtained from the mutation ac-cumulation experimental evolution study were maintained in batch culture and intermittently tested for susceptibility to OmV2. Viral lysis was observed at each test, confirming that these cultures retained a majority of S cells. Pulsed-field gel electrophoresis (PFGE) karyotype analysis of the ML and three S lines revealed a visible size reduction of 95 to 435 kb in one chromosome, while no difference in karyotype could be observed in the OmV2-R ML, which remained unchanged from the OmV2-producing original RCC2590 (Fig. 2). Hybridization using specific probes designed from the complete genome sequence identified the chromosome with a reduced size to be the “small outlier chromosome” (SOC) of O. mediterraneus. The term SOC was coined to describe a chromosome found in all Mamiellales genomes sequenced so far—including Ostreococcus (16), Micromonas (17), and Bathycoccus (18)—because of its modest size (<300 kb), as well as its lower guanine-cytosine (GC) content, gene density, and expression rate as compared to the other chromosomes.
Fig. 1. Population dynamics of the algae and virus. (A) Population dynamics of microalga (circles) and prasinovirus (triangles) concentrations over 14 days in the O. mediterraneus RCC2590 culture. The line is fitted via ordinary least square regression. (B) Transmission electron micrographs of O. mediterraneus RCC2590 cells from an actively growing culture. The majority of cells have typical morphology (left), while 0.9% of cells contained visible viral particles (middle and right) and free viral particles were observed in the medium aggregated around infected cells (right). Scale bars, 500 nm; C, chloroplast; M, mitochondrion; N, nucleus. White arrows indicate examples of virus particles.
on April 28, 2020
http://advances.sciencemag.org/
To determine whether a change in SOC size was exclusive to an R-to-S switch, we karyotyped a selection of 10 lines from the mutation accumulation experiment that remained R after passage through single-cell bottlenecks. R lines showed variation of ±5 kb in the size of the SOC compared to the ML (fig. S2). To determine whether S-to-R changes were also associated to a SOC size switch, three S lines that had regenerated the R phenotype after reintroduction to OmV2 (S to R) were karyotyped, and no visible karyotype change could be observed (fig. S2). Together, this supports there being minor size variation in the SOC in R lines, a large reduction in SOC size linked only to the R-to-S switch, and no systematic visible SOC change linked to an S-to-R switch.
One S line, S1, was selected for long-read genome resequencing to elucidate the changes involved in the R-to-S switch. This line was chosen, as it had the smallest deletion in the SOC and could show the smallest change linked to a switch in phenotype. Resequencing showed that 58 kb was deleted from one of the ex-tremities of this chromosome (Fig. 2). The SOC comprised a mosaic of short repeated sequences, mainly of intrachromosomal origin,
with some contributions from other chromosomes. As a consequence, the deleted fragment was a pastiche of redundant SOC sequences, with only seven genes deleted that were not found elsewhere on the SOC corresponding to 4323 base pairs (bp) of coding sequence (Fig. 2). Three of the unique deleted genes encoded proteins with unknown functions. Those with putative functional matches included a nu-cleotide diphosphosugar transferase, an esterase domain–containing family, transmembrane domain–containing protein, and a ribo-nuclease H1 related to retrotransposases.
Mathematical modeling of S-R switch
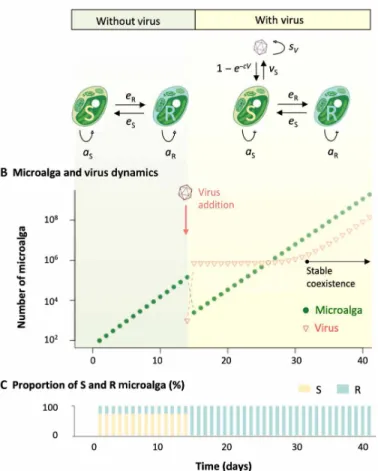
To investigate the consequences of such a phase switch on the micro-alga and virus population dynamics, we set up a host-virus interac-tion model of this system (Fig. 3A). S hosts are infected by viral particles present in the environment, which ultimately leads to the lysis of the infected cell and the release of vS new viral particles that survive in the environment at a rate sV. While reproducing asexually at rates as and aR, S algae produce a fraction eR of R cells, while R algae generate a fraction eS of S cells.
In the absence of viruses, this model predicts the exponential growth typically observed in microalgae populations (Fig. 3B). The virus- free population growth rate converges toward an asymptotic value
λ free = 1 ─2 { (A + B ) +
√
__________________
(A − B)
2 + 4 a
S a R e S e R }
where A = (1 − eR)aS and B = (1 − eS)aR represent the rates at which S and R cells produce new progeny cells of the same kind as them-selves. In these circumstances, the S/R ratio equals eSaR/(free − A), which, for presumably small switching rates (eS, eR) and considering a cost to resistance, i.e., aS > aR, leads to a larger fraction of S cells in the population, as shown in Fig. 3B.
When the virus is introduced, the population size drops as S cells are eliminated from the population (Fig. 3A) but only until the R cells, which were previously produced by the switch of S cells, take over the population (Fig. 3B). During this transitory stage that only lasts for a few days, the S/R ratio changes and converges toward eS/(1 − eS), which, for small values of eS, indicates that R cells dominate the population. The dynamics then enters a second asymptotic stage where the infection is maintained because R cells produce S cells that sustain the viral population (Fig. 3A). The growth rate of such infected popu-lation quickly converges to
λ inf ≈ B
and the proportion of virus, V, to microalga, M (M = S + R), can then be approximated by
V
─
M ≈ ─ a v SR ─1 − e e S S
The proportion of microalga relative to viruses is then defined by the growth rate of R microalga, the burst size (vS), and the switch rate from R to S (eS). Numerical fit of model behavior to observa-tions of Fig. 1 provides indirect estimates of eS between 0.1 and 0.2 and vS between 5 and 30, in accordance with the expected range of biological values in this system.
Genome sequences of O. mediterraneus and OmV2
To investigate the genomic bases of this interaction, we performed thorough genome assembly and annotation of the original RCC2590
Fig. 2. Comparison of SOC from O. mediterraneus RCC2590 virus-resistant (R) and virus-susceptible (S) lines. (A) Karyotyping of R and S lines by PFGE (left; black background) and in-gel hybridization with SOC-specific probes (right; gray back-ground). (B) Nucleotide sequence alignment of the SOCs of R and S1 lines shows that they are virtually identical (identical regions linked with yellow blocks) except for a 58-kb deletion at the end of the S1 SOC. The deletion consists of short se-quences with significant identity to the rest of the SOC, shown by red and blue blocks denoting sense and antisense matches, respectively. (C) Zoomed-in view of the genomic map of the 58-kb deletion (blue outline). Gray blocks are genes with significant identity to other SOC loci. Magenta blocks show unique genes deleted in the S1 SOC with the table below listing their gene identifiers (prefixed by Ostme30g), putative functional description, and gene length. bp, base pairs; RNase, ribonuclease.
on April 28, 2020
http://advances.sciencemag.org/
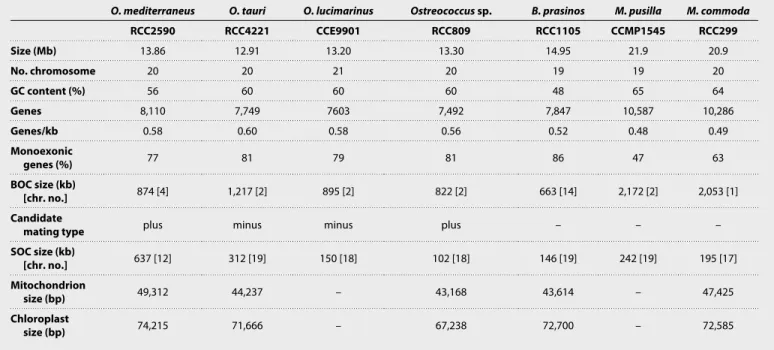
culture. Probes designed to unique regions of three chromosomes are as follows: the chromosome carrying the candidate sexual mating– type locus (17, 19); the predicted SOC; and chromosome 17, carrying the 18S rRNA gene, hybridized to chromosomal bands in the gel corresponding to their assembled sizes (fig. S3). In addition, 16 scaf-folds were bordered by two telomeric sequences, providing further confirmation that this genome assembly comprised a majority of complete chromosome sequences. Complete circular assemblies were also obtained for the chloroplast and the mitochondrion, which were similar to the organellar genomes of other Ostreococcus species in size, topology, the presence of segmental duplications, and gene content (20). Together, O. mediterraneus displayed a similar number of chromosomes and genes, as well as the hallmarks of genome streamlining seen in other Mamiellophyceae genomes, including relatively small overall genome size and high coding density (Table 1). Two notable features of this genome were the presence of the largest SOC so far recorded, which was more than three times the average size of other sequenced Mamiellophyceae, and a relatively low GC content (56%) compared to other Ostreococcus species (Table 1). On the basis of an alignment of protein-coding regions between O. tauri and O. mediterraneus, all chromosomes, except for the SOC and the putative mating locus, shared a high degree of colinearity (fig. S4).
The assembly of OmV2 resulted in a linear 192-kb-long sequence with a mean GC content of 40.7% and encoded 221 predicted genes, similar to other sequenced prasinoviruses (14, 21–23). Visualization of the DNA extraction of O. mediterraneus cultures by PFGE and subsequent hybridization with OmV2-specific probes revealed a band at ~200 kb (fig. S3), consistent with the assembled genome size and a linear structure. This hybridization demonstrated that the viral genome was not integrated into one of the O. mediterraneus chro-mosomes. The abundance of OmV2 in the DNA extracted for the PFGE was so low as not to be visually detectable as a band by ethidium bromide staining (indicating <1 ng of OmV2 in the PFGE). The coverage of the OmV2 genome was ~0.5× that of the microalga nuclear genome, suggesting that, at the time of sequencing and following culture centrifugation and DNA extraction protocol, OmV2 genome copies were half as abundant as the microalga.
Genomic insights into an ancestral
Ostreococcus-prasinovirus interaction
We took advantage of the available Mamiellales and prasinovirus genomes to infer the ancestral Ostreococcus genome architecture and test the long-term coexistence scenario. Phylogenomic analysis of 188 single-copy gene families shared among all Chlorophyta (fig. S4) and from 2161 single-copy Mamiellales orthologs placed
O. mediterraneus at the earliest diverging branch within the Ostreococcus
genus (Fig. 4), consistent with 18S ribosomal DNA phylogeny (13). Pro-tein families gained, lost, or expanded were retrieved in O. mediterraneus by comparative protein family analysis on the fully sequenced Mamiellales genomes. This showed that all Ostreococcus species have lost 261 of the 5096 protein families present in all Mamiellales (Fig. 4), which represent probable ancestral Mamiellales functions and thus reflect the general trend of genome reduction in Ostreococcus (Table 1). Nonetheless, O. mediterraneus has retained relatively more of these ancestral protein families, of which 72 are uniquely present in O. mediterraneus and lost in the other Ostreococcus species.
The lower genomic GC content of O. mediterraneus as compared to other Ostreococcus species raised the question of whether it de-scended from a high–GC content ancestor and experienced a shift toward a lower GC composition or whether it descended from a low–GC content ancestor and that an increase in GC occurred in the rest of the Ostreococcus clade. To discriminate between these two alternative hypotheses, we inferred the ancestral genomic GC content for all ancestors of the species tree using ancestral sequence reconstruction techniques. Because current GC contents vary be-tween 0.5 and 0.65, we reconstructed ancestral sequences with a nonhomogeneous codon substitution model to allow each lineage to vary in global nucleotide compositions. This analysis showed that the last common ancestor of the Ostreococcus clade had a GC content of ~0.57, similar to that of O. mediterraneus and lower than that of O. tauri, Ostreococcus lucimarinus, and Ostreococcus sp. RCC809 (~0.60) (Fig. 4). This global trend is consistent across all codon positions although to a much lesser degree for the highly constrained second codon position (fig. S4). This genomic GC content increase occurred twice within Mamiellophyceae, once within
Ostreococcus, and once in the other in the branch leading to the Micromonas lineage (Fig. 4).
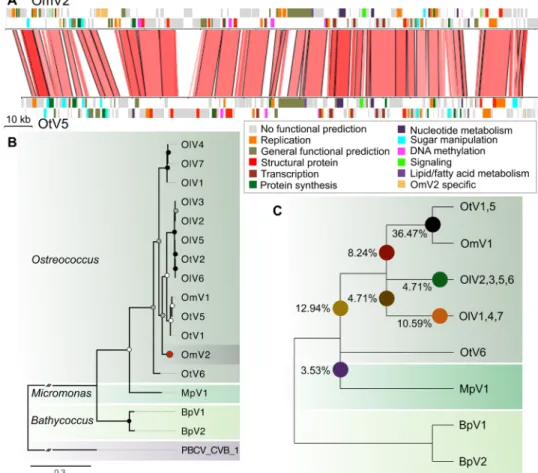
Whole-genome alignment of OmV2 against the model Ostreococcus virus OtV5 (14) revealed large syntenic regions and overall conser-vation of gene order interspersed with virus-specific gene gains and losses (Fig. 5A and table S1). Phylogenetic analysis of the widely
Fig. 3. Model predictions of microalga-virus population dynamics. (A) Model parameters with and without virus. (B) Simulation of the evolution of the number of microalga cells during 40 days; viruses are introduced after 13 days, and the system converged to its virus/microalga equilibrium behavior after 18 days (aS = 1.75, aR = 1.7, and eS = eR = 0.01). (C) Evolution of the proportion of susceptible (S) and
resistant (R) microalga; initial S and R values have been set to reflect equilibrium proportion without virus.
on April 28, 2020
http://advances.sciencemag.org/
used NCLDV taxonomic marker, the DNA polymerase B (PolB) gene, placed OmV2 with viruses infecting Ostreococcus spp. within the Prasinovirus (Fig. 5B). The PolB phylogeny regrouped viruses infecting the microalgae from the same genus, while some viral
clades contain members that were isolated from different species. To explore the evolutionary relationship of OmV2 with other prasino-viruses, we identified 85 core orthologous proteins shared between the 15 complete prasinovirus genomes. Phylogenies computed for each of these genes showed that most orthologs supported the monophyly of Ostreococcus viruses, with only 3.5% clustering with Micromonas
pusilla virus 1 (MpV1) (Fig. 5C). To highlight the incongruencies of
the gene tree topologies within the Ostreococcus virus phylogeny, we estimated the percentage of genes supporting the position of OmV2 on different branches. The majority (36%) of OmV2 genes clustered within the OmV1, OtV1, and OtV5 clade (Fig. 5B), as compared to 8% of OmV2 genes supporting a more basal position.
DISCUSSION
A decade of coexistence of microalgae and prasinovirus reveals a reversible susceptible-resistant phase switch The study of a microalgae-virus system maintained for more than a decade provided evidence of two phenotypes: an S and an R phenotype, as well as the existence of an R-to-S phase switch within an isogenic culture undergoing clonal reproduction. Previous analyses of the related O. tauri–OtV system have shown that O. tauri strains resistant to a broader range of virus strains tend to have larger SOC sizes (19) and increased differential expression of SOC-encoded genes (24). As the spontaneous mutation rate associated to random errors of the replication machinery (25) is too low to account for the rapidity and prevalence of the acquisition of viral resistance (text S1), we suggest that the phase switch is associated to an immunity-specific mutation process involving a programmed modification of the SOC, as observed in O. tauri switching from S to R (24) but, in O. mediterraneus, was linked to an R-to-S switch.
The cell immunity toolkit is notorious for combining genetic and nongenetic mechanisms to produce phenotypic plasticity from a single genome (26). While we can only speculate about the genes involved,
Table 1. Comparison of the genomic features of sequenced Mamiellophyceae. chr. no., chromosome number; –, not determined.
O. mediterraneus O. tauri O. lucimarinus Ostreococcus sp. B. prasinos M. pusilla M. commoda
RCC2590 RCC4221 CCE9901 RCC809 RCC1105 CCMP1545 RCC299 Size (Mb) 13.86 12.91 13.20 13.30 14.95 21.9 20.9 No. chromosome 20 20 21 20 19 19 20 GC content (%) 56 60 60 60 48 65 64 Genes 8,110 7,749 7603 7,492 7,847 10,587 10,286 Genes/kb 0.58 0.60 0.58 0.56 0.52 0.48 0.49 Monoexonic genes (%) 77 81 79 81 86 47 63 BOC size (kb) [chr. no.] 874 [4] 1,217 [2] 895 [2] 822 [2] 663 [14] 2,172 [2] 2,053 [1] Candidate
mating type plus minus minus plus – – –
SOC size (kb) [chr. no.] 637 [12] 312 [19] 150 [18] 102 [18] 146 [19] 242 [19] 195 [17] Mitochondrion size (bp) 49,312 44,237 – 43,168 43,614 – 47,425 Chloroplast size (bp) 74,215 71,666 – 67,238 72,700 – 72,585
Fig. 4. Phylogeny of fully sequenced Mamiellales genomes, gene family gain and loss, and reconstructed ancestral global GC contents and protein families. The phylogenetic tree was calculated from random subsampling of 2161 Mamiellales single-copy orthologous gene alignments. The branch colors correspond to the estimated changes in GC over time. The average genome-wide GC contents of extant genomes are shown after the species in bold, and the ancestral estimates are shown at the nodes with ranges in square brackets (see Materials and Methods for the GC evolution estimates). The total number of protein families common to Bathycoccus and Micromonas are shown in red italics between parentheses at the node leading to those genera, and the numbers of those orthologs present in extant Ostreococcus are shown after the species names.
on April 28, 2020
http://advances.sciencemag.org/
as there are no orthologous genes in the SOC of the Mamiellales sequenced to date, the same kinds of gene functions are overrepre-sented in the SOCs of all of these species, suggesting that variation in these functional genes imparts viral immunity in Mamiellales. Our results support the proposed function of the SOC as a special-ized chromosome involved in antiviral immunity, evidence for which has been provided in two species so far: O. tauri and O. mediterraneus.
Analysis of the whole gene content of O. mediterraneus con-firmed its phylogenetic position at the base of the Ostreococcus lineage. Maximum likelihood inference suggests that the Ostreococcus ancestor had a GC-poorer genome and contained a larger number of genes than the present species, revealing a global trend toward genome streamlining (27). The comparison of the genome sequence of its resident prasinovirus, OmV2, with available prasinovirus sequence reflected the story of a highly dynamic virus genome with recombination between related viral clades (28) and independent horizontal gene transfers from different microalga hosts into the virus genome (29). Together, phylogenetic analysis of OmV2 genes dismisses coevolution of this host-virus pair since the speciation of
O. mediterraneus. Instead, it is consistent with substantial gene
ex-change between the ancestors of present-day species-specific prasino-viruses (22).
How does this phase switch translate into microalga-virus population dynamics?
Mathematical modeling of the phase switch is consistent with ob-served continuous virus production of OmV2 by O. mediterraneus, which is a consequence of the production of new viruses by S cells that are generated from R cells. This model does not generate oscil-latory dynamics after an initial lysis event, contrary to many previ-ous host-lytic virus coexistence models (11). The recently proposed “leaky resistance” model from a bacteria-bacteriophage system does also predict continuous virus and host growth and could also be invoked to describe the R-to-S switch (30). The population collapse observed upon infection in culture is only predicted if S microalgae make up most of the population. This is predicted either if there is a bias between the S-to-R and the R-to-S switch (eS > eR) or if S microalgae have a higher growth rate than R microalgae, producing a trade-off between resistance and growth. While there is evidence of this trade-off in many bacterial-bacteriophage systems (31), there is yet little evidence for a similar trade-off in microalgae (32). Our model is consistent with these findings in predicting, over longer time periods, an equilibrium S/R ratio depending on four parameters that are independent of the phenotype of the founder cell. Long-term competition experiments that started with an equal
Fig. 5. Phylogenomic analysis of prasinovirus OmV2. (A) Whole-genome alignment of OmV2 compared to the O. tauri virus, OtV5. Genomic regions with 60 to 100% nucleotide identity are joined by red blocks with higher identity indicated by darker red. Genes are colored according to functional groups. (B) Maximum likelihood phylogenetic tree of amino acid sequences of the DNA polymerase B gene from prasinoviruses infecting the genera Ostreococcus, Micromonas, and Bathycoccus. The tree was rooted with PBCV-1 (Chlorovirus) with the connecting branch truncated for display. The red circle highlights the position of OmV2. Circles at the nodes represent bootstrap support of 50 to 70% (white), 70 to 90% (gray), and 90 to 100% (black). The scale bar shows substitutions per site. (C) Cladogram representing the relationships between the fully sequenced prasinovirus clades from 85 core genes. Colored circles mark the branching positions of the percentage of the OmV2 orthologs. on April 28, 2020
http://advances.sciencemag.org/
number of S and R O. tauri cells resulted in the evolution of cultures with a majority of S cells (10), consistent with either a higher growth rate of S cells and thus a cost of resistance or eS > eR. In the present microalga-virus system, the cost of resistance may be metabolic, as a consequence of an increase in the size of the SOC, which requires additional energy and resources for cell replication.
One fundamental property of a life history strategy is its evolu-tionary stability, which can be estimated by investigating whether a population adopting one strategy can be invaded by individuals playing another (33). A microalga with a pure S strategy (it cannot convert from S to R) cannot invade a culture with the resistant-susceptible switch strategy (hereafter referred to as RS strategy) in the presence of viruses, as the viruses will lyse it. It will, however, invade an RS culture in the absence of viruses since microalgae with a pure S strategy divide more rapidly than the R microalgae. Now, a microalga with a pure R strategy (not generating S cells) will not invade an RS popu-lation in the absence of viruses because of its lower growth rate than the S microalgae. However, it will invade the RS population in the presence of viruses, as the R cells that do not switch to S will invade the population. The RS strategy that we describe is therefore not evolutionarily stable, neither in the presence nor in the absence of viruses, so the most obvious explanation for its persistence comes from the evolutionary theory of bet-hedging (34) that demonstrates that a strategy may be suboptimal under one environmental condition, but advantageous in the long run, when environmental conditions alternate randomly. The RS strategy outcompetes both a pure S and a pure R strategy if virus presence and absence alternates (34). A droplet of seawater can certainly experience changes in virus preva-lence over short time scales, by mechanisms of marine virus decay (35) or mixing of water masses or rain (36). Last but not least, the RS strategy may confer a substantial advantage by lysing competitors because strains propagating a virus have a higher probability of invasion in the face of competitors that may be susceptible to the virus produced (37).
What is the prevalence of the RS strategy in the environment?
Within the simplified one-microalga, one-virus experimental set up, our model makes two predictions. First, it predicts the systematic recovery of cell density after virus-induced lysis. This has been re-ported in many different species from divergent branches of the eukaryotic tree of life: Haptophyceae, Stramenopiles, and Chlorophytes (8, 24, 38). Second, it predicts the steady production of viruses in apparently healthy cultures. While this has been explicitly reported in E. huxleyi, Phaeocystis pouchetii (8), and O. tauri (10), it has also been observed in the dynamics of C. variabilis (11). However, it is difficult to extend this single-species dynamic to the community scale, where several microalga-virus pairs compete for the same re-sources (39). A general prediction that we venture is that introducing RS microalgae in community models may increase the overall sta-bility of the host-virus dynamics. This model is consistent with pre-viously reported non–“boom and bust” dynamics in the natural environment (40), including persistent infection (41). Transcriptomes of several hundred species from the Marine Microbial Eukaryotic Transcriptome Sequencing Project (MMETSP) initiative revealed the expression of core NCLDV genes in 13 cultures (42). While this may merely indicate infection, one of the haptophyte strains se-quenced had been described as persistently infected (42). Screening six O. mediterraneus transcriptomes from the MMETSP (table S2)
for OmV2 sequences, we found evidence for a virus in strain RCC2596. This strain was isolated on the same day and site as the genome- sequenced strain RCC2590, and although closely related, they are nonidentical, having approximately five differences per 10,000 bp and different karyotypes (13). RCC2596 was still available in culture in our laboratory, and we could thus experimentally confirm the presence of viral DNA in the culture by PCR. Given that these strains were independently isolated, this implies that stable coexistence was widespread in this population in the environment but is simply not detected during the isolation of algae as the bulk culture grows reliably. We thus speculate that this phase switching is a common strategy within NCLDV-microalga interactions, in addition to mutation and selection mechanisms that lead to pure R microalga strains and the arms race type of interaction. This phase switch is the result of a yet to be described molecular mechanism of cell immunity in microalgae, mirroring the complexity of the NCLDV genomes that they have been coevolving with since the early stages of eukaryotic life (43).
MATERIALS AND METHODS Cultures and growth conditions
All O. mediterraneus strains were maintained in liquid L1 medium (National Center for Marine Algae and Microbiota, Bigelow Laboratory for Ocean Sciences, USA) without addition of Na2SiO3, prepared using
autoclaved seawater from offshore Banyuls Bay (MOLA station: 42°27′11″N, 3°32′36″E) diluted 10% with Milli-Q water, and filtered before use through 0.22-m filters, under a 12-hour light/12-hour dark regime. Incubation temperature was 15°C for measuring growth curves in population dynamics experiments and 20°C for all other experiments. The strains used in this study and the genomic and transcriptomic data obtained for them are listed in table S2. PFGE and in-gel hybridization
PFGE and in-gel hybridization enabled estimation of chromosome sizes in different strains and testing for the presence of the virus genome. PFGE and in-gel hybridization were performed as previously described with modifications as follows (44). Cells (8.7 × 10⁷) in
exponential growth phase were harvested by centrifugation (8000g for 20 min), resuspended in 150 l of TE buffer [10 mM tris-HCl and 125 mM EDTA (pH 8)], and then embedded in plugs by mixing with an equal volume of molten low–melting point agarose (1% in TE buffer precooled to 45°C). After setting, the cells were lysed in the agarose plugs by immersing the plugs in proteinase K buffer [10 mM tris HCl (pH 8), 0.5 M EDTA (pH 8), 1% lauroyl sarcosinate, and proteinase K (1 mg ml−1) (final concentration)] at 37°C for
24 hours under constant agitation. The plugs were then washed three times in EDTA solution [0.5 M (pH 8)] at 37°C for 2 hours under constant agitation and then stored in EDTA solution at 4°C. PFGE was performed in 0.8% agarose gels in 0.5× tris-borate EDTA buffer [44.5 mM tris, 44.5 mM boric acid, and 1 mM EDTA (pH 8)] with 2 mm of plug from each sample loaded into the wells. Electro-phoresis was run in the CHEF-DR III (Bio-Rad) system at 14°C and 3 V cm−1 with 120° pulse angle for 45 hours with a switch time of
90 s, followed by 27 hours at a switch time of 140 s. After PFGE, DNA was visualized by immersing the gel in a solution of ethidium bromide. The gel was moved to a flat-bottomed dish, and enough 0.4 M NaOH was added to cover the gel for chemical denaturation of the DNA by incubation for 30 min at room temperature with
on April 28, 2020
http://advances.sciencemag.org/
agitation. Then, the gel was washed three times for 10 min in a 6× SSC solution [20× SSC, 3 M NaCl, and 0.3 M Na3citrate (pH 7)].
Last, the gel was dehydrated under vacuum (GD2000, Hoefer Inc., Richmond, CA, USA).
PCR (GoTaq, Promega) was used to amplify specific regions of the SOC, Big Outlier Chromosome (BOC), OmV2, and the 18S rRNA gene (see table S3 for primer sequences) for use as DNA probes with the following conditions: initial denaturation for 2 min at 94°C; 30 cycles of denaturation for 30 s at 94°C, annealing for 30 s at 55°C, and extension for 45 s at 72°C; and final extension for 5 min at 72°C. The PCR product was cleaned with Wizard (Promega) SV Gel and PCR Clean-Up System. The amplicons were randomly labeled with [-32P]cytidine triphosphate (PerkinElmer catalog no. BLU008H250UC) according to the manufacturer’s instructions (Prime-a-Gene kit, Promega, catalog no. U1100) for use as DNA probes. Dried gels were equilibrated in sufficient hybridization buffer [6× SSC, 5× Denhardt’s solution, 0.1% (v) SDS, and tRNA (10 g ml−1)] to cover the gels for 3 hours at 65°C with constant agitation, after which radiolabeled probes were added and hybridized overnight at 65°C with constant agitation. After hybridization, the gel was sub-jected to a series of washes with constant agitation: three washes in 6× SSC buffer at room temperature for 30 min, one wash in 6× SSC buffer at 65°C for 1.5 min, followed by a final wash in 3× SSC buffer at room temperature for 5 min. The gel was sealed in a transparent plastic sleeve and then exposed to radiographic film.
Transmission electron microscopy
RCC2590 culture in exponential growth phase was centrifuged for 20 min at 6000g before inclusion in agar 1% to avoid successive cen-trifugations. Plugs were embedded in epoxy resin (Epon 812) after fixation with 2.5% glutaraldehyde. Images of individual cells and cells deemed to be visibly infected if clear virus-like particles were clearly present within the cell were captured.
Genome sequencing and assembly
Genome library preparation, sequencing, assembly, and optical mapping were performed by Genoscope (www.genoscope.cns.fr). Two libraries were prepared and sequenced using the Illumina HiSeq platform; a paired-end (PE) read library of 272-bp insert size and a mate-pair (MP) library of five 230-bp insert size. DNA sequence reads were assembled using ALLPATHS-LG assembler (45). At this stage, 99 scaffolds were obtained that aligned with eukaryotic sequences. Optical mapping was performed to further place the
O. mediterraneus scaffolds in their correct order on the chromosome.
This resulted in 19 optically mapped scaffolds corresponding to nu-clear chromosomes and several low-GC scaffolds corresponding to fragments of the SOC, organelles, and OmV2. The organelles were assembled using ABySS from the Illumina HiSeq PE reads using the MP library for scaffolding (abyss-pe, lib = “PE,” mp = “MP,” k = 85,
n = 10). Organelle genome completeness was evaluated by
align-ment to the complete organelle sequences of O. tauri. The two large contigs of the OmV2 genome obtained from the Illumina sequencing were scaffolded together manually using the assembly and visualiza-tion tools available from the Geneious software (www.geneious.com). To resolve the highly repetitive SOC sequence, genomic DNA from RCC2590 and the evolved line MA3 were resequenced with the Single Molecule, Real-Time (SMRT) technology PacBio RS II by the GeT-PlaGe sequencing platform in Toulouse, France as previously described (19). The raw data were assembled using HGAP3 (version
2.3.0). The PacBio assemblies were checked manually with assembly and visualization tools available from the Geneious software to identify the scaffolds corresponding to the SOC. Both RCC2590 and MA3 SOCs were assembled from telomere to telomere, the former comprising five scaffolds and the latter a single scaffold.
Genome annotation
Briefly, gene models were predicted using EuGene (release 4.1; eugene. toulouse.inra.fr). Transcript information was provided to the gene caller as follows: one PE Illumina RNA sequencing (RNA-seq) dataset was assembled into transcript contigs using a De Bruijn Graph (DBG) assembly approach with high Kmer sizes to boost specificity during the assembly. Six O. mediterraneus strains (table S2) had their transcriptome sequenced as part of the MMETSP. The resulting transcriptomes are referenced in table S2 with their respective MMETSP identifiers.
The obtained set of contigs was cleaned from any contigs smaller than 300 bp, completed with expressed sequence tag sequences col-lected from National Center for Biotechnology Information (>300 bp) and mapped on the genomic scaffolds by combining BLASTN (for rapid detection on regions of interest) and GenomeThreader (for fine mapping, taking splice sites into account) with parameters set to map at least 98% of the transcript sequence on the regions as reported by BLASTN. Besides, RNA-seq was also mapped directly onto the ge-nome using HISAT2, and junctions were extracted from the BAM alignments with RegTools. The obtained junction instances were counted and grouped on the basis of the intron coordinates that was spanned by a read. This count (or coverage) was used to filter for junctions confirmed by a minimum of three reads. Functional descrip-tions were inferred from filtered best BLAST hits and combined with protein domains obtained with InterPro. This automatic annotation was curated using the Online Resource for Community Annotation of Eukaryotes (ORCAE) portal (bioinformatics.psb.ugent.be/orcae/). All predicted genes were manually inspected, and from the 8483 protein-coding genes, 1142 have been modified (including gene fusions) and 59 were discarded, resulting in a final set of 8110 protein- coding genes. The functional description was manually edited for 662 genes.
Gene prediction in OmV2 was performed using Glimmer imple-mented within Geneious. Functional description of predicted OmV2 genes was done using BLASTX against the non-redundant (NR) database (from December 2017) with default parameters and against the Pfam version 31.0 database (http://pfam.xfam.org/). tRNAs were predicted using the tRNAscan-SE 2.0 web server.
Comparative genome analysis
The genome and predicted genes from O. mediterraneus RCC2590 were loaded into a custom instance of pico-PLAZA (bioinformatics. psb.ugent.be/plaza/versions/pico-plaza/) containing 38 eukaryotic genomes (including Metazoa, Fungi, Chlorophyta, Embryophyta, Rhodophyta, Haptobionta, and Stramenopiles; table S4). Following an “all-versus-all” BLASTP (version 2.2.27+; e-value threshold, 10−5;
max hits, 500) protein sequence similarity search, both TribeMCL (version 10-201) and OrthoMCL (version 2.0; mcl inflation factor, 3.0) were used to delineate gene families and subfamilies, respectively.
Phylogenomic analysis of the O. mediterraneus nuclear genome was performed by concatenating the amino acid sequence from 188 single-copy orthologs by TribeMCL within the Chlorophyta ge-nomes (O. mediterraneus, O. tauri, O. lucimarinus, O. sp. RCC809,
Micromonas pusilla strain CCMP1545, Micromonas sp. RCC299,
on April 28, 2020
http://advances.sciencemag.org/
Bathycoccus prasinos, Arabidopsis thaliana, Chlamydomonas reinhardtii, Coccomyxa subellipsoidea C-169, C. variabilis NC64A, Oryza sativa, Physcomitrella patens, and Volvox carteri) aligned using MUSCLE
(version 3.8.31). This resulted in alignment of 148,028 positions of which 88,784 were informative. Similarly, the phylogenetic to-pology across Mamiellales was determined by concatenating the alignment of 2161 single-copy genes, generated using MUSCLE, resulting in an alignment of 1,267,142 positions of which 444,911 were informative. The phylogenetic trees were generated using RAxML (version 8.2.8) (model, PROTGAMMAWAG) with 100 boot-strap replicates.
The phylogenetic profile of TribeMCL gene families (excluding orphans) and the inferred Mamiellales tree topology were provided to reconstruct the most parsimonious gain and loss scenario for every gene family using the Dollop program from the PHYLIP package (version 3.69).
Prasinovirus phylogenomics
Eighty-five putative orthologous prasinovirus genes were identified for phylogenetic analyses by TBLASTX of predicted OmV2 genes against a database of all genes from 15 fully sequenced prasinovirus genomes (e-value, <10−4; amino acid identity, >75%; and alignment
length, >50) accepting as “core” those orthologs present in all genomes. Each ortholog family was aligned using MAFFT, and phylogenetic trees were reconstructed using Bayesian inference with MrBayes using a mixed model for amino acid with four chains of 106 generations,
trees sampled every 100 generations, and burnin value set to 20% of the sampled trees. We checked that the SD of the split frequencies fell below 0.01 to ensure convergence in tree search.
Analysis of the evolution of GC content
To reconstruct genomic GC contents along the tree of Ostreococcus, we used an ancestral sequence reconstruction approach to reconstruct gene sequences at the codon level and compute their GC contents at the tree nodes. We included three outgroups (B. prasinos, M. pusilla CCMP1545, and Micromonas commoda RCC299) in the reconstruc-tion of ancestral GC contents of the four Ostreococcus lineages and selected all 2161 single-copy genes universally present in these seven genomes, as determined from the comparative genomic analysis. We aligned all 2161 universal single-copy protein fam-ilies at the codon level with MACSE using default parameters and trimmed alignments for badly aligned positions with BMGE using a BLOSUM62 substitution matrix and other parameters set to their default values.
To both reduce computational burden and produce confidence intervals in estimates of ancestral GC contents, we used a jackknife approach to subsample the 2161 alignments and to build 100 catenates containing each 100 randomly sampled genes. Each con-catenate has an average size of 104,290 nucleotide positions (±8644), representing on average 34,763 codons, and so is expected to contain a sufficient amount of phylogenetic information to reconstruct an-cestral GC contents. We further verified that these concatenates are faithful representations of each genome in terms of GC contents. We computed correlation coefficients between the average GC con-tents computed across all 2161 genes and the GC concon-tents of each of the 100 concatenates. We observed that all correlation coefficients were higher than 0.972, showing that these 100 jackknife subsamples have the same properties than the original population of 2161 genes, which allows us to infer ancestral genomic GC contents.
We first reconstructed the phylogenetic tree of each of the 100 con-catenates to verify that each concatenate contains the same phyloge-netic information on the relationships between the seven considered species. We built trees with FastTree (version 2.1.8) using a generalized time-reversible (GTR) model and the per-site rate CATegories (CAT) approximation with 20 categories to model the variation of evolutionary rates across sites. Each phylogenetic reconstruction yielded a tree consistent with the reference species tree of the seven species. We used this topology to reconstruct ancestral sequences on all concatenates. We used the Yang and Nielsen (YN) substitution model for codons with different base frequencies at the three codon positions (F3x4) to model codon evolution. As the seven species have genomic GC contents that vary from ~0.5 to ~0.65, the GC composition has not evolved homogeneously in time, as was previously observed in many prokaryotic and eukaryotic lineages. For this reason, we considered a nonhomo-geneous and nonstationary approach in which stationary frequencies are allowed to vary from one lineage to another on the species tree. Each branch of the species tree is assigned its own set of parameters of the YN model, and the stationary codon frequencies at the root of the species are also free to vary. We used maximum likelihood and the BppML program to estimate the parameters of this nonhomogeneous model and the branch lengths of the tree. Using the maximum likelihood values for all these parameters, we reconstructed ancestral sequences with the BppAncestor program, using the marginal ancestral sequence reconstruction (ASR) approach. At a given internal node of the species tree, the codon state having the maximum posterior probability was inferred as the putative ancestral state. We then computed the ancestral global GC content as well as the ancestral GC content of all codon posi-tions from these reconstructed maximum likelihood ancestral sequences. We obtained a distribution of ancestral GCs for each ancestor from which we computed the mean and the 95% confidence interval. Population dynamics of virus and microalga
Microalgae and viruses were counted over 13 days by flow cytome-try and plaque assay from triplicate 20-ml cultures in tissue culture flasks at 15°C in a 12-hour light/12-hour dark regime. Cultures of RCC2590 and S1 were inoculated to have a starting density of 104 cells ml−1. In addition, we passed the RCC2590 culture through
a 0.2-m filter to remove cells retaining free virions in the medium and kept this filtrate in the same conditions as the cultures to esti-mate viral particle stability over the duration of the experiment. For flow cytometry counts of cells and viruses, 250 l was sampled every 2 days, fixed for 15 min in the dark with a final concentration of electron microscopy–grade glutaraldehyde of 0.25% and Pluronic F-68 of 0.01%, flash-frozen in liquid nitrogen, and stored at −80°C until analysis. Cell and viral particle counts were performed with the BD FACSCanto II (Becton Dickinson) where the flow rate over 1 min at a low rate was determined using triplicate measurements of BD Trucount Tube beads. Cells were counted from fixed samples using red autofluorescence and side scatter. Viral counts were per-formed on fixed samples after rapid thawing at 40°C, diluting as necessary in filtered seawater (<0.02 m), staining for 10 min at 80°C with SYBR Green I (Molecular Probes) (0.5× final concentra-tion of commercial stock), and setting the trigger to measure green fluorescence and side scatter. To measure the concentration of in-fective OmV2 in the RCC2590 culture medium by plaque assay, 1 ml was sampled from the cultures every 2 days and centrifuged at 25,000g for 10 min at 15°C to remove cells, and the supernatant was serially diluted with L1 medium. Plaque assay was performed with
on April 28, 2020
http://advances.sciencemag.org/
the diluted supernatant as described in (38) using the OmV2- susceptible O. mediterraneus strain S1 as the host.
Experimental assessment of the resistant-to-susceptible phase switch
Virus-free O. mediterraneus lines were obtained by end-point dilu-tion, and virus absence was confirmed by PCR using degenerate primers for the viral DNA polymerase and major capsid protein gene (table S3). We started 204 clonal cultures from one single cell in 1-ml microwells and tested for virus susceptibility after 7 days. Virus susceptibility was tested using cell-free, virus-producing cul-ture (VPC) medium.
To obtain cell-free VPC medium (i.e., separate potential virions from cell lysates), medium from growing or lysed cultures was centrifuged at 25,000g for 10 min at room temperature and the supernatant was filtered (<0.45 m). To test whether a cell line was susceptible to lysis, VPC medium was introduced into the growing test culture, with a control culture grown in parallel inoculated with the same volume of sterile medium, and visually inspected for lysis up to 5 days after inoculation. This visual inspec-tion detected when most cells are lysed, and thus, the ancestral cell was inferred to be S. The validity of this inference relied on two assumptions: a low switch rate between the S and R phenotypes and a low difference in growth rates between the R and susceptible phenotypes.
Mathematical modeling of the host-virus population dynamics
The model considered a population made of S and R microalga (St, Rt) and their viruses (Vt) at time t. The changes in microalgae and viruses numbers from 1 day (t) to another (t + 1) were modeled according to a simple representation of the algae and virus life cycles and interactions with the following assumptions: (i) S and R microalgae produce new microalgae at rates as and ar, (ii) microalgae are born
from a S (R) to switch to a R (S) phenotype at a fixed rate eR (eS), (iii) encounters between S algae and virus occur randomly at a rate c, (iv) each infected microalga produced v viruses before death, and (v) viral particles survived at a rate sV. The population dynamic of R, S, and V can then be described by following equations
S t+1 = ( 1 − e R ) a S e −c V t S t + e S a R R t R t+1 = e R a S e −c V t S t + ( 1 − e S ) a R R t V t+1 = v S ( 1 − e −c V t) S t + s v e −c S t V t
where e−cVt is the probability drawn in Poisson distributions that a S alga encounters no virus or that a viral particle encounters no S algae to infect. This system was investigated analytically and numerically using the R software.
SUPPLEMENTARY MATERIALS
Supplementary material for this article is available at http://advances.sciencemag.org/cgi/ content/full/6/14/eaay2587/DC1
View/request a protocol for this paper from Bio-protocol.
REFERENCES AND NOTES
1. C. A. Suttle, Marine viruses—Major players in the global ecosystem. Nat. Rev. Microbiol. 5, 801–812 (2007).
2. C. P. D. Brussaard, S. W. Wilhelm, F. Thingstad, M. G. Weinbauer, G. Bratbak, M. Heldal, S. A. Kimmance, M. Middelboe, K. Nagasaki, J. H. Paul, D. C. Schroeder, C. A. Suttle,
D. Vaqué, K. E. Wommack, Global-scale processes with a nanoscale drive: The role of marine viruses. ISME J. 2, 575–578 (2008).
3. P. Hingamp, N. Grimsley, S. G. Acinas, C. Clerissi, L. Subirana, J. Poulain, I. Ferrera, H. Sarmento, E. Villar, G. Lima-Mendez, K. Faust, S. Sunagawa, J.-M. Claverie, H. Moreau, Y. Desdevises, P. Bork, J. Raes, C. de Vargas, E. Karsenti, S. Kandels-Lewis, O. Jaillon, F. Not, S. Pesant, P. Wincker, H. Ogata, Exploring nucleo-cytoplasmic large DNA viruses in Tara Oceans microbial metagenomes. ISME J. 7, 1678–1695 (2013).
4. M. Tragin, D. Vaulot, Green microalgae in marine coastal waters: The Ocean Sampling Day (OSD) dataset. Sci. Rep. 8, 14020 (2018).
5. F. Zhu, R. Massana, F. Not, D. Marie, D. Vaulot, Mapping of picoeucaryotes in marine ecosystems with quantitative PCR of the 18S rRNA gene. FEMS Microbiol. Ecol. 52, 79–92 (2005).
6. Z. Erez, I. Steinberger-Levy, M. Shamir, S. Doron, A. Stokar-Avihail, Y. Peleg, S. Melamed, A. Leavitt, A. Savidor, S. Albeck, G. Amitai, R. Sorek, Communication between viruses guides lysis-lysogeny decisions. Nature 541, 488–493 (2017).
7. D. D. Dunigan, L. A. Fitzgerald, J. L. Van Etten, Phycodnaviruses: A peek at genetic diversity. Virus Res. 117, 119–132 (2006).
8. R. Thyrhaug, A. Larsen, T. F. Thingstad, G. Bratbak, Stable coexistence in marine algal host-virus systems. Mar. Ecol. Prog. Ser. 254, 27–35 (2003).
9. J. L. Van Etten, L. C. Lane, R. H. Meints, Viruses and viruslike particles of eukaryotic algae.
Microbiol. Rev. 55, 586–620 (1991).
10. R. Thomas, N. Grimsley, M. Escande, L. Subirana, E. Derelle, H. Moreau, Acquisition and maintenance of resistance to viruses in eukaryotic phytoplankton populations.
Environ. Microbiol. 13, 1412–1420 (2011).
11. J. Frickel, M. Sieber, L. Becks, Eco-evolutionary dynamics in a coevolving host-virus system. Ecol. Lett. 19, 450–459 (2016).
12. K. D. Weynberg, M. J. Allen, W. H. Wilson, Marine prasinoviruses and their tiny plankton hosts: A review. Viruses 9, 43 (2017).
13. L. Subirana, B. Péquin, S. Michely, M.-L. Escande, J. Meilland, E. Derelle, B. Marin, G. Piganeau, Y. Desdevises, H. Moreau, N. H. Grimsley, Morphology, genome plasticity, and phylogeny in the genus Ostreococcus reveal a cryptic species, O. mediterraneus sp. nov. (Mamiellales, Mamiellophyceae). Protist 164, 643–659 (2013).
14. E. Derelle, C. Ferraz, M.-L. Escande, S. Eychenié, R. Cooke, G. Piganeau, Y. Desdevises, L. Bellec, H. Moreau, N. Grimsley, Life-cycle and genome of OtV5, a large DNA virus of the pelagic marine unicellular green alga Ostreococcus tauri. PLOS ONE 3, e2250 (2008).
15. M. Krasovec, A. Eyre-Walker, N. Grimsley, C. Salmeron, D. Pecqueur, G. Piganeau, S. Sanchez-Ferandin, Fitness effects of spontaneous mutations in picoeukaryotic marine green algae. G3 (Bethesda) 6, 2063–2071 (2016).
16. E. Derelle, C. Ferraz, S. Rombauts, P. Rouzé, A. Z. Worden, S. Robbens, F. Partensky, S. Degroeve, S. Echeynié, R. Cooke, Y. Saeys, J. Wuyts, K. Jabbari, C. Bowler, O. Panaud, B. Piégu, S. G. Ball, J.-P. Ral, F.-Y. Bouget, G. Piganeau, B. De Baets, A. Picard, M. Delseny, J. Demaille, Y. Van de Peer, H. Moreau, Genome analysis of the smallest free-living eukaryote Ostreococcus tauri unveils many unique features. Proc. Natl. Acad. Sci. U.S.A.
103, 11647–11652 (2006).
17. A. Z. Worden, J.-H. Lee, T. Mock, P. Rouzé, M. P. Simmons, A. L. Aerts, A. E. Allen, M. L. Cuvelier, E. Derelle, M. V. Everett, E. Foulon, J. Grimwood, H. Gundlach, B. Henrissat, C. Napoli, S. M. McDonald, M. S. Parker, S. Rombauts, A. Salamov, P. Von Dassow, J. H. Badger, P. M. Coutinho, E. Demir, I. Dubchak, C. Gentemann, W. Eikrem, J. E. Gready, U. John, W. Lanier, E. A. Lindquist, S. Lucas, K. F. X. Mayer, H. Moreau, F. Not, R. Otillar, O. Panaud, J. Pangilinan, I. Paulsen, B. Piegu, A. Poliakov, S. Robbens, J. Schmutz, E. Toulza, T. Wyss, A. Zelensky, K. Zhou, E. V. Armbrust, D. Bhattacharya, U. W. Goodenough, Y. Van de Peer, I. V. Grigoriev, Green evolution and dynamic adaptations revealed by genomes of the marine picoeukaryotes Micromonas. Science 324, 268–272 (2009).
18. H. Moreau, B. Verhelst, A. Couloux, E. Derelle, S. Rombauts, N. Grimsley, M. Van Bel, J. Poulain, M. Katinka, M. F. Hohmann-Marriott, G. Piganeau, P. Rouzé, C. Da Silva, P. Wincker, Y. Van de Peer, K. Vandepoele, Gene functionalities and genome structure in Bathycoccus prasinos reflect cellular specializations at the base of the green lineage.
Genome Biol. 13, R74 (2012).
19. R. Blanc-Mathieu, M. Krasovec, M. Hebrard, S. Yau, E. Desgranges, J. Martin, W. Schackwitz, A. Kuo, G. Salin, C. Donnadieu, Y. Desdevises, S. Sanchez-Ferandin, H. Moreau, E. Rivals, I. V. Grigoriev, N. Grimsley, A. Eyre-Walker, G. Piganeau, Population genomics of picophytoplankton unveils novel chromosome hypervariability. Sci. Adv. 3, e1700239 (2017).
20. S. Robbens, E. Derelle, C. Ferraz, J. Wuyts, H. Moreau, Y. Van de Peer, The complete chloroplast and mitochondrial DNA sequence of Ostreococcus tauri: Organelle genomes of the smallest eukaryote are examples of compaction. Mol. Biol. Evol. 24, 956–968 (2007).
21. K. D. Weynberg, M. J. Allen, K. Ashelford, D. J. Scanlan, W. H. Wilson, From small hosts come big viruses: The complete genome of a second Ostreococcus tauri virus, OtV-1.
Environ. Microbiol. 11, 2821–2839 (2009).
on April 28, 2020
http://advances.sciencemag.org/