HAL Id: hal-00517721
https://hal.archives-ouvertes.fr/hal-00517721
Submitted on 15 Sep 2010
HAL is a multi-disciplinary open access archive for the deposit and dissemination of sci-entific research documents, whether they are pub-lished or not. The documents may come from teaching and research institutions in France or abroad, or from public or private research centers.
L’archive ouverte pluridisciplinaire HAL, est destinée au dépôt et à la diffusion de documents scientifiques de niveau recherche, publiés ou non, émanant des établissements d’enseignement et de recherche français ou étrangers, des laboratoires publics ou privés.
Competition for attention in the information (overload)
age
S. Anderson, André de Palma
To cite this version:
S. Anderson, André de Palma. Competition for attention in the information (overload) age. RAND Journal of Economics, Wiley, 2012, 43 (1), pp.1-25. �10.1111/j.1756-2171.2011.00155.x�. �hal-00517721�
COMPETITION FOR ATTENTION IN THE INFORMATION
(OVERLOAD) AGE
Simon P. ANDERSON
André DE PALMA
March 2006, revised August 2010
Cahier n°
2010-23
ECOLE POLYTECHNIQUE
CENTRE NATIONAL DE LA RECHERCHE SCIENTIFIQUE
DEPARTEMENT D'ECONOMIE
Route de Saclay
91128 PALAISEAU CEDEX
(33) 1 69333033
http://www.economie.polytechnique.edu/
mailto:[email protected]
Competition for attention in the information (overload) age
Simon P. Anderson and André de Palma
∗March 2006, revised August 2010.
Abstract
Limited consumer attention limits product market competition: prices are stochastically lower the more attention is paid. Ads compete to be the lowest price in a sector but compete for attention with ads from other sectors: equilibrium ad shares follow a CES form. When a sector gets more proÞtable, its advertising expands: others lose ad market share. The “information hump” shows highest ad levels for intermediate attention levels. The Information Age takes off when the number of viable sectors grows, but total ad volume reaches an upper limit. Overall, advertising is excessive, though the allocation across sectors is optimal.
Jel Classification: D11, D60, L13, M37.
Keywords: economics of attention, information age, price dispersion, advertising distribution, con-sumer attention, information Þltering, size distribution of Þrms, CES, information congestion.
∗Simon P. Anderson: Department of Economics, University of Virginia, PO Box 400182, Charlottesville VA 22904-4128,
USA, [email protected]. André de Palma: Département Economie et Gestion, Ecole Normale Supérieure, 61 Ave du Président Wilson, 91235 FRANCE, and Ecole Polytechnique. [email protected]. The Þrst author gratefully acknowledges research funding from the NSF under grant SES-0752923 and from the Bankard Fund at the University of Virginia. The second author thanks Institut Universitaire de France. We thank the Autoridade da Concorrencia in Lisbon for its gracious hospitality, and the Portuguese-American Foundation for support. Comments from conference participants at EARIE 2007 (Valencia), Intertic-Milan (2008), and the Economics of Advertising Conference in Bad Homberg (2008), the CITE conference on Information and Innovation in Melbourne (2009) and seminar participants at the Sauder School (UBC), Stern School (NYU), National University of Singapore, James Madison University, Catholic University of Louvain (KUL), the Universities of Oklahoma, New South Wales, Copenhagen, and North Carolina (Chapel Hill) are gratefully acknowledged.
1
Introduction
According to a Wiki cite, perhaps the Þrst academic to articulate the concept of attention economics was Herbert Simon when he wrote
...in an information-rich world, the wealth of information means a dearth of something else: a scarcity of whatever it is that information consumes. What information consumes is rather obvious: it consumes the attention of its recipients. Hence a wealth of information creates a poverty of attention and a need to allocate that attention efficiently among the overabundance of information sources that might consume it. (Simon 1971, p. 40-41).
This is echoed in Lanham (2006), in the idea that we are drowning in information, but short of the attention to make sense of that information.1 Our interest in this paper is in turning around Simon’s point and looking how restricted attention affects the market information provided. In particular, we look at competition between Þrms providing information in the form of ads for their products. Facing limited attention, a Þrm might try and get away with a high price in the hope that its competitors’ ads about their lower prices has been crowded out from the information receiver’s attention span. This leads us to consider price dispersion in the face of endogenous congestion where information from each sector competes within the sector and with each other sector (even though sectors do not directly compete except for attention). We track several overall dimensions of the economics of information overload, advertising volume and clutter, and price dispersion (some results are in the Abstract).
The Information Age has seen the means of reaching people increase enormously, with a correspond-ing drop in the costs of docorrespond-ing so. In response, the amount of advertiscorrespond-ing has gone up drastically. Shenk (1997) states that the average American encountered 560 daily advertising messages in 1971, and over 3,000 per day by 1997.2 At the same time though, consumer retention rates for ads remains low, perhaps
1See Eppler and Mengis (2004) for a multi-disciplinary review of Information Overload.
2Current exposure levels are a matter of considerable debate and estimates range from 245 through 5000 exposures a day: see
e.g. http://www.amic.com/guru/results.asp?words=media+exposure&submit=Search&op=AND Skeptics point out that one would have to see an ad every 10 seconds for 8 hours to reach 3000 ads per day (although, in riposte, people are now spending nine hours a day with media!). However, web-sites can easily include 10 ads, and by one estimate we view 2000 web-sites a day. Likewise, commuting in a built-up area gives multiple bill-boards and signs per minute, not to mention the number of ads per page in newspapers.
one ad a day (the reader can ask himself or herself how many ads s/he remembers from yesterday!) Per-haps not surprisingly, the costs of reaching prospective consumers is low, and varies from $6 CPM (cost per thousand impressions) for Internet, through $18 for network TV and $26 for newspapers (for 2006, http://www.wikinvest.com/concept/Impact_of_Internet_Advertising),3 and, of course, spam email is very low cost. This picture of many messages relative to retention underscores our modeling approach.
The Information Age comes from several sources, primarily lower costs of sending information as more (and cheaper) channels now reach potential consumers. Traditional billboards and newspaper ads have been supplemented by Internet pop-ups, telemarketing, and product placements within TV programs (and on football players’ jerseys). Information costs have not been lowered uniformly across the board, though, and some sectors’ messages are more appropriately delivered by the new media. However, cheaper access to attention also means that rivals can access attention more cheaply too, intensifying in-sector competition. This effect renders competition more acute, lowering prices and beneÞting consumers. Scarcity of attention brings spillovers into other sectors, raising their prices and making it more likely interesting offers are missed. New product categories cause pricing churn for other advertised goods. A new product class depresses existing classes’ ads relatively (as a fraction of the total volume of messages), and it drives down weaker ones absolutely. Surprisingly, it may cause stronger sectors to increase in size because price competition is relaxed (prices are stochastically higher). Thus there are information complementarities across product classes.
The third effect we track is the attention span of consumers. Since both work and leisure time are spent increasingly on information-carrying activities,4 it is likely that consumer attention spans (the amount of ads that can be absorbed) have risen. This may induce more or less information transmission. When consumer attention is sparse, little information will be sent because there is not much chance of getting a look-in. Prices will be near monopoly levels because there is little chance of running across a rival. With a lot of
3Here are CPMs for 2002 (http://bpsoutdoor.com/article.php?article=how_effective):
Billboard (30-Sheet Poster), $2.05; Radio Ad (During Prime Drive Time), $8.61; Magazine (One page with 4 colors), $9.35; Television Commercial (30 Seconds on a Prime-Time Network), $17.78; Newspaper (1/3 of a page in black and white), $22.95.
4Indeed: "While television is still by far the dominant medium in terms of the time average Americans spend daily with
media at 240.9 minutes, the computer has emerged as the second most signiÞcant media device at about 120 minutes." from http://www.marketingvox.com/study_most_waking_hours_spent_with_media-020005/ who also say: "The average person spends about nine hours a day using some type of media, which is arguably in excess of anything we would have envisioned 10 years ago."
attention, not much information is sent because there is a good chance the consumer will get a better offer from the same sector. Prices will be low, so the beneÞt from sending a message is low. The middle ground - the “information hump” - is the fertile ground for messages, yielding a fair shot at making a sale at a reasonably high price, both by being seen but no rival from the same sector being found.
We also track the distribution of messages across sectors. With low levels of attention, highly proÞtable sectors will be most prominently represented. Increasing consumer attention brings Þrms into more com-petition with each other, which drives down sector proÞtability and serves to equalize opportunities across sectors while generally lowering mark-ups. Improved communication costs in speciÞc sectors lower prices there, though the extra crowding can relax competition (and raise prices) in other sectors.
The framework we use to model Þrms’ actions is adapted from Butters’ (1977) seminal work on informative advertising, which is remarkable for delivering a tractable and intuitive description of equilibrium price dispersion. Butters derives a density of advertised prices and sales prices; he proposes a monopolistic competition framework distinct from that of Chamberlin (1933). In both the Butters and Chamberlinian formulations of monopolistic competition, the competitive part comes from a free-entry zero proÞt condition that closes the model. The monopolist part in Chamberlin’s work comes from heterogeneity of the products sold by Þrms; in Butters it comes from the market power that Þrms have due to imperfect information that consumers do not know all Þrms’ prices.
We meld Butters’ approach with the advertising clutter approach formalized in Van Zandt (2005) and Anderson and de Palma (2009). Reception of messages is passive: the consumer does not search. This contrasts with Baye and Morgan (2001, 2002) who consider active consumers choosing whether to visit a price comparison site, and a “gatekeeper” Þrm charging access fees (with a single product sector which generates price dispersion from a mixed strategy equilibrium). Our context corresponds to passively getting messages from bulk mail, from the television, from billboards, etc. We focus on the interaction of multiple industries competing for individuals’ attention. While Butters generates price dispersion because each individual gets only a subset of the price messages (likewise Baye and Morgan, 2001, insofar as Þrms play with positive probability the option of not posting a price on the comparison site), we suppose that the individual misses
some of the messages sent. This reßects advertising clutter because an individual is bombarded by too many messages (in “junk” mail, billboards, television, and internet pop-ups) to pay full attention to all.
Several authors model both the consumer’s choice of how much attention to supply and the actions of Þrms vying for that attention by sending messages advertising their wares. In Falkinger (2008), consumers can choose how tight to make message Þlters but have a limited attention capacity. In Anderson and de Palma (2009), consumers have congested attention spans because they choose how many messages to examine. In Johnson (2010), consumers choose whether to examine all messages or to block them all.
A common feature of these models is that the consumer’s attention is a common property resource insofar as a message sender ignores the effects of its own message on other senders. This means there is a congestion externality, and a tax on messages can improve the allocation of resources.5 One concern with this conclusion is that direct business-stealing effects are closed down: message senders do not compete directly in the marketplace, they just compete for attention. A tax might a priori reduce price competition by reducing message volume, and so harm consumer welfare. We investigate this question by speciÞcally modeling competition within each of several sectors vying for consumer attention. The focus on Þrm competition necessitates simplifying the consumer side of the model: it is assumed here the consumer’s attention span is Þxed outside the model.
We Þrst characterize an equilibrium model with interaction both within and across sectors. Competition within a sector means that a lower price is more likely to be the lowest sector offer in the set of messages the consumer has screened. Nonetheless, higher-price senders can remain in equilibrium: there is a trade-off between sales probability and mark-up, so all can earn zero proÞts despite price dispersion. Competition among sectors (industries) comes from overall competition for consumer attention, and price dispersion in each sector depends on all other active sectors.
Surprisingly, the model endogenously generates an inverse IIA property for sector message fractions, and a CES form for the total number of messages sent. This bears an intriguing parallel to the CES utility functional form so often used to parameterize Chamberlinian models. Information congestion gives a new
5However, if the consumer’s attention is not congested, a tax may worsen the allocation insofar as message senders do not
rationale for the CES speciÞcation, but it is now coupled with price dispersion within multiple sectors. The model also generates a different welfare prescription from Butters (1977). While Butters’ model has the optimal and equilibrium level of information equal, we Þnd that the market allocation can be improved by taxing messages.6 This reßects the property that advertising is excessive, in contrast to most of the theoretical economics literature on the subject (see Bagwell, 2007, for a survey). Indeed, the standard result in the economics of informative advertising is that there is not enough advertising because Þrms do not capture the consumer surplus. This is the monopoly result (see Shapiro, 1981, for example). Under oligopoly, this is somewhat offset by business stealing: overadvertising arises in the Grossman and Shapiro (1983) model of informative advertising when the business stealing effect outweighs the consumer surplus one.7 Along similar lines, Stegeman (1991) shows that the market advertising is insufficient when the Butters model is amended to allow demand to have some elasticity: Þrms then tend to overprice without sufficient regard to the consumer surplus lost. In our context, over-advertising is quite natural as it dissipates rents.
The next Section describes the model and solution technique. Section 3 derives the CES form for total advertising and characterizes message volume by sector. Section 4 Þnds the advertising and sales price distributions by sector, and ties them into the earlier comparative static results. Section 5 sets out the normative properties, the neutrality result that no real changes ensue from transmission cost changes, the optimal allocation property, and the tax prescription to deal with over-advertising. Section 6 allows for distractions, which break the neutrality result, but retain the basic CES form. Section 7 concludes. The Appendix gives a quick reminder of the Butters (1977) model.
2
Message reception and transmission
2.1
Assumptions
There areΘ potential commercial sectors, indexed by θ = 1, ...,= Θ. Each active sector θ comprises a continuum= of Þrms of mass nθ.8 Each active Þrm sends just one message per consumer at a cost γθ(which can represent
6This Þnding reinforces the conclusion of Anderson and de Palma (2009) of the desirability of a tax on transmission in the
presence of congestion.
7Excessive advertising is also found in the controversial Dixit and Norman (1978) paper on persuasive advertising. 8In Section 3.4 we discuss how these sectors are endogenously determined.
the cost of a letter, or the cost of a billboard divided by the number of consumers reached).9 A message is an (ex-ante anonymous) advertisement containing the price at which a consumer can buy the product from the sending Þrm. Firms within each sector produce homogenous goods, and each sector therefore transmits nθmessages, for a total number of N =
X=
Θ
θ=1nθ messages (per consumer). The cost of producing the good advertised in the message is cθ (which is only incurred if the good is bought — think of a pizza for example): if the good must be produced beforehand regardless of whether the consumer buys, it suffices to set cθ = 0 and fold the production cost into the transmission cost, γθ.
Consumers are assumed to be identical. Messages could be sent to them by bulk mail, by email, or they could be posted on billboards, or on TV programs. However, reaching a consumer does not mean the message is registered. Each consumer has the same probability of registering a message (which means retaining the price offer). Since we assume constant returns to scale in production (constant marginal costs), we can treat the consumer as the unit of analysis and so we henceforth refer to a single consumer.10
The consumer registers a Þxed number of messages, φ ≥ 1, which are drawn at random from the N messages sent. This reßects limited information processing capability. In what follows we will assume that not all messages sent are registered (φ < N ) in order to capture advertising clutter / information congestion: this condition will hold in equilibrium under a mild assumption that ensures there are always some inactive potential sectors. After registering the φ messages, the consumer makes her purchase decisions. She chooses the lowest priced offer received from each sector (we argue below that the probability of ties is zero) and buys qθ units if that price is no larger than her reservation price for the sector, bθ.
The model can also be interpreted as competition with traditional physical stores as follows. A consumer can buy a product in a store, or else she can receive an ad enabling her to buy it cheaper. For advertisers, her reservation price, bθ, is the full price paid at the store. This full price will include her transportation costs, etc. The consumer may receive unsolicited ads from other sellers; to be entertained they must be priced below her reservation price. Assume that traditional stores are competitive so that the store price is
9Indeed, in equilibrium no sender would want to send a second message: to do so would give a negative proÞt given the
original message just made a zero proÞt under the free-entry assumption below.
at the sum of marginal production plus distribution costs. Other sellers may have lower distribution costs (think bricks vs. clicks), and they might deliver the product more cheaply. Assume that consumers do not search out sellers, but they do know about the store option.
Clearly, both types of goods can coexist — some products are available both in stores and through advertised offers; others are not available in stores. The model allows for this by judicious interpretation of the reservation price. In both cases, if an advertised offer is accepted at price p, the consumer surplus ascribed to the advertising sector is bθ− p.
Finally, we assume that the number of Þrms in each sector (and the density of messages in a sector at any advertised price) is determined by a zero-proÞt (free-entry) condition.
2.2
Solution technique
A Þrm’s expected demand (at any price it may charge) is the probability that its message is registered and it is the lowest price received from its sector. Its expected demand also must satisfy the zero proÞt condition for the price charged. We equate the probability of making a sale at a particular price from these two different angles to Þnd the relation between the price and the advertised price distribution.11
The highest price set by any Þrm, bθ, plays a key role because the only way the sender can avoid a loss at such a price is if it is the only message drawn from that sector. This ties down the number of messages nθsent from sector θ as a fraction of the total number of messages sent, N . Summing over sectors yields the total number sent, N , from which we can back out the number in each sector (the nθ’s). Armed with that statistic, we can recover the equilibrium price distribution in each sector and its support. This technique also enables us to determine endogenously the equilibrium number of active sectors.
More formally, an equilibrium to the model maps the primitives µ φ, ½ bθ, cθ, qθ, γθ; θ = 1, ..., = Θ ¾¶ into a set of non-negative sector message numbers³n1, ..., n=
Θ ´
, which sum to the total message volume N . A sector is active if and only if nθ> 0. For each active sector, the equilibrium speciÞes sector purchase probabilities,
1 1An alternative interpretation is to assume a Þnite number of Þrms per sector (see Baye and Morgan, 2001, for a related
analysis with a single sector and a gatekeeper). At a symmetric mixed strategy equilibrium conditional on the number of Þrms entering, all prices played must yield the same proÞt level. Appending a prior entry game implies that the equilibrium proÞt level is zero. We have preferred to follow the Butters description with a continuum of Þrms, not least because the choice probabilities we use are exact (see (1) and the discussion below).
Pθ, for the consumer, a price distribution within each sector, and corresponding choice probabilities for each product P (p, θ). We show that equilibrium is unique, with an endogenous cut-off between active and inactive sectors. We proceed in Lemma 2 by determining message volume by sector as a function of the total message volume, N (to be determined later). We then sum over active sectors in Proposition 5, to Þnd the N consistent with a given number of active sectors. Then, in Proposition 6 we identify the active sectors. Intermediate results describe properties of the solutions.
2.3
Message selection probability
We Þrst seek the probability that a particular message is the only one registered from a sector. Assume that nθ < N , so at least two sectors are active.12 Given there is a total mass of N messages, and a Þnite number of draws, the probability of drawing any given message on a given draw is N1. It is independent of which draw we consider, since the mass of messages left does not noticeably fall with the number of messages already drawn, so the probability of drawing the message is Nφ. By the same token, the mass of Þrms in sector θ is nθ< N , so that the probability of drawing a message from a competitor in the same sector is nNθ.
Hence the probability of avoiding all competitors in the same sector is the probability that no message from the sector is drawn on the other φ − 1 draws, namely¡1 − nθ
N ¢φ−1 . Then Pθ= φ N ³ 1 −nNθ´φ−1 (1)
is the probability that one (speciÞc) message from sector θ is registered,13 and no other message is registered from that sector.14
1 2As will be seen later, this will be true under mild conditions.
1 3We will later use the notation P (p, θ) to denote the probability of a sale at price p in sector θ: hence P
θ= P (bθ, θ), since
we shall show that a sale at the top price sent, bθ, only happens when the message is the only one drawn from the sector. 1 4This formula can also be derived as an approximation for a Þnite number of Þrms. Suppose that search is with replacement.
Then the probability of getting the message on the Þrst draw, and missing the rest of the sector on all subsequent draws is
1 N ³ 1 −nθ−1 N ´φ−1
. The probability of missing the whole sector on the Þrst k − 1 draws, drawing the message on the kthdraw
and missing the rest of the sector subsequently is¡1 −nθ N ¢k−1 1 N ³ 1 −nθ−1 N ´φ−k
. Thus the chance of getting the message alone
is the sum of these events, namely
k=φX k=1 ¡ 1 −nθ N ¢k−1 1 N ³ 1 −nθ−1 N ´φ−k
. This sum simpliÞes to³1 −nθ−1 N ´φ −¡1 −nθ N ¢φ . The
Þrst-order Taylor approximation to the Þrst term,³1 −nθ−1 N ´φ , is¡1 −nθ N ¢φ + 1 Nφ ¡ 1 −nθ N
¢φ−1, and so, to the Þrst-order,
Pθ is N1φ
¡ 1 −nθ
N
2.4
Price distribution
Recall that each Þrm chooses a single price, and there is a continuum of Þrms in each sector. There can be no equilibrium with all Þrms choosing the same price (and hence sharing the market): a common price above cθ+ γθ/qθ could be proÞtably undercut; any price cθ+ γθ/qθ or below would give negative proÞts.
We Þrst argue that the support of the equilibrium advertised price distribution (for any Þrm in active sector θ) is a compact interval£pθ, bθ
¤
with no atoms nor gaps, where the lower bound, pθ, is to be determined below. There are no atoms in the price distribution because if there were, any sender choosing the same price as a mass of other senders would raise proÞts by inÞnitesimally cutting its price. This would leave its mark-up essentially unchanged but raise sales discretely because it then beats all others at the purported mass point whenever two lowest price messages were the same. The interval has no gaps on the support because if there were, the lower price at a gap can be raised leaving the sales probability unchanged but increasing the mark-up. This same argument implies the support must go up to bθ: if it stopped short, the highest price Þrm could raise its price with no penalty on sales probability and increase its mark-up. Finally, the lower bound of the support must exceed cθ+ γθ/qθbecause at any lower price the transmission cost cannot be recouped. It must strictly exceed this bound because there is a positive probability that the message is not read (contrast Butters).
Lemma 1 Prices in industry θ are distributed on a compact support £pθ, bθ¤ where pθ > cθ+ γθ/qθ, and there are no atoms.
Let F (p, θ) denote the fraction of messages in sector θ sent at price p or below. (Then F¡pθ, θ¢= 0 and F (bθ, θ) = 1). A message at price p is successful as long as the price is the lowest one received: using the same logic as used to derive (1), the sales probability is
P (p, θ) =Nφ µ
1 − nθF (p, θ)N ¶φ−1
, (2)
where we simply note that nθF (p, θ) is the number of messages sent from the sector with a price below p. We proceed in Section 3 by determining aggregate numbers of messages per sector and total messages, and in Section 4 we derive the price distribution for each sector.
3
Advertising levels
3.1
Advertising shares by sector
We have just argued that some Þrms will send out an ad at a price equal to the reservation price bθ, and the probability of Þnding a second ad at the same price is zero. So consider an advertisement which is sent out with price bθ. Since Pθ (as given by (1)) is the probability this is the only ad found from sector θ, the equilibrium zero proÞt condition (which will tie down nθ) reads:
(bθ− cθ) qθPθ= γθ, (3) where we recall that qθ is the quantity of good θ demanded. DeÞne πθ by:
πθ=
(bθ− cθ) qθ γθ ,
which measures the economic performance (social surplus per $ transmission cost) of sector θ. It is necessary (but not sufficient) for an active sector that πθ > 1 because (bθ− cθ) qθ must exceed γθ in order for the sender to incur the cost of a message, given that messages are not read with certainty. Indeed, if πθ≤ Nφ, then even a single message sent from sector θ at the highest price would not be expected to cover its costs: i.e.,
(bθ− cθ) qθ φ
N ≤ γθ , (4)
where Nφ is the probability the message is registered.15 The zero proÞt condition (3) for the equilibrium probability the highest-priced sender in active sector θ makes a sale is then
Pθ= 1 πθ
. (5)
This probability depends only on the intrinsic economic performance index, πθ, of the sector.
Let ¯Θ ∈ (1,Θ] be the number of sectors for which π= θ > 1: this is the maximum number of active sectors.16 We rank these sectors such that π
θ is decreasing in the index θ, i.e. from highest to lowest
1 5As we shall see below, this is also the condition for the lowest price in the price support to be below b
θ. (For the lowest
price, γθ equals the mark-up times the probability of being drawn. The latter is φ/N since a sale is guaranteed for the lowest price in the sector, conditional on being drawn. Since the critical value of the low price is bθ, the condition follows immediately.) 1 6The model is degenerate if there is a single sector. From (9), there are zero messages. This could rather be interpreted
as a single Þrm setting the monopoly price in one message: any other entrant rationally anticipates negative proÞt if it enters (messages from rivals are necessarily read, so price would go to marginal cost if there is more than one Þrm, so losses ensue). Section 6, by introducing an "outside" option, allows for a non-degenerate outcome with one active sector.
economic performance. For simplicity (except when we do the symmetric analysis) we will assume that all the πθ’s are different across sectors. In the sequel, we will Þnd the endogenous number of active sectors.17
Lemma 2 Let N > φ. All sectors θ such that πθ > Nφ are active sectors, and the rest are inactive. The relative sector sizes are
nθ N = max ( 1 − µ N φ 1 πθ ¶ 1 φ−1 , 0 ) , θ = 1, ..., ¯Θ. (6)
Proof. Equating the probability derived from the zero-proÞt condition, (5), with the probability that she gets no other message from the sector, (1), implies Pθ = Nφ
¡ 1 − nθ
N
¢φ−1 = 1
πθ, and so determines the ad
market shares by rewriting this as (6). Hence, sector θ sends a positive number of messages if and only if πθ> Nφ.
We defer considering the overall comparative static properties of equilibrium because N is still to be determined in (6). However, we can use the expression to compare across sectors of different economic characteristics within an equilibrium. Sectors with larger economic performance send more messages because they are more attractive to senders. That is, nθ > nθ0 if and only if πθ > πθ0. We proceed by further
characterizing the relation that sector sizes must satisfy at any equilibrium.
3.2
The inverse IIA property
Sector message sizes exhibit a type of IIA property (Independence of Irrelevant Alternatives) in the sense that the ratio of ad market shares of two sectors depends only on their proÞtabilities for a given N . However, contrary to the usual IIA property (Þrst pointed out by Debreu (1960) in his critique of Luce’s (1959) Choice Axiom), which stipulates that the ratio of market shares does not change with the number and type of other options, this ratio does change here since N changes with the proÞtability of a third sector (see also (9) below). Thus, the standard IIA property does not hold for this model. However, a related IIA property holds, with respect to the market shares of all competing sectors. We call this the inverse IIA property,
1 7As we show below, there will be at least 2 sectors under the mild condition that π 2> 1.
which pertains to the ratios m−θ ≡N−nθ
N . From (6), the inverse IIA property is: 18 m−θ m−θ0 = µ πθ0 πθ ¶ 1 φ−1 for all θ = 1, ..., ˆΘ, (7)
where ˆΘ is the number of active sectors. This is a property of invariance of the ratio of all rivals’ advertising levels as the appeal of any rival (outside the pair) changes. Analogously to the way the IIA property implies the Logit model (see Luce, 1959), the inverse IIA property implies an inverse Logit formulation:
Proposition 3 At any equilibrium with ˆΘ active sectors, the non-θ shares have a logit form: m−θ ³ ˆ Θ − 1´ = π −1 φ−1 θ XΘˆ θ0=1π −1 φ−1 θ0 ≡ Ψθ, θ = 1, ..., ˆΘ, (8) where the LHS is the non-share of sector θ over the total non-share of all sectors.
Proof. Inverting (7), m−θ0 m−θ = µ πθ πθ0 ¶ 1 φ−1 .
Summing over θ0 gives (Θmˆ−1)
−θ = (πθ) 1 φ−1X ˆ Θ θ0=1π − 1 φ−1
θ0 , and the result follows directly by inversion.
The value of ˆΘ is endogenous here (and is determined below). Only the active sectors are counted: inactive sectors πθ are excluded from the summation. The same caveat applies below.
As πθ increases, the RHS of (8) falls: as the proÞtability of a sector rises, it produces proportionately more ads while the others produce relatively less. Even a mature sector may enjoy a higher proÞtability if γθfalls, perhaps because of the advent of a new medium which might complement advertising its goods and get larger ad market shares which come at the expense of the others.19 Indeed, as shown in sections 3.4 and 3.5, weak sectors might be pushed out of the market entirely. The effects of raising φ on the distribution of messages by sector are fundamentally those of the logit formulation (see for example Anderson, de Palma, and Thisse (1992)), though the derivation of that form above differs from the usual roots.
1 8Therefore nθ nθ0 =
1−(Θˆ−1)Ψθ
1−(Θˆ−1)Ψθ0, which indicates that IIA does not hold, where Ψθis deÞned below in (8).
Proposition 4 For ˆΘ > 1 constant, as φ rises, the ad market share of the most proÞtable sector decreases with φ, and the share of the least proÞtable sector increases. As φ falls to 1, almost all messages are sent by the most proÞtable sector.
Proof. To show the Þrst point, Þx ˆΘ > 1. The relation in (8) gives the fraction of messages in sector θ as nθ N = 1 − ³ ˆ Θ − 1´Ψθ. Note that dπ −1 φ−1 θ dφ = − π −1 φ−1 θ (φ−1)2lnπ1 θ, so that dΨθ dφ s = − ln 1 πθ +X ˆ Θ θ0=1Ψθ0ln 1 πθ0 ,
(where the symbol= denotes that the derivative has the sign of the expression), or (sinces X ˆ Θ θ0=1Ψθ0 = 1), dΨθ dφ s =X ˆ Θ θ0=1Ψθ0 µ ln 1 πθ0 − ln 1 πθ ¶ .
Hence, the share decreases with φ for the most proÞtable sector (1), and increases for the least proÞtable one ( ˆΘ). Finally, note from (8) that
Ψ1= π −1 φ−1 1 XΘˆ θ=1π −1 φ−1 θ = 1 1 +X ˆ Θ θ=2 ³ π1 πθ ´ 1 φ−1 . Hence, lim
φ↓1Ψ1= 0: almost all messages are sent from sector 1.
If the attention span is very limited (φ close to 1), virtually all messages are from the highest proÞt sector, 1, because this yields the greatest proÞt conditional on making “the” hit. The messages sent tend to quote the monopoly price because there is almost no chance of being undercut by another message. Monopoly prices are most attractive for the sector with the highest monopoly proÞt. The number of messages sent from this sector tends to π1.20 This corresponds to pure dissipation of the monopoly proÞt in sector 1. It is possible that there is a huge number of such messages if π1 is very high: even if π2 is high too (but strictly below π1), it attracts virtually no messages. This case arises if the transmission cost for one sector tends to zero while the other sectors retain positive costs: the sector crowds out all other sectors. This is clearly wasteful because all other sectors are closed out, while the affected sector just dissipates all the rents in excessive message transmission.21
2 0This can be seen as follows. If N messages are sent, all from sector 1, and one is drawn, then monopoly pricing implies the
proÞt from a message is b1−c1
N q1− γ1. The zero proÞt condition implies the number of messages is π1.
2 1As we shall see below, if all sector transmission costs fall proportionately, the range of prices stays the same in each sector:
At the other extreme, when the attention span is extensive, any price above the lowest in the sector will almost certainly be beaten. All sectors are very competitive, so sectors become equally (un)attractive: a lot of price competition means very few messages per sector.
When ˆΘ > 2, the advertising shares of the intermediate sectors are not necessarily monotonic in the level of consumer attention, φ. To see this, consider 3 sectors. Sectors 1 and 2 have very high proÞts, with 2 slightly less than 1, while sector 3 has very low proÞt. When the attention span is slightly above one message, sector 1 is active while 2 is virtually silent. For middling values of φ, both 1 and 2 have almost half the market each. For φ large, all have around one third shares. Sector 2’s share is not monotonic here.
Expression (8) in turn gives rise to a familiar functional form.
3.3
Aggregate advertising
The next step is to determine the equilibrium message volume, N . Expressions (6) and (8) give two different expressions for m−i. Equating them yields:22
Proposition 5 The equilibrium total message size given ˆΘ > 1 active sectors and N > φ takes a CES form:
N = φ³Θ − 1ˆ ´ φ−1µXΘˆ θ=1π −1 φ−1 θ ¶−(φ−1) . (9)
Thus N is increasing in each proÞtability, πθ, and homogenous of degree one in the sector proÞtabilities. Adding another viable sector raises N .
Proof. The properties are straightforward except for the last one. Consider introducing a “barely viable”
sector s with ns= 0: by (6), the corresponding performance of such a new sector s is πs= N/φ. We now verify that introducing this barely viable sector s leaves (9) unchanged:
N φ = ³ ˆ Θ − 1´φ−1 µXΘˆ θ0=1π −1 φ−1 θ0 ¶φ−1 = ³ ˆ Θ´φ−1 µXΘˆ θ0=1π −1 φ−1 θ0 + ³ N φ ´−1 φ−1¶ φ−1.
Thence, by continuity, introducing a strictly viable sector, with πs> N/φ, will cause N to increase even if some sectors exit.
The CES form has well-known properties.23 Raising the proÞtability of any sector causes the total volume of messages to rise because the extra clamor causes a larger total without a fully compensating backlash from the other sectors.
3.4
Sector viability
When sectors are asymmetric, some may be precluded by the strength of those in the market. We determine the equilibrium set of active sectors. Recall that ¯Θ denotes the number of sectors for which πθ > 1 (any sector with πθ≤ 1 is not viable, and so can be eliminated from the discussion). Furthermore, deÞne ˆΘ by
πΘ+1ˆ ≤ ³ ˆ Θ − 1´φ−1µX ˆ Θ θ0=1π −1 φ−1 θ0 ¶−(φ−1) < πΘˆ (10)
and assume that ˆΘ ∈¡1, ¯Θ¢. As we show, this means that there will be some sectors (all those with index above ˆΘ) which do not advertise, and the existence of such sectors implies that the congestion condition N > φ necessarily holds.24
Proposition 6 Assume that ˆΘ ∈¡1, ¯Θ¢as deÞned by (10). Then there exists a unique equilibrium: sectors 1, ..., ˆΘ are active, and the total volume of messages is given by (9).
Proof. From Lemma 2, a sector is active in equilibrium if πθ > NφΘˆ, where NΘˆ denotes the number of
messages for ˆΘ active sectors as given by (9). Next, we show there is a unique cut-off between active and inactive sectors. The condition for a sector to be active is πθ> NφΘˆ. Given the ranking of sectors, the LHS
decreases in the marginal sector, ˆΘ, while we showed in Proposition 5 that the RHS increases as sectors are added. Thus there is a unique solution for ˆΘ, and it is given by (10), where the term in the middle is NΘˆ
φ
(see (9)). Notice that necessarily the congestion condition holds: NΘˆ > φ since NΘˆ
φ > πΘ+1ˆ > 1 by (10). It remains to show that the equilibrium follows the ranking: there cannot be an equilibrium with some sector θ excluded while some sector θ0 > θ is included. If there were, then the proÞt from sending a single message from sector θ (at its monopoly price, bθ) is πθNφ. However, messages sent from sector θ0 return a
2 3For example, it is maximal at symmetry (under the constraint that the sum of the inverse π
θ’s is constant).
2 4If all potential sectors are active, we get into a corner solution where the condition N > φ does not necessarily hold. If
the model returns a solution with N < φ, it contradicts the congested formula used in setting up the choice probabilities. The existence of some latent sectors is enough to avoid that.
proÞt of at most πθ0φ
N. Hence, since πθ> πθ0, a message from sector θ would supplant one from sector θ0, so the starting point cannot be an equilibrium.25
Viability constraints imply that equilibrium congestion across sectors may close down a sector when another sector becomes more attractive. Similarly, a newly entering or improved sector raises the congestion on the incumbents. This we illustrate next.
3.5
Raising a sector’s proÞtability
Proposition 5 shows that an increase in a sector’s proÞtability will increase the total number of messages sent (even if this causes exit of other sectors). Since the other sectors all send smaller shares of this larger total, the affected sector must send more messages. We now determine what happens to the other sectors. Recall nθ N = 1 − ³ N φ 1 πθ ´ 1 φ−1
from (6). Hence for an unaffected sector (where πθhas not changed) it is clear that the sector share goes down. However, it is possible the number of messages it transmits goes up, as we now show (that is, we show that dnθ
dπθ0 can be positive). Indeed,
dnθ
dπθ0 =
dnθ
dN dN
dπθ0 has the sign of
dnθ
dN since dN
dπθ0 > 0. From (6), we have the derivative
26 dnθ dN = 1 − φ φ − 1 µ N φ 1 πθ ¶ 1 φ−1 .
Substituting Nφ from (9) and deÞning χθ= π
−1 φ−1
θ and ¯χ as the average value of χθ, gives dnθ dN = 1 − φ φ − 1 ³ ˆ Θ − 1´ ˆ Θ χθ ¯ χ , (11)
From a symmetric starting point (where χθ= ¯χ for all θ ≤ ˆΘ), dndNθ has the sign of 1 − φ φ−1
(Θˆ−1) ˆ
Θ , which is negative if and only if φ > ˆΘ. If though φ < ˆΘ, a marginally higher attractivity in one sector causes message numbers to rise in all sectors. This result is broadly consistent with the rising part of the information hump (low φ) and for the early "take-off" part of the Information Age evolution depicted in Figure 1 below. There is a relatively large increase in the number of messages sent as long as the amount of competition is small.
In the asymmetric case, (11) indicates that there is a cut-off value of χθ for which dnθ
dN is negative for higher χθ and positive for lower χθ. Since πθ is inversely related to χθ, this means that larger sectors are
2 5If there are several sectors with the same proÞtability, then they are either all active or all inactive. 2 6From which we see that higher π
more likely to see an increase in the number of messages sent. A summary Proposition:
Proposition 7 The equilibrium total message volume increases as any sector becomes more proÞtable. The improved sector sends more messages both relatively and absolutely. All other sectors diminish in relative importance, but sufficiently proÞtable sectors may increase in absolute size.
It may seem surprising that some sectors could increase in size despite more competition and even though sectors are linked only through the negative effects of congestion (there are no demand complementarities, for example). The favored sector increases in size. This has two contradictory effects on other sectors. First, any given message is less likely to be found. However, any rival’s message is also less likely to be found. The Þrst effect impacts all industries equally. The second favors the larger industries because each Þrm has more competition, so these industries will attract new entry.
3.6
The Information Age
The key driver of the information age is lower communication costs. The homogeneity property of the CES function for N in Proposition 5 implies that total message volume doubles if all communication costs are halved.27 This is one obvious cause of a surfeit of information: spam email is an everyday manifestation of the problem. Any such cost improvement is offset by the rise in messages sent, so all improvements are completely dissipated.28 As we show in the next Section, price dispersion also remains unaltered, and this leads to the neutrality result given in Proposition 14 that welfare remains unchanged.
However, even though a uniform cost reduction does not cause new sectors to enter, improved commu-nication may help some sectors more than others, insofar as some are better suited to having their ads embedded in the new media. This leads us to now consider a larger set of viable sectors. The exercise can be thought of as cost reductions in hitherto excluded sectors (or, indeed, as new product classes, like PCs and software, coming to market).
2 7No further sectors will enter, since doubling of the existing message volume will preclude them, even if their transmission
costs halve. Indeed, as we just noted, a sector is viable if and only if πs> N/φ.
2 8This is reminiscent of Zahavi’s Law in transportation, according to which average travel times have remained constant over
We consider the symmetric case before returning in the next Section to the asymmetric one. For the symmetric analysis, we will assume that all ¯Θ potential sectors are active.29 Then, with π
θ = π > 1 for all θ = 1, ..., ¯Θ, the expression (from (9)) for the total number of messages, N , reduces to30
N = φµ ¯Θ − 1¯ Θ
¶φ−1
π. (12)
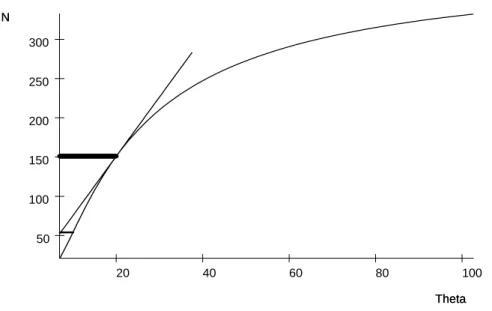
Having more sectors, ¯Θ, raises the total number of messages. The number N is a logistic function of the number of sectors: it is Þrst convex (for ¯Θ < φ/2 ), and then concave, for ¯Θ > φ/2. If we were to view the number of (new) sectors as arriving at a constant rate, then this means the amount of information would accelerate at Þrst (the take-off of the Information Age) before tapering off, reminiscent of the Bass (1969) diffusion of innovation model. Indeed, the amount of information has an asymptote of ¯N = φπ, which is the bound to the amount of information the system can sustain.31
100 80 60 40 20 300 250 200 150 100 50 Theta N Theta N
Figure 1. Total messages as a function of the number of active sectors.
The average number of messages per sector, nθ= N/ ¯Θ, is increasing in ¯Θ if and only if φ > ¯Θ, so it is
2 9We then need to verify that the condition N > φ is veriÞed with ¯Θsectors: this is duly met in the Figures below. 3 0Symmetric CES models are commonly deployed in the economics of product differentiation. Note here that the sector
viability constraint, π > N/φ, is automatically satisÞed.
3 1At the limit, monopoly prices, b, are set in each sector, returning π when the message is chosen. The probability of being
eventually decreasing (for ¯Θ large enough). The initial increase is explained by the idea that more sectors mean less competition, so higher prices and more incentive to send messages. The logistic function in (12) is sketched in Figure 1, for π = 20 and φ = 20 (the function asymptotes to N = 400, the maximal value of N/ ¯Θ is attained at ¯Θ = 20, and the inßection point is at ¯Θ = 10). The other comparative static property of N , with respect to φ, is described next.
3.7
The information overßow hump
The advent of new media means more consumer time is now spent with ad-carrying activities, like surÞng the internet or sending email. This likely implies an increase in the overall consumer attention span as more hours are spent on media. The thumbnail capture in the model of this increased span is to raise φ.
From the symmetric analysis (see (12)), we can see that the information level, N , is decreasing in the attention span, φ if and only if φ > ˆφ ≡ µ 1
ln Θ¯
(Θ−1¯ )
¶, and so N is necessarily decreasing for φ > ¯Θ (since ¯
Θ ln Θ¯
(Θ¯−1) > 1: the LHS is decreasing in ¯Θ and goes to 1 as ¯Θ goes to inÞnity). Likewise, N
φ is falling in φ, and therefore N increases more slowly than φ.
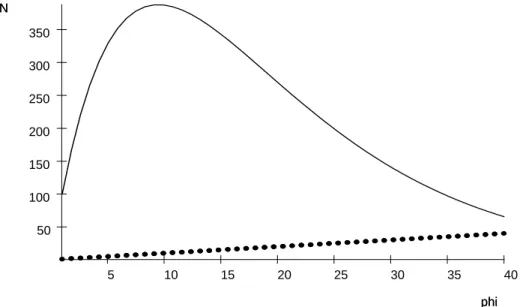
40 35 30 25 20 15 10 5 350 300 250 200 150 100 50 phi N phi N
Figure 2 plots the relation of N as a function of φ for π = 100 and ¯Θ = 10 (hence N = 100φ¡109¢φ−1 attains its maximum at ˆφ = 1
(ln10 9)
, which is slightly less than 10). The dashed line is the line φ = N . Figure 2 shows the quasi-concave function, i.e., Þrst increasing, then decreasing with the attention span, φ. This we term the information overßow hump. However, the number of messages only increases for low φ < ˆφ (< ¯Θ). More attention has two conßicting consequences. First, it raises the probability a message from the sector is seen, which raises proÞtability, and hence the number of messages sent, ceteris paribus. But it also has the effect of increasing price competition (the price distribution shifts down), as it is more likely a lower price will be found in the sector. This reduces proÞtability and leads to a smaller number of Þrms (messages). For low φ, the price competition effect is weak in that it is quite unlikely that another message received will be from the same sector as one already received: extra messages will most likely come from unrepresented sectors. With high reception rates, the price effect dominates. In a nutshell, for low φ and given ¯Θ, more examination leads to more messages sent as undiscovered sectors become more likely to be found. For higher φ, more examination means more hits in the same sector, which increases price competition and so decreases sector activity.
We now turn to the price distribution, whose properties underpin the economics of the results so far.
4
Equilibrium price dispersion
The equilibrium sales probability corresponding to a particular price p in sector θ can be determined inde-pendently of the other sectors. However, we need to bring in the other sectors to determine which prices are actually used in equilibrium. The equilibrium sales probability for a message announcing price p in sector θ, P (p, θ), is given simply from the zero-proÞt condition as
P (p, θ) = γθ (p − cθ) qθ = (bθ− cθ) (p − cθ) 1 πθ , (13)
where P (p, θ) ∈ (0, 1) for all p in the interior of the support of the equilibrium price distribution. The above expression reduces to the zero-proÞt condition (5), when p = bθ, and using the notation P (bθ, θ) = Pθ.
the equilibrium advertised price distribution. This is done by equating P (p, θ) in the zero proÞt condition (13) to the expression given in (2) for the probability of there being no lower price drawn, which gives
(bθ− cθ) (p − cθ) 1 πθ =φ N µ 1 − nθF (p, θ)N ¶φ−1 , (14) where nθ/N is given by (6).
Proposition 8 The equilibrium advertised price density in sector θ is decreasing and convex on £pθ, bθ¤, with (truncated) Pareto distribution
F (p, θ) =1 − ³ N φπθ ´ 1 φ−1³b θ−cθ p−cθ ´ 1 φ−1 1 −³ N φπθ ´ 1 φ−1 , (15)
where N is given by (9) and pθ is given by
pθ= cθ+ µ N φ ¶ γθ qθ . (16)
Proof. The equilibrium advertised price distribution is given from the relation (14) as
F (p, θ) =N nθ Ã 1 − µ N φπθ bθ− cθ p − cθ ¶ 1 φ−1! . Recalling that nθ N = 1 − ³ N φπθ ´ 1 φ−1
from (6), we can write (15). It is readily checked that F (bθ, θ) = 1. Since F¡pθ, θ
¢
= 0, the lowest price in sector θ is determined by (14) as: ¡ pθ− cθ ¢ = (bθ− cθ) πθ N φ. (17)
Then (16) follows immediately. The corresponding density, f (p, θ) is strictly positive on£pθ, bθ¤, where it is decreasing and convex (as shown by differentiation of (15)).
The distribution for sector θ depends on the other sectors through N , giving a simple general equilibrium effect. For given N , we can derive the price distributions by sector independently; since consumer surpluses by sector are additively separable and consumers are not budget constrained.
The intuition for the lowest price in the support is straightforward. A message sent at this lowest price always beats all the other messages from the sector. Hence the sales probability is just the probability that
it is read at all, which is simply Nφ since it has φ shots from a pool of N messages. Equating this probability times the mark-up to the cost of sending the message gives (16).
As in Butters (1977), lower prices are advertised more heavily. In the Butters model (with qθ= 1), the corresponding lowest price, p, would be simply cθ+γθ, because such a price just covers the cost of production plus sending the message. In the Butters version, the lowest price must always get a sale because there is no information congestion, and no possibility that the message remains unread. In contrast, here the lowest price in any sector does not always make a sale. Information overßow pushes up the lowest price in the support, which is needed to compensate for the likelihood that the message may not be received.
The simplest measure of price dispersion is the breadth of the support of the equilibrium prices. This is bθ− pθ, where pθ= cθ+ ³ N φ ´γ θ
qθ. Ceteris paribus, dispersion is smaller the greater is
³ N φ ´γ θ qθ (recall though
that N depends on all the parameters of the model, apart from the inactive sectors’ proÞtabilities). Hence, for example, a larger γθ decreases N and so increases dispersion in all unaffected sectors, while decreasing dispersion in the affected sector (see (9)).
Changes within the sector affect the support as well as the aggregate message volume N . A sector can become inviable if it faces tough competition from other sectors and/or it is quite unattractive itself. Viability can be expressed as the condition that the price support does not collapse. That is pθ< bθ. From (17)), this means that N
φ < πθ; this is the same condition from (6) for nθ> 0 in equilibrium.
Finally, suppose instead that sector θ is associated to a conditional downward-sloping demand and the consumer will buy qθ(p) units at the lowest price, p, held. Assume that demand begets a quasi-concave proÞt function with a maximizing price ˆpθ. The corresponding proÞt conditional on being the only message registered in the sector) is (ˆpθ− cθ) qθ(ˆpθ), and so the proÞt per dollar transmission cost is ˆπθ= ( ˆpθ−cθγ)qθ( ˆpθ)
θ ,
which therefore plays exactly the same role as does πθabove. In equilibrium, no Þrm will charge more than ˆpθ because proÞts can be increased by charging ˆpθ, and the parallel analysis to that above yields the equilibrium price distribution as F (p, θ) =1 − ³ N φˆπθ ´ 1 φ−1³( ˆpθ−cθ)qθ( ˆpθ) (p−cθ)qθ(p) ´ 1 φ−1 1 −³ N φˆπθ ´ 1 φ−1
(cf. (15)), where N is given by (9) with ˆπθ replacing πθ. Now pθ is given implicitly by ¡ pθ− cθ ¢ qθ ¡ pθ ¢ = ³ N φ ´
γθ (cf. (16)), which has a unique price solution for pθ< ˆpθ under the assumption that proÞt is strictly quasi-concave.32 Compared to the distribution for rectangular demand (setting ˆp
θ = bθ and treating qθ as invariant), the distribution is now stochastically lower (FOSD) because lower prices are relatively more attractive due to the demand expansion effect.
4.1
Advertised price dispersion and sector proÞtability
Greater sector proÞtability impacts the affected sector by increasing the volume of messages sent (Proposition 5). As we now see (Proposition 9), this increases price competition, and so stochastically lowers prices. However, this market mechanism spills over into the other sectors. Elsewhere, price competition is reduced because sector messages are crowded out in relative terms. Nonetheless, the number of messages sent in other sectors can actually rise (see Proposition 7) because the reduced price competition can raise proÞts per Þrm (which then must be reduced by further entry).
Proposition 9 An increase in the proÞtability, πθ, of one sector decreases prices (and increases the support of price dispersion) in that sector and increases prices (and decreases the support of price dispersion) in the other sectors, in the sense of First-Order Stochastic Dominance. A proportional increase in the attractivity of all sectors leaves the price distribution unchanged.
Proof. Recall F (p, θ) =1− ³ N φπθ ´ 1 φ−1³bθ−cθ p−cθ ´ 1 φ−1 1−³ N φπθ ´ 1 φ−1 by (15). Hence dF dπθ0 (for θ
0 6= θ) has the opposite sign from dπdN
θ0, which is positive, as already established. Hence F (p, θ) decreases in πθ
0. However, dF
dπθ has the
opposite sign, since N
πθ is decreasing in πθ (from (9)). Hence, F (p, θ) increases in πθ. If πθ increases, pθ
falls; if πθ0 increases, N rises so that pθrises (see (16)). If all sectors increase proportionately in attractivity,
N
πθ is unchanged (by the homogeneity in Proposition 5) and so F (p, θ) is unchanged.
This means that advertised prices (and price dispersion) can be negatively correlated across sectors. If one sector becomes more desirable (in the sense of higher surplus), prices fall in that sector as competition intensiÞes. But the additional messages crowd out messages in other sectors, and this relaxes competition
in those other sectors. On the other hand, across-the-board changes affecting all sectors can leave prices the same. This property underlies the result in the next Section that proportionately lower message transmission cost savings are dissipated fully: equivalently, a (proportional) tax might be raised without deadweight loss. The sales price distribution differs from the advertised price distribution because lower prices are more likely to get sales, and also because even the lowest advertised price does not always make a sale. It is derived in the on-line version of the paper. We now follow through with the analysis of the symmetric case.
4.2
Dispersion and symmetric sectors
In the symmetric case, N is given by (12) as N = φ³Θ¯Θ−1¯ ´φ−1
π, and so the cumulative distribution function for advertised prices (15) becomes
F (p, θ) = ¯Θ Ã 1 − Θ − 1¯Θ¯ µ b − c p − c ¶ 1 φ−1! , for p ∈£p, b¤, (18) where p = c +³Θ¯Θ−1¯ ´φ−1
(b − c) (by (16)). Hence, as φ rises, the lower bound p falls, and so intra-sector competition rises in this respect. A tighter characterization is quite immediate.
Proposition 10 Assume sectors are symmetric. A higher attention span, φ, lowers prices in the sense of First-Order Stochastic Dominance.
Proof. From (18), F (p, θ, φ2) > F (p, θ, φ1) as ³pb−c−c´ 1 φ2−1 <³pb−c−c´ 1 φ1−1 , or φ1< φ2.
Lower prices as attention goes up underpins the earlier comparative static results of the information hump. Even though the total message volume is not monotone (see Figure 2), the price effect is. For low φ, prices are high and few messages are sent: for high φ, prices are low and few messages are sent. In the Þrst case, because few messages are registered, Þrms may as well set high prices and chance the low probability of another message from the same sector. In the second case, price competition intensiÞes because there is a strong likelihood another message from the same sector will be read.
Along similar lines, it is readily shown that higher ¯Θ stochastically increases prices (with more price dispersion). This is because the limited attention is more divided. We now turn to the normative analysis.
5
Normative properties
We Þrst undertake a welfare analysis of the performance of the market equilibrium and emphasis the excess of information. In the following two sub-sections we consider cost changes and transmission taxes - even cost increases without any corresponding revenue collection can improve the allocation. These results stress the extent of the market failure, and also help indicate which sectors are particularly responsible.
One strong property of the Butters (1977) model is that the market allocation is optimal. However, this property crucially depends on his assumption that each message hits somewhere.33 In our set-up, there is rent dissipation and socially wasteful duplication of messages.34 Competition for attention imposes a congestion externality which leads to excessive advertising: this feature is perhaps more in tune (rather than optimality or under-advertising) with one’s personal reaction to advertising clutter.
The welfare function is given by summing over sectors the total sector surplus times the probability a sale is made in the sector, and then subtracting the message costs. DeÞne
Q (nθ, N ) = 1 − ³
1 −nNθ´φ. (19)
as the probability that there is at least one hit in sector θ: the probability that each of the nθ messages is missed on each of the φ draws. Notice that
∂Q (nθ, N ) ∂nθ = Pθ
. (20)
Thus the increased chance of discovering a sector when an extra message is sent is the probability that the extra message is registered when no other message from the sector has registered. We can write the welfare function (for any values nθ≥ 0, θ = 1, ..., ¯Θ) as35
W (n1, ..., nΘ¯; N ) = XΘ¯ θ=1[(bθ− cθ) qθQ (nθ, N ) − γθnθ] , (21) where N =X ¯ Θ
θ=1nθ. This form (breaking out N as a separate argument) is convenient for what follows.
3 3It also depends on the rectangular demand assumption. Stegeman (1991) shows that there is insufficient advertising if
demand slopes down, because Þrms do not internalize the consumer surplus of lower prices.
3 4Clearly the Þrst best optimum comprises one message per sector, and the active sectors should be the φ for which the proÞt
per message, (bθ− cθ) qθ− γθ, is highest. If γ is the same for all θ, these are the Þrst φ ones, those for which πθis highest. 3 5When it comes later to including tax revenues, all we will need to assume is that they have some social value.
Lemma 11 The social beneÞt from an extra message in sector θ is equal to dW dnθ = ∂W ∂nθ +∂W ∂N = ((bθ− cθ) qθPθ− γθ) + ∂W ∂N, (22)
where the RHS terms are private sector proÞt and congestion externality respectively.
Proof. From (21), we have dW dnθ = ∂W ∂nθ + ∂W ∂N dN dnθ: noting that dN
dnθ = 1 (message anonymity) gives the Þrst
inequality in (22). Now, from (21) and (19), and then using (20), we have that ∂W ∂nθ = (bθ− cθ) qθ∂Q (nθ , N ) ∂nθ − γθ (23) = (bθ− cθ) qθPθ− γθ.
This expression is the proÞt of a Þrm setting the top price in active sector θ ≤ ˆΘ given nθ messages emanating from the sector (see (5)). Since this is zero in equilibrium, the remaining term, ∂W/∂N , is naturally interpreted as the congestion externality from active sectors.
The next result shows the externality is negative, and quantiÞes it at the equilibrium allocation.
Proposition 12 The total number of messages transmitted is excessive in equilibrium, and the (negative) congestion externality is measured as the average transmission cost,N1e
XΘˆ θ=1γθn
e θ. Proof. Recall that dWdn
θ = ∂W ∂nθ + ∂W ∂N, and ∂W (ne,Ne)
∂nθ = 0 (where the superscript e denotes that the variable
is evaluated at its equilibrium value) by the zero proÞt condition of equilibrium for all active θ. Then we have that dW (ndne,Ne)
θ =
∂W (ne,Ne)
∂N . From (21), we have for active sectors ∂W (n, N ) ∂N = XΘˆ θ=1(bθ− cθ) qθ dQ (nθ, N ) dN (24) = −X ˆ Θ θ=1(bθ− cθ) qθ nθ NPθ. Using the zero proÞt condition (3) we get
∂W (ne, Ne) ∂N = − 1 Ne XΘˆ θ=1γθn e θ< 0, (25)
This result underscores the main problem with the market equilibrium: although (as we show next) the allocation is (second-best) optimal across sectors given the total equilibrium message volume, the overall volume is excessive. This is seen clearly from what we just argued in Lemma 11, namely that ∂W (n∂ne,Ne)
θ = 0
(i.e., evaluated at the equilibrium), while dW (ndNe,Ne) < 0. However, while optimal and private incentives
are aligned in terms of allocation, the private choice ignores the message crowding externality on all other sectors, which is measured by ∂W (n∂Ne,Ne) < 0. This implies excessive messages are sent. The social cost of an
extra message, as per (25), is the average sending cost. This relation holds because if extra messages have to be sent, they should be allocated across sectors in proportion to the sector representation in the population: one more message therefore costs the average transmission cost.
Proposition 13 The equilibrium allocation of messages across sectors is socially optimal given the number of messages transmitted at the equilibrium.
This is proved in the Appendix. The key feature that generates the optimality result is (20): the marginal change in the choice probability holding Þxed the total number of messages, ∂Q(nθ,N )
∂nθ , which is crucial to
the social problem, is equal to the probability Pθ that the highest-priced Þrm makes a sale in the private problem. The equivalence holds because the probability that an extra message is examined and nothing else was examined from the sector reßects both its social contribution and the private incentive for sending it.
5.1
Increasing transmission costs uniformly
We Þrst establish a strong neutrality result for across-the-board cost changes. Uniform transmission cost decreases raise advertising levels (and industry sizes) proportionately, and so are a strong driver for increased information, but they do not affect the real outcome. Indeed, the economics of lower transmission rates are the economics of rent dissipation. Halving the cost in each sector simply doubles the number of ads sent per sector. The intuition comes from the fact that both N and nθ are homogeneous of degree minus one. The sector choice probabilities (nθ/N ) are then homogeneous of degree zero in the percentage cost increase. The advertised price distribution, F (p, θ) is then also independent of such cost changes. This also explains why no sectors enter in the face of a common cost increase: halving transmission costs also halves the chance the
highest priced sender makes a sale (since it faces twice the competition). Because optimal taxes are positive, we phrase the next proposition in terms of a cost rise.
Proposition 14 A uniform percentage increase in transmission costs leaves welfare unchanged. Hence a uniform percentage tax raises welfare. Price dispersion remains unchanged, as does the fraction of messages sent per sector, while the number of messages per sector (and therefore the total) goes down in proportion to the percentage cost increase. The number of active sectors remains the same.
Proof. A common percentage transmission cost increase, s, raises each γθ to γθ(1 + s) and so reduces each πθ proportionately to 1+sπθ . From (9), such a common cost increase means N (s) (1 + s) is constant,
where N (s) is the equilibrium aggregate message volume under common cost increase s. Equivalently, the original N (0) falls to N (s) = N (0)1+s. Recall nθ
N = 1 − ³ 1 φ N πθ ´ 1 φ−1
from (6). Since the ratio πN
θ (on the RHS) is
unaltered by the cost increase, then so is the rationθ
N (on the LHS). Likewise, since N
πθ is unchanged, the price
support and the cumulative price distribution stay the same. Recall that a sector is active iff (bθ− cθ) qθNφ > γθ. With a common cost increase s, the condition becomes (bθ− cθ) qθN (s)φ > γθ(1 + s). However, since N (s) (1 + s) = N (0), the condition remains unaltered. Consumer welfare therefore is unchanged, proÞts remain zero, and so welfare remains unchanged. The tax result is an immediate corollary.
If tax revenues were discarded, a tax would have no effect on welfare. Any tax not lost in the collection is therefore a social gain, and gets transferred purely from costs. Since proÞts are zero, consumers are just as well off since they face the same situation (same distributions, but fewer overall messages). The tax is therefore raised without deadweight loss.
Proposition 13 showed that the base allocation of messages was optimal for the equilibrium message vol-ume, Ne. By Proposition 14, an equal percentage tax on transmission scales back messages proportionately. However, unless transmission costs are the same across sectors, the scaled-back message levels induced by a non-negligible tax are not optimal for the new (given) total volume of messages. Indeed, the partial welfare derivative (23) is ∂W (n,N )∂n
θ = (bθ− cθ) qθPθ− γθ, which expression still holds in the presence of a tax which