DOI 10.1007/s10237-014-0568-6
O R I G I NA L PA P E R
Modeling microdamage behavior of cortical bone
Finn Donaldson · Davide Ruffoni · Philipp Schneider ·Alina Levchuk · Alexander Zwahlen · Pankaj Pankaj · Ralph Müller
Received: 2 May 2013 / Accepted: 25 February 2014 / Published online: 13 March 2014 © Springer-Verlag Berlin Heidelberg 2014
Abstract Bone is a complex material which exhibits sev-eral hierarchical levels of structural organization. At the submicron-scale, the local tissue porosity gives rise to dis-continuities in the bone matrix which have been shown to influence damage behavior. Computational tools to model the damage behavior of bone at different length scales are mostly based on finite element (FE) analysis, with a range of algorithms developed for this purpose. Although the local mechanical behavior of bone tissue is influenced by microstructural features such as bone canals and osteocyte lacunae, they are often not considered in FE damage models due to the high computational cost required to simulate across several length scales, i.e., from the loads applied at the organ level down to the stresses and strains around bone canals and osteocyte lacunae. Hence, the aim of the current study was twofold: First, a multilevel FE framework was developed to
F. Donaldson· P. Pankaj
School of Engineering, The University of Edinburgh, Edinburgh, UK
F. Donaldson· P. Pankaj
Edinburgh Orthopaedic Engineering Centre, The University of Edinburgh, Edinburgh, UK
F. Donaldson· D. Ruffoni (
B
)· P. Schneider · A. Levchuk · A. Zwahlen· R. MüllerInstitute for Biomechanics, ETH Zurich, Wolfgang-Pauli-Str. 10, 8093 Zurich, Switzerland
e-mail: druffoni@ulg.ac.be; druffoni@ethz.ch
P. Schneider
Faculty of Engineering and the Environment, University of Southampton, Southampton, UK
Present Address: D. Ruffoni
Department of Aerospace and Mechanical Engineering, University of Liege, Liege, Belgium
compute, starting from the loads applied at the whole bone scale, the local mechanical forces acting at the micrometer and submicrometer level. Second, three simple microdam-age simulation procedures based on element removal were developed and applied to bone samples at the submicrometer-scale, where cortical microporosity is included. The present microdamage algorithm produced a qualitatively analogous behavior to previous experimental tests based on stepwise mechanical compression combined with in situ synchrotron radiation computed tomography. Our results demonstrate the feasibility of simulating microdamage at a physiologically relevant scale using an image-based meshing technique and multilevel FE analysis; this allows relating microdamage behavior to intracortical bone microstructure.
Keywords Multilevel finite element analysis·
Bone microstructure· Cortical porosity · Microdamage · Bone quality
1 Introduction
Bone is a complex material which exhibits several hierarchi-cal levels of structural organization (Fratzl and Weinkamer 2007). During loading, stresses and strains are continuously transmitted from the organ level down to the nanoscale and can cause microdamage and failure. Microdamage, when not removed by a mechanically regulated remodeling process (Schulte et al. 2013), accumulates and can be a possible cause for bone fractures (Taylor et al. 2007). Consequently, the ability of bone to sustain microdamage and to resist fracture involves various mechanisms at different length scales ( Peter-lik et al. 2006;Koester et al. 2008;Ritchie et al. 2009; Zim-mermann et al. 2011). At the submicrometer-scale, the local tissue porosity gives rise to discontinuities in the cortical bone
matrix, which can be classified into the canal network, the osteocyte lacunar system and the canalicular system (Cooper et al. 2003;Bousson et al. 2004;Jones et al. 2004;Schneider et al. 2007,2010a,b,2011), which we would like to refer to as bone microstructure here. These void spaces have been shown to influence the mechanical behavior of cortical bone (McCalden et al. 1993; Yeni et al. 1997;Bell et al. 1999;
Jordan et al. 2000;Schneider et al. 2007,2013), up to the organ level. For instance, it has been reported that prediction of biomechanical parameters in murine femurs can signifi-cantly be improved by including the morphology of the canal network, in addition to whole bone morphometric measures (Schneider et al. 2007;Voide et al. 2008; Schneider et al. 2013). From a fracture mechanics point of view, microstruc-tural discontinuities may influence cracking behavior in dif-ferent ways: They can be considered as defects, which act as stress concentrators (Nicolella et al. 2006;Bonivtch et al. 2007;Christen et al. 2012), or as possible constraints, which slow down crack growth (O’Brien et al. 2003;Taylor et al. 2007;Christen et al. 2012).
Important insights on microdamage in cortical and tra-becular bone have been obtained with various experimen-tal techniques including confocal laser scanning microscopy (CLSM), scanning electron microscopy (SEM), transmission electron microscopy (TEM), Raman microscopy, microcom-puted tomography (micro-CT) and synchrotron radiation-based computed tomography (SR CT) (Sahar et al. 2005). Specifically, the connection between the canal network, the osteocyte lacunar system and bone microdamage has recently been investigated in murine cortical bone by com-bining stepwise mechanical compression with in situ SR CT (Voide et al. 2009;Voide et al. 2011;Schneider et al. 2013). With this novel three-dimensional (3D) approach, micro-damage initiation was observed exclusively at (intracortical) canals and at bone surfaces (endosteum and periosteum), whereas osteocyte lacunae played a major role in direct-ing the crack path through the cortical bone (Voide et al. 2011).
Computational tools to model the mechanical behavior of bone at different length scales are mostly based on finite ele-ment (FE) analysis (Ruffoni and van Lenthe 2010). Specif-ically, considering the complex structure of bone, detailed microstructural FE (micro-FE) models have been developed to represent whole bones including the intricate geometries of both the trabecular network and the cortical compartment (Eswaran et al. 2006; Donaldson et al. 2008, 2011; Ruf-foni et al. 2012,2013). Micro-FE models are often based on voxel meshes where image voxels (e.g., from micro-CT scans) are directly converted into hexahedral elements of identical shape and size. Having meshes with identical ele-ments simplifies the solving strategies and allows the solu-tion of huge models (e.g., up to 50 million elements) within a reasonable computing time and with medium-sized
com-putational resources (Christen et al. 2010). For these rea-sons, micro-FE has been extensively used to predict the lin-ear elastic properties of trabecular bone samples (Keaveny et al. 2001) as well as to estimate apparent strength and post-yield behavior (Niebur et al. 2000;Verhulp et al. 2008a,b). Failure is typically modeled in micro-FE by changing the material properties of the bone elements according to a fail-ure/yield criterion. This change in material properties has been based on plasticity (Donaldson et al. 2008; Verhulp et al. 2008a; Pankaj and Donaldson 2013) and nonlinear elasticity (Niebur et al. 2000). However, the intrinsic mate-rial properties of bone depend on the complex organiza-tion of its basic constituents, namely a collagenous matrix with embedded platelike mineral crystals (Jager and Fratzl 2000). Thus, the characteristics of an appropriate failure cri-terion for bone tissue remain a topic of debate. Indeed, other authors have used a discrete damaging model consisting of a two-stage damaging rule to describe the sequential fail-ure of the mineral component and of the collagenous matrix (Hardisty et al. 2013). Additionally, the local mechanical behavior within bone tissue is influenced by microstructural features such as bone canals and osteocyte lacunae as demon-strated by several experimental (Voide et al. 2011;Schneider et al. 2013) as well as computational approaches (Bonivtch et al. 2007;Deligianni and Apostolopoulos 2008;Christen et al. 2012). Nevertheless, such features are often not con-sidered in micro-FE models due to the high computational cost required to simulate across several length scales, i.e., from the loads applied to the organ level (cm) down to the stresses and strains around bone canals and osteocyte lacunae (µm).
Hence, the aim of the current study was twofold: First, a multilevel FE framework was developed to compute, start-ing from the loads applied at the whole bone scale, the local mechanical forces acting at the micrometer and submicrom-eter level of bone tissue. Second, three simple microdam-age simulation procedures based on element removal were developed and applied to bone samples at the submicrometer-scale, where cortical microporosity is included. The resulting microdamage behavior was then compared with the damage behavior observed experimentally (Voide et al. 2009;Voide et al. 2011).
2 Materials and methods
Micro-FE models within this work were generated from micro-CT and SR CT data of notched murine femurs utilized in previous microdamage studies (Schneider et al. 2010a,b;
Christen et al. 2012), combining microcompression and SR CT imaging. All animal procedures were approved by local authorities.
(b)
(c) (d)
(a)
126 µm
Microdamage models
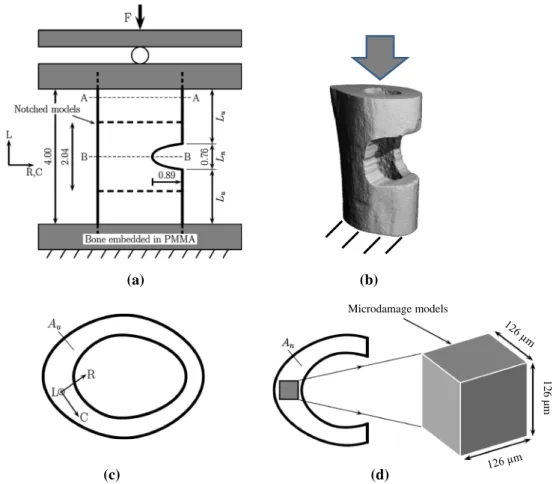
Fig. 1 Regions modeled in notched and microdamage FE analyses. a
Experimental setup (dimensions in mm) for the image-guided micro-compression study. b A typical notched sample (C3H) solved with micro-FE (element size 6µm) to compute the stress/strain state to be
used in the microdamage analysis. c Un-notched transverse section of the cortex with orientations and d transverse section of a notched region showing the extracted region of interest (ROI) for microdamage analy-ses
2.1 Organ level: notched FE models
In the first step of our multilevel analysis, micro-FE models based on micro-CT data of full mid-diaphyseal femoral cross-sections of C57BL/6J (B6) and C3H/HeJ (C3H) mice (n= 6 each) at an isotropic nominal resolution of 6µm were gener-ated to identify the stress/strain state within the microdamage region, which served as boundary conditions to simulate the damage process. The images contained the full bone cross-section and extended for a minimum of 340 slices or 2.04 mm in the longitudinal bone axis when centered upon the notch (Fig.1). The models were virtually rotated into consistent ori-entations such that the medial–lateral and anterior–posterior axis lay in the transverse plane and the longitudinal axis lay in the longitudinal direction of the femur (Fig.1a–c). The FE models describing the mechanical behavior in the notched area, which were used to provide input boundary conditions to the subsequent microdamage FE models, only included information about bone shape and geometry to be unbiased by local tissue porosity (e.g., large canals). Therefore, we
chose an intermediate resolution of 6µm voxel size and mor-phological image processing operations including erosion and dilation to prevent the stress/strain field computed in the notched models being distorted by local cortical microstruc-tures. The voxel-based datasets were directly converted into 8-node cubic finite elements (Rietbergen et al. 1995). Meshes typically included 5.5 million and 8.5 million elements for B6 and C3H, respectively. A constant, isotropic Young’s modu-lus of 20 GPa and a Poisson’s ratio of 0.3 were assigned to all solid elements. A longitudinal displacement corresponding to 1 % apparent compressive strain was applied to the top surface of the models, and the bottom surface was restrained against longitudinal displacements. Nodes belongings to the top and bottom surfaces were free to translate, and rigid body motions were prevented by constraining the displacement at one node. Models were solved in less than 120 s on 100 CPUs using the fully parallel finite element solver ParFE (Arbenz et al. 2008) running on a Cray XT5 System at the Swiss National Supercomputing Centre (CSCS, Lugano, Switzer-land), and principal stresses and strains were analyzed.
2.2 Tissue level: microdamage FE models
In the second step, submicrometer FE models derived from SR CT data taken at the opposite side of the notch (where microdamage was expected to initiate due to the reduced cross-section) within the femoral mid-diaphysis were created for the development of the algorithms to simulate microdam-age behavior (Fig.1d). The initial geometry of microdamage models was taken from the unloaded, reference SR CT scans at an isotropic nominal resolution of 0.74 µm and with a field of view (FOV) of 760× 760 µm, which was reduced to a circular FOV of 530µm diameter to remove cupping artifacts due to the local tomographic setup (Faridani et al. 1997;Schneider et al. 2009). The resulting images of the C3H samples did not contain entirely the periosteum and/or endos-teum. It was therefore necessary to select a region of interest (ROI) from within the cortex (Fig.1d), which allowed for direct comparison between different specimens. Although B6 samples did contain the periosteum and endosteum as their cortical thickness is much smaller compared to C3H, the ROI for B6 specimens was restricted to within the cortex similar to the C3H samples for the purpose of consistency between the different mouse strains. Accordingly, B6 cortical thickness provided an upper limit for a common ROI size, which was fixed at 170× 170 × 170 voxels (126 × 126 × 126 µm). ROI orientation was chosen such that the cube faces were aligned with the radial, circumferential and longitudinal directions (Fig.1c, d). The location of the ROI in the circumferential and radial directions was not standardized, but selected at regions containing canals, which were observed in previous work (Schneider et al. 2010a,b;Christen et al. 2012) to play a significant role in damage formation. A constant, isotropic Young’s modulus of 20 GPa and Poisson’s ratio of 0.3 were used. Microdamage FE models consisted of approximately 36 million degrees of freedom and were again solved with ParFE at CSCS (Lugano, Switzerland) on 100 CPUs. Solu-tion time was approximately 60 s per iteraSolu-tion, which resulted in an overall computing time of approximately 8 h for each sample. Boundary conditions were assigned to the micro-damage FE models based on the results of the organ-level notched FE models, which were examined for regions of peak loading (see Sect.3.1, Fig.4) to identify sites at great-est risk of damage. Specifically, the strain tensor was decom-posed according to its radial, circumferential and longitudinal components (Fig.1), and the average strain state occurring at the locations of the greatest circumferential strains along the length of the samples was used as boundary condition for the microdamage FE models.
2.3 Microdamage algorithms
Three different microdamage algorithms with increasing level of complexity were developed. In each approach,
micro-damage was represented by deleting elements in the FE meshes and deleted elements were selected when the maxi-mum principal stress exceeded a first tolerance, Tol− σMAX
in conjunction with varying additional criteria adopted for the three microdamage algorithms. At the beginning of all micro-damage analyses, nominal boundary displacements were applied, equal to 1 % of the total 3D displacements identified in the notched FE analyses. A key concept of the microdam-age algorithms is the strain factor (SF) defined as the frac-tion of the total strain (computed at the organ level), which is applied in an iteration step at the tissue level. SF can be interpreted as the driving force to propagate microdamage; in fact, it describes the amount of strain which has to be applied at the boundary of the microdamage FE model to trigger and propagate microdamage. The initial value for SF was delib-erately set to only 1 % of highest strain state computed at the organ level, simply to avoid having a large fraction of elements above the threshold for damaging. To drive micro-damage propagation SF was then iteratively increased (in small steps corresponding to 1 % of the total strain) if dam-age did not occur in a preceding iteration. Specifically, SF increased if the number of voxels deleted fell below a second tolerance, Tol-vox, which was fixed at 5 voxels per iteration in all analyses. A nonzero value for Tol-vox was used to reduce the number of iterations in which very little damage prop-agation occurred and hence to speed up the simulations. A detailed flowchart of the microdamage simulation algorithm is reported in Fig.2.
2.3.1 Stress limit algorithm
This simple algorithm (called “stress limit”,σlim) deleted all
elements violating a tensile stress criterionσ1> Tol−σMAX,
whereσ1is the maximum principal stress and Tol− σMAXis
a tolerance set to a nominal value of 100 MPa in the present study, approximating the tissue-level yield strength of cor-tical bone (Bayraktar et al. 2004). Theσlim algorithm did
not discriminate between elements near and far from already occurring microdamage regions and this way, produced unre-alistically wide removal zones (Fig.3a).
2.3.2 Component labeling algorithm
To address the issue of wide removal zones arising from the stress limit algorithm, a second approach termed as “com-ponent labeling” (or CL) algorithm was developed. This approach introduced a further constraint in element deletion: First, all elements violatingσ1> Tol−σMAXwere clustered,
and subsequently, only one element (with the highest value of σ1in each cluster) from each set of clustered elements was
removed when violating σ1 > Tol − σMAX. This
success-fully restricted damage formation to those elements neigh-boring a microdamage region but resulted in substantial mesh
Initialize Tol-σMAX=100 MPa
Tol-vox = 5 εref={ε
R, εC, εL},
εapp=0.01 εref
Create FE mesh and boundary conditions Run FE analysis Create FE output Image ofσ1 Identify elements to be removed Remove identified voxels Is number removed < Tol-vox ?
Loop for all increments
End
εapp= εapp+ 0.01 εref
Check all elements in 26 neighbourhood Void No void y n y n neighbour neighbours elements Calculate DDV relative to void element Add element in 26 neighbourhood most aligned with DDV to delete list σ1>Tol-σMAX?
Stress gradient algorithm
Loop for all elements
Fig. 2 Detailed flowchart of the microdamage simulation workflow and, specifically, of the stress gradient algorithm
dependency; microdamage would typically follow mesh lines and was not able to divert toward stress concentrations (Fig.3b).
2.3.3 Stress gradient algorithm
The final algorithm (and that employed in the remainder of this study) was designed to overcome the above mesh depen-dency and to enable microdamage to follow stress concen-trations (Fig.3c). This was called the “stress gradient” (or
σG) algorithm, and it is detailed in Fig.2. There, the original
condition (σ1> Tol−σMAX) was used to locate the
neighbor-hood of deleted elements, but the specific deleted elements were identified such that microdamage would progress in the direction of highest maximum principal stress gradient within a cubic region surrounding the microdamage loca-tion. This region was referred to as the “tip region” and was employed with an edge length (Ltr) of 21 voxels or 16µm
in this study, which corresponded to half of the lacunar spac-ing (Lc.Sp) for the pooled B6 and C3H specimens (data not
Fig. 3 Comparison of damage
propagation with the three microdamage algorithms. a Very wide damage was formed with σlimas elements were deleted in
multiple directions. b Thin damage regions were observed using CL, but they were restricted to propagation along mesh lines. c Thin damage regions were also formed with theσGalgorithm; damage propagation followed the stress gradient and was not restrained by the mesh lim
σ
CL Gσ
Compression (a) (b) (c) -20 0 20 40 60 80 100Max Principal Stress (MPa)
shown here). Each tip region was centered on a void element (referred to as the “region center”) in the 26-neighborhood of an element withσ1 > Tol − σMAX. This prevented the
formation of wide microdamage fronts as observed with the σlim algorithm since only those elements directly adjacent
to an existing pore or removal region could be deleted in any iteration. In the next step, the direction of microdamage was determined. This was achieved by calculating a dele-tion direcdele-tion vector (DDV) from the values ofσ1 in the
tip region. The DDV was calculated by weighting the unit vector pointing at each element within a tip region by its value ofσ1within the corresponding element. The element in
the 26-neighborhood of a region center, which corresponded most closely to the determined DDV, was deleted. During the implementation of theσG algorithm, it was found that
the calculated DDVs were aligned with the raised stresses between the pores, and hence directed microdamage propa-gation between them.
2.4 Cortical porosity, microdamage accumulation and tissue elasticity
We investigated the effect of canal and lacunar morphometry (Schneider et al. 2007;Voide et al. 2011) on SF required for microdamage initiation and propagation by linear regression analysis. Microdamage initiation was assumed when more than 5 elements were removed in a single iteration, whereas microdamage propagation occurred when the number of ele-ments removed increased monotonically at a constant SF. Morphometric measures of the canal network included canal volume density, computed as canal volume (Ca.V) per cor-tical volume (Ct.V), canal unit volume, obtained by divid-ing Ca.V by the number of canals (N.Ca), canal thickness (Ca.Th) and canal spacing (Ca.Sp). The lacunar indices con-sidered were lacuna number density (N.Lc/Ct.V) and lacuna volume density (Lc.V/Ct.V), where N.Lc and Lc.V indi-cate the total number and volume of lacunae, respectively.
Moreover, the morphology of the microdamage was char-acterized at different SF in terms of microdamage vol-ume density (Md.V/Ct.V) and microdamage thickness (Md.Th).
During microdamage progression, a degradation of the local tissue mechanical properties takes place. In order to characterize the impact of microdamage accumulation on the effective elastic properties, we computed the bulk modulus of the microdamage FE models (Fig.1d) for increasing levels of microdamage present in cortical bone. The bulk modulus was calculated by applying a hydrostatic compression on the virtual bone cubes and by dividing the corresponding pres-sure change by the imposed volume change, normalized by the bone volume of the undeformed samples. The in silico mechanical analysis was performed as described in Sect.2.2
with specific boundary conditions: Considering three per-pendicular faces meeting at a vertex of the bone cube, each face was displaced in a direction normal to it by 1 % of the side length, and the nodes of the face were free to move on the plane perpendicular to the direction of compression. Each B6 and C3H cortical bone sample was characterized 11 times during microdamage development (including the initial and the final state) for a total of 144 micro-FE simu-lations.
3 Results
3.1 Organ level: notched FE models
The notched FE models were examined for sites at greatest risk of damage by locating peak stresses in tension. Con-tours of maximum principal stress on a typical transverse slice of a B6 and a C3H specimen including the notch are
shown in Fig.4. B6 samples contained concentrations of ten-sile stress at both the periosteum and endosteum (Fig.4a), whereas the thicker C3H samples showed tensile stress con-centrations at the endosteum only (Fig.4b). However, in both strains, the largest tensile components were always observed at the endosteum for all specimens. Figure5illustrates the variation in the maximum radial (εR), circumferential (εC)
and longitudinal (εL) strain components with longitudinal
position (i.e., along the L-axis in Fig. 1c) for a B6 and a C3H sample. Values were extracted at points directly oppo-site to the notch at the endosteum (i.e., see Fig.1d and region A in Fig.4), where large cracks were observed experimen-tally (Voide et al. 2009;Voide et al. 2011) in the longitudinal direction. The oscillations of strain components observed in Fig.5 were caused by small variations in the surface cur-vature of the femurs. Since the maximum tensile stress and strain components were greatest in the endosteum opposite to the notch, the strain state at this site was used to provide boundary conditions in the subsequent microdamage simula-tions. Considering B6 and C3H separately, the average over all samples of radial, circumferential and longitudinal strain components at the location of the greatest circumferential strain (i.e., maximum tensile strain opposite to the notch) were computed (Fig.6). It can be seen that little difference (statistically nonsignificant, p> 0.1) was observed between the local maximum strain in B6 and C3H samples. More-over, as the standard deviations within each group were fairly small, we applied one boundary displacement to the micro-damage models representative for B6 and C3H; this allowed ruling out the influence on microdamage coming from differ-ent boundary conditions. A tensile strain was observed in the radial direction, which was approximately equal to that pre-dicted by the Poisson’s effect. In the circumferential direc-tion, strain greater than the Poisson’s effect was observed;
C3H
(a) (b)
A A
1mm B6
Fig. 4 Maximum principal stress contours in a B6 and b C3H specimens. Tensile stress concentrations were observed at both the periosteum and
Longit. position (voxels) 0 100 200 300 Strai n ( %) -1.4 -1.2 -1.0 -0.8 -0.6 -0.4 -0.2 0.0 0.2 0.4 0.6
Longit. position (voxels)
0 100 200 300 Strai n ( %) -1.4 -1.2 -1.0 -0.8 -0.6 -0.4 -0.2 0.0 0.2 0.4 0.6 B6 C3H (a) (b) εR εC εL
Fig. 5 Variation in strain with longitudinal position (ascending
num-bers indicate proximal to distal direction) in micro-FE models for a B6 and b C3H samples. The gray area represents the longitudinal region located opposite to the notch (see Figs.1d,4). Large tensile strains were
induced by the presence of the notch in the adjacent region (opposite to it) at the same longitudinal location along the bone in the circumferen-tial direction (C), but not in the radial (R) or longitudinal (L) direction
Radial Circumf. Longit.
Strai n ( %) -1.2 -1.0 -0.8 -0.6 -0.4 -0.2 0.0 0.2 0.4 0.6
Radial Circumf. Longit.
Strai n ( %) -1.2 -1.0 -0.8 -0.6 -0.4 -0.2 0.0 0.2 0.4 0.6 B6 C3H (a) (b)
Fig. 6 Maximum strains opposite notch locations in a B6 and b C3H samples. Whiskers represent one standard deviation. The maximum strain
values observed opposite to the notch were approximately equal (less than one standard deviation apart) for B6 and C3H mice
this indicated that sample geometry promoted microdam-age formation in this direction. The boundary displacements applied to the microdamage FE models were 0.24, 0.47 and
−1.03% strains in the radial, circumferential and longitudi-nal directions (see Fig. 1 and note that the negative strain indicates compression).
(a) (b) (c) (d) -20 0 20 40 60 80 100 Max P rincipal Stress (M P a)
Fig. 7 Damage propagation with theσGalgorithm of a sample. Note the diversion of the damage propagating from the canal on the left to the first lacuna, before proceeding toward to the next lacuna below and to
the right. The damage path was directly influenced by the stress raising effect of the nearby features (canals and osteocyte lacunae)
3.2 Tissue level: microdamage FE models
The direction of damage propagation was influenced by the presence of stress raisers, such as canals or osteocyte lacunae. Four different increments of damage propagation are illus-trated in Fig.7for a C3H sample. In Fig.7a, b, stress concen-tration can be seen between the left canal and a neighboring lacuna (see arrows). In Fig.7c, d, the damage propagated in the direction of this stress concentration. Figure8 illus-trates 3D damage propagation in B6 and C3H samples by color-coding the deleted elements by the increment number in which they were deleted (i.e., blue elements were deleted in early increments and red elements in later increments). The 3D location and orientation of damage can be seen in the ren-derings. All models showed quite a brittle behavior, because the majority of damage formation occurred suddenly, at a single applied displacement. Damage always initiated at the edges of canals and never at the lacunae. The general direc-tion of damage propagadirec-tion was orthogonal to the maximum applied tensile strain, and it was influenced by the lacunae (this corresponds to the longitudinal direction as viewed in
the slice images of Figs.7,8). Damage was diverted toward canals and lacunae which lay near to damaged regions. Exam-ples of this behavior can be seen in Fig.8a, c, d. In other cases, such as Fig.8b, pores were either not close enough to damage regions or not large enough to increase stresses sufficiently to divert damage paths toward them. Shielding can be seen in Fig.8e; following initiation, the damage rapidly propagated until the level with the canal below, at which point propa-gation ceased until the SF increased sufficiently for further propagation (shown in red) to occur. Similar behavior was observed in Fig.8f: The damage to the lower right of the image reduced the stress to the right of the middle canal and prevented further propagation of the damage on the left.
With our gradient-based microdamage algorithm, mean SF for damage initiation in B6 and C3H samples was 28.5 % (±9.5 %) and 24.16% (±5.2 %), respectively, where ± indi-cates standard deviation for the strain groups (n = 6 speci-mens each). Considering damage propagation, mean SF was
40.8 % (±5.7 %) and 36.8% (±6.7 %) for B6 and C3H,
respectively. For both the initiation and the propagation of damage, SF was higher for B6 samples than for C3H
sam-Fig. 8 Damage progression in B6 (a–c) and C3H (d–f) samples
obtained using theσG algorithm. The upper rows contain renderings of the largest preexisting pores (canals and osteocyte lacunae) with color-coded voxels representing damaging. Color-coding was defined such that element colors correspond to the iteration in which they were
deleted. While damage initiation could occur at any iteration step (and therefore any color), propagation can be identified by those elements with a “warmer” color. The lower rows contain transverse slices corre-sponding to the samples in the upper rows
ples, i.e., B6 samples may display a higher “resistance” to damage than C3H samples; however, those differences were less than one standard deviation and not statistically significant ( p = 0.485 for initiation and p = 0.293 for propagation). The microdamage accumulation during the deformation process for B6 and C3H samples is reported in Fig.9. Both microdamage volume density (Md.V/Ct.V) and microdamage thickness (Md.Th) started to increase at a lower SF for C3H than for B6. In general, for identi-cal SF, more microdamage was observed in C3H compared
to B6 samples. The maximum value of Md.Th was about 1.5 µm for both groups and was reached at SF smaller than the ones required for damage propagation, indicating that damage mainly propagated by increasing in length at a constant thickness. Although a direct quantitative com-parison between experimental and simulated microdamage is challenging, mainly because the ROI had fairly differ-ent size and the local strain levels were also dissimilar, in both experiments and simulations C3H bones seem to accu-mulate more microdamage than B6 bones even if, in both
Simulated microdamage accumulation SF [%] 10 20 30 40 Md .V/Ct .V [ %] 0.0 0.2 0.4 0.6 0.8 1.0 0.0 0.4 0.8 1.2 1.6 B6 Md.V/Ct.V C3H Md.V/Ct.V B6 Md.Th C3H Md.Th Md.Th [µm]
Fig. 9 Simulated microdamage accumulation in B6 and C3H samples.
The microdamage parameters damage volume density (Md.V/Ct.V) and microdamage thickness (Md.Th) are plotted against the strain factor (SF) applied to the samples to promote bone microdamaging. Both damage parameters started to increase at a lower SF for C3H than for B6
cases, the differences were not statistically significant (see Table1).
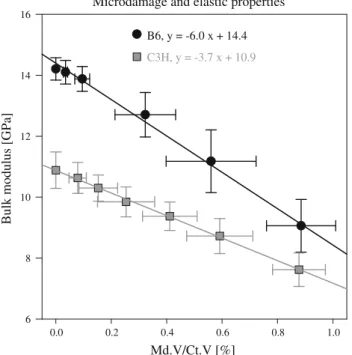
The effect of microstructure was investigated by linear regression of SF against morphometric measures of canals and lacunae (Table 2). In general, indices characterizing canals were better predictors of SF than those relating to lacunae: For initiation, the best correlation was obtained when considering canal spacing (R = 0.555, p = 0.061), whereas for propagation, SF was best predicted by canal unit volume (R= 0.498, p = 0.100). The effective elastic prop-erties of the microdamage FE models degraded during micro-damage progression (Fig.10). Specifically, the bulk modulus decreased linearly (R2 = 0.99) with increasing microdam-age volume density and the decrease was faster for B6 than C3H. Microdamage reduced the initial bulk modulus of about 37 % for B6 and 29 % for C3H.
4 Discussion
The aim of the present study was to develop a multi-level voxel-based FE framework for understanding the link between damage behavior and cortical bone microporosity, namely the canal network and the osteocyte lacunar system, in 3D and on realistic bone structures at the submicrometer-scale. In our work, the term “multilevel” does not refer to the numerical nature of the FE solver but rather to the hierarchi-cal structure of bone as we have included information starting from the organ level (i.e., cm) down to the subtissue level (i.e., µm). In bone mechanics, the words “multilevel” (Deligianni
and Apostolopoulos 2008) or “multiscale” (Cristofolini et al. 2008) have been already used to underline the importance of integrating information coming from various length scales.
First, it was necessary to identify realistic boundary con-ditions for the microdamage simulations, which took place at the submicrometer level, starting from the loads applied at the organ (i.e., cm) scale. To this end, micro-FE calculations at the whole bone level of the notched samples used in pre-vious experimental studies were conducted. Our multilevel strategy not only allowed the application of proper bound-ary conditions in the subsequent submicron FE analysis but also fully characterized the stress and strain raising effect of the notches introduced to promote microdamage. In fact, considerably greater tensile stress and strain in the circum-ferential direction at notched locations than un-notched loca-tions were observed (Figs.5,6), indicating that the cracking mechanism in the microcompression experiments was driven by tensile components of stress and strain in the circumfer-ential direction (and to a lesser extent in the radial direc-tion). These tensile stresses were greatest at endosteal and periosteal locations (Fig.4), consistent with sites of damage initiation observed experimentally (Voide et al. 2009;Voide et al. 2011). It was also observed that B6 and C3H samples sustained similar 3D states of stress and strain during micro-compression testing. This result implies that microcompres-sion experiments produced approximately equal loading on the bone microstructure for both mouse strains and enabled equivalent boundary conditions to be applied in the subse-quent microdamage FE analyses. It should be mentioned, however, that notches of similar size and aspect ratio are never seen in vivo as they are artificially introduced—according to standard fracture mechanics approaches—to make sure that microdamage will actually happen at the region under exam-ination. In our work, only the organ-scale models contained the notch which, in turn, influenced the microdamage models through the boundary conditions. In fact, the notch caused an increase of approximately 60 % for circumferential, 20 % for longitudinal and less than 10 % for radial strains (see Fig.5), when compared to regions far away from the notch. Hence, an analysis on similar un-notched samples could be done by rescaling the initial boundary conditions imposed on the microdamage models. However, even for the analy-sis of intact samples to be relevant in the in vivo scenario, it would still require sound assumptions on the main prevalent loadings acting at the organ level which, unfortunately, are largely unknown.
Second, we implemented three microdamage algorithms based on a fairly simple voxel removal approach (Fig.2). Although several computational procedures have already been introduced to simulate microdamage in bone, to our knowledge, the complex 3D microstructure of cortical bone has never been addressed in such detail. For instance, con-tinuum damage method, which seeks to represent the
dete-Table 1 Comparison of the microdamage behavior between experiments and simulations
Experiments Simulations
Cr.V/Ct.V (%) Cr.Th (µm) Cr.Le (µm) Md.V/Ct.V (%) Md.Th (µm)
B6 1.0± 0.5 2.5± 1.0 107± 48 0.64± 0.08 1.48± 0.02
C3H 0.7± 0.7 2.6± 0.8 293± 197 0.71± 0.09 1.50± 0.01
Microdamage morphology was characterized in terms of crack volume density (Cr.V/Ct.V), crack thickness (Cr.Th) and average crack length (Cr.Le) measured experimentally at 1 % overall compressive strain (Voide et al. 2011). Considering the microdamage simulations, microdamage volume density (Md.V/Ct.V) and microdamage thickness (Md.Th) were reported at a strain factor of 40 %
No significant differences were detected when comparing the two mouse strains (B6 and C3H), neither in experiments nor in simulations
Table 2 Correlation coefficients (R) and corresponding p values
com-puted with linear regression analysis between morphometric indices— canal volume density (Ca.V/Ct.V), canal unit volume (Ca.V/N.Ca),
canal thickness (Ca.Th), canal spacing (Ca.Sp), lacuna number den-sity (N.Lc/Ct.V), lacuna volume denden-sity (Lc.V/Ct.V)—and strain factor (SF) for damage initiation and propagation for B6 and C3H mice
SF damage initiation SF damage propagation
R p value R p value Ca.V/Ct.V (%) 0.463 0.130 0.406 0.190 Ca.V/N.Ca (103µm3) 0.375 0.229 0.498 0.100 Ca.Th (µm) 0.507 0.093 0.410 0.186 Ca.Sp (µm) 0.555 0.061 0.363 0.247 N.Lc/Ct.V (103mm−3) 0.031 0.923 0.189 0.559 Lc.V/Ct.V (%) 0.203 0.527 0.233 0.467
rioration of material load carrying capacity by scaling the elasticity tensor, has been used to capture the dependence of trabecular bone failure upon its morphological proper-ties in FE simulations at the trabecular level (Zysset and Curnier 1996). An alternative approach is the method of cohesive surfaces (Needleman 1987), which has been used to model fracture in bone (Ural and Vashishth 2007;Tomar 2008;Ural 2009). This technique requires the placement of cohesive elements on the interfaces of finite elements where microdamage can then occur. The cohesive surfaces method can be very effective when a clear interface exists within the model, for example across cement lines in osteons. It becomes less reliable and also more difficult to identify loca-tions for cohesive surfaces when the material does not have a well-organized structure—like murine cortical bone ( Ker-schnitzki et al. 2011)—at the level where microdamage is simulated. A number of challenges continue to persist in the FE simulation of cracking and damage: mesh sensitiv-ity due to size of elements employed and the manner in which they are aligned; and issues associated with conver-gence due to decreased load carrying capacity of the dam-aged system. Problems associated with mesh alignment sen-sitivity have been dealt using fine unstructured meshes and continued adaptive re-meshing. Other recent approaches are based on partition of unity methods. One such approach, called extended FE method (X-FEM) (Belytschko and Black 1999; Moes et al. 1999, 2002; Gravouil et al. 2002;
Bor-das and Moran 2006), permits the numerical handling of discontinuities that characterize cracking and microdamage within the finite elements with the advantage that extensive re-meshing is not required. However, one downside is that the current applications of X-FEM in bone mechanics are mainly restricted to two-dimensional (2D) simulations on rather idealized structures (Budyn et al. 2008;Budyn and Hoc 2010). Fracture energy-based approaches have been tra-ditionally used to overcome mesh sensitivity associated with element sizes. Typically, they employ constitutive models in which the post-fracture stress carrying capacity decreases with increasing crack displacement (rather than strain). As the load carrying capacity decreases, further load applica-tion causes convergence problems which addiapplica-tionally require treatment through proper algorithms (Riks 1979). In the con-text of bone, it can be argued that these approaches are able to capture local toughness behavior following crack initia-tion as crack opening/propagainitia-tion is controlled by fracture energy. Obviously, such accuracy comes at the expense of a dramatic increase in computational resources and a robust nonlinear code that includes all above features. As a conse-quence, in large-scale simulations of bone mechanics (i.e., those based on real bone microstructures), methods involv-ing mesh refinements, partition of unity and fracture energy are not practicable. For this reason, especially in trabecular bone biomechanics, voxel-based FE solvers are often used in combination with relatively simple damaging algorithms
Microdamage and elastic properties Md.V/Ct.V [%] 0.0 0.2 0.4 0.6 0.8 1.0 B u lk mod u lu s [G P a] 6 8 10 12 14 16 B6, y = -6.0 x + 14.4 C3H, y = -3.7 x + 10.9
Fig. 10 Microdamage accumulation and mechanical properties. The
bulk modulus of B6 and C3H samples decreased linearly with increasing microdamage volume density (Md.V/Ct.V). Data shown as mean values ± standard deviations
(Verhulp et al. 2008a;Christen et al. 2010;Hambli 2013). In our microdamage simulations, we have shown that a simple and robust stress gradient approach is able to deal with mesh alignment bias while providing the computational advantage offered by having equally sized and shaped 8-node hexa-hedral elements in order to simulate complex 3D structures at the submicrometer-scale. Further use of our method, in which element deletion is followed by a full re-analysis, per-mits us to completely avoid convergence issues associated with redistribution of stresses to simultaneously satisfy the fracture energy-based constitutive law and equilibrium. This robustness does, however, come at a cost: Our algorithms dis-play a brittle behavior which may not be the case if fracture energy-based laws were to be employed.
Considering our voxel removal algorithms, it was observed that microdamage formed using the two initial algorithms (σli m and CL) was restrained by the mesh lines (Fig.3a, b);
conversely, theσGalgorithm was found not to restrict
micro-damage to the mesh lines (Fig.3c). Furthermore, the sim-ulated microdamage was attracted toward nearby features such as canals and lacunae, which acted as stress raisers. Thus, the remainder of this discussion refers to theσG
rithm. The performance of the developed microdamage algo-rithm was assessed by comparison of the generated behavior with that observed during experiments (Voide et al. 2009;
Voide et al. 2011; Christen et al. 2012). The local stress raising effect of microstructural features influenced both the initiation and propagation of microdamage: Initiation was
generally observed at canal surfaces, and the same behavior was observed during experimental testing of C3H samples, whereas for B6 samples, damage initiation was generally reported at endosteal or periosteal surfaces (which were not included in our models, as explained in Sect. 2.2) (Voide et al. 2009). The microdamage accumulation computed in this study (Fig.9; Table1) was similar to the experimen-tal behavior showing a higher accumulation for C3H than B6 samples (Voide et al. 2011). In our model, we did not report on microdamage length as, due to the brittle behav-ior, microdamage was quite rapidly seen all the way through the longitudinal direction (see Fig.8) so that microdamage length was mainly constrained by the size of the models (i.e., 126µm). Moreover, we did not specifically compare the sim-ulated microdamage morphology with previous (in vitro and in vivo) knowledge of diffuse damage. Although diffuse dam-age has been observed and extensively characterized (Burr et al. 1997;Vashishth et al. 2000;Lee et al. 2003;O’Brien et al. 2003), recent 3D investigations based on SR imaging have shown that microdamage morphology critically depends on the observation plane: What is considered diffuse damage could be interpreted as a linear crack observed in a plane per-pendicular to its main dimension (Voide et al. 2009;Voide et al. 2011). The experimental studies also reported the abil-ity of lacunae and canals to guide the direction of damage propagation. The microdamage algorithm developed here reproduced this behavior (Figs. 3, 7). Since the algorithm evaluates the damage direction solely upon the local stress gradient, it can be concluded that this is sufficient to cap-ture the damage guiding effect of the bone microstruccap-ture, arising from their stress raising influence. Additionally, our previous experimental study revealed that the rate of damage propagation in C3H samples was significantly higher com-pared to that observed in B6 samples (Voide et al. 2011). The present microdamage algorithm produced an analogous behavior since SF for damage initiation and propagation for B6 samples were higher than for C3H samples. The fact that those differences were not statistically significant may be (in part) due to the smaller ROI considered (0.002 mm3) compared to the experimental study (0.393 mm3for B6 and 0.622 mm3for C3H, respectively) (Voide et al. 2011). It is worth mentioning that with our approach, damage propaga-tion was always orthogonal to the maximum applied tensile strain, in agreement with the compression in experimental tests (Voide et al. 2009;Voide et al. 2011). However, other authors employing three- and four-point-bending tests (Nalla et al. 2005) reported crack propagation not always orthog-onal to the loading direction but highly dependent on the principal collagen orientation, at least for scenarios where such orientation was a clear feature of the bone ultrastruc-ture.
The role of microstructural morphology in microdamage was further evaluated through linear regression of canal and
lacunar morphology with the applied strains required for damage initiation and propagation. Here, one possible pit-fall of using mesh elements of the same size could be that the stress gradient around smaller spaces like lacunae is predicted with a lower accuracy than the stresses near bigger pores (like canals). Nevertheless, the finding that canal descrip-tors were better predicdescrip-tors than lacunar indices for SF for damage initiation and propagation is in agreement with the observation that damage formation always occurred at canal surfaces or at the borders of the cortex (Voide et al. 2009). It is also in line with the experimental evidence that canal indices, such as canal volume density and canal unit volume, were closely related to microdamage density, whereas lacuna properties did not correlate with the observed microdamage (Voide et al. 2011). However, in the present study, a substan-tial degree of the variation in the SF could not be explained by canal descriptors, whereas experimental results on simi-lar samples showed quite high linear correlation coefficients between canal morphology and crack density (Voide et al. 2011). This discrepancy may be due to differences in the sam-ples and in the sample size analyzed, along with the fact that we attempted to measure the “resistance” to microdamage initiation and propagation, which is a complex parameter that cannot be directly compared to crack density. Hence, in addi-tion to canal properties, other path-dependent mechanisms, such as shielding effects, may also influence the strain factor. We also estimated the influence of microdamage on mechan-ical properties by calculating the apparent bulk modulus of the virtual bone samples during microdamage simulations. In principle, such information could be “fed back” to the organ level, by rescaling the elastic properties of the notched FE models. This will reduce the peak stresses calculated in the locations opposite to the notch, but it will not change the interplay of the stresses/strains along radial, circumferential and longitudinal directions, which is the main feature con-necting the two length scales (i.e., organ and tissue) in this work.
The results of this study demonstrated that it is possi-ble to simulate microdamage at a physiologically relevant scale using a multilevel framework, where image-based FE informs submicrometer FE models about the proper bound-ary conditions and a stress gradient-based element removal approach is then used. However, some limitations remain that must be resolved for further development of this method. The applied strain required for microdamage propagation was considerably lower in the present study than what was observed in experiments using the same samples. For exam-ple, the mean apparent-level strain for damage propagation of B6 and C3H models was 0.41 and 0.36 %, respectively; the experimentally determined values were 1.81 and 3.6 % (unpublished data). As the sample size for the experiments and that used for simulation were different and since the strain state within the volume under consideration is not
homogeneous the two cannot directly be compared. How-ever, if we assume that significant microdamage occurs within the domain used for simulation, then one would have expected the strains from experiments to be smaller than those obtained from modeling. We believe there are two key reasons for this discrepancy. Firstly, the maximum principal stress value for voxel deletion was the primary determinant of the applied strain at which damage initiation and propagation occurred. The present results indicated that the current value of 100 MPa, approximating the tissue-level strength of bone (Bayraktar et al. 2004), was too low. In fact, such value has been obtained without considering the porosity within cor-tical bone at the micrometer and submicrometer-scale. As strength is inherently reduced by smaller scale flaws (such as the microstructural pores), it seems reasonable to pre-sume that, at such length scale, tissue-level strength may be higher. Secondly, element removal represents brittle local-ized behavior, whereas bone is known to be quasi-brittle due to several toughening mechanisms acting at different length scales of the hierarchical structure of bone (Fratzl and Weinkamer 2007;Koester et al. 2008;Zimmermann et al. 2011). For instance, at the tissue level, the inhomogeneity of Young’s modulus may play a pivotal role against microdam-age. This is particularly true when considering the layered structure of lamellar bone around osteons where the periodic variation in Young’s modulus has been shown to produce a shielding effect to the crack tip (Fratzl and Gupta et al. 2007;Zimmermann et al. 2010). In order for this effect to be relevant, the ratio of elastic moduli in the periodic lay-ers should be larger than five (Fratzl and Gupta et al. 2007). Furthermore, tissue-level structural anisotropy, mainly com-ing from the different orientations of mineralized collagen fibrils, has been shown to influence both the tissue-level mechanical properties of bone (Ji and Gao 2006;Ghanbari and Naghdabadi 2009;Vaughan et al. 2012) as well as the cracking aspects (Peterlik et al. 2006). However, murine cor-tical bone has a poorly defined ultrastructure (Kerschnitzki et al. 2011) lacking osteons and cement lines; hence, the under-lying inhomogeneity and anisotropy of mineral content (and hence of tissue stiffness) may not be so crucial in slowing down microdamage formation and propagation. Addition-ally, to capture nanoscale toughening, it would be necessary to represent mineralized fibrils in the models, for example by introducing layers of elements with differing values of elas-tic moduli and failure properties. Such features have been included in 2D FE analyses of bone damage, where material properties were based on light microscopy and nanoindenta-tion experiments (Budyn et al. 2008;Budyn and Hoc 2010). However, the realization of such an approach in 3D would be impeded by the difficulty in identifying where such fea-tures should be placed throughout the volume, rather than within a selected plane. For these reasons, refined models for human bone will require appropriate imaging strategies
to identify those features in 3D. With that in mind, to alle-viate the brittle behavior of our models, subsequent devel-opments should involve a gradual reduction in load carrying capacity of elements prior to their deletion (Hardisty et al. 2013).
In conclusion, a novel multilevel approach based on micro-FE and a microdamage algorithm was developed, which captured qualitatively and quantitatively many of the damaging behaviors observed experimentally at the submicrometer-scale. The method developed here offers insight into the interaction of bone microstructure, such as canals and osteocyte lacunae, with damage initiation and propagation.
Acknowledgments The authors acknowledge the Swiss National Supercomputing Centre (CSCS, Lugano, Switzerland). F.D. gratefully acknowledges support from the Carnegie Trust for the Universities of Scotland, P.S. from the Swiss National Science Foundation and A.L. from the Whitaker Foundation.
References
Arbenz P, van Lenthe GH et al (2008) A scalable multi-level precon-ditioner for matrix-free mu-finite element analysis of human bone structures. Int J Numer Meth Eng 73(7):927–947
Bayraktar HH, Morgan EF et al (2004) Comparison of the elastic and yield properties of human femoral trabecular and cortical bone tissue. J Biomech 37(1):27–35
Bell KL, Loveridge N et al (1999) Regional differences in cortical poros-ity in the fractured femoral neck. Bone 24(1):57–64
Belytschko T, Black T (1999) Elastic crack growth in finite elements with minimal remeshing. Int J Numer Meth Eng 45(5):601–620 Bonivtch AR, Bonewald LF et al (2007) Tissue strain amplification
at the osteocyte lacuna: a microstructural finite element analysis. J Biomech 40(10):2199–2206
Bordas S, Moran B (2006) Enriched finite elements and level sets for damage tolerance assessment of complex structures. Eng Fract Mech 73(9):1176–1201
Bousson V, Peyrin F et al (2004) Cortical bone in the human femoral neck: three-dimensional appearance and porosity using synchrotron radiation. J Bone Miner Res 19(5):794–801
Budyn E, Hoc T (2010) Analysis of micro fracture in human Haver-sian cortical bone under transverse tension using extended physical imaging. Int J Numer Meth Eng 82(8):940–965
Budyn E, Hoc T et al (2008) Fracture strength assessment and aging signs detection in human cortical bone using an X-FEM multiple scale approach. Comput Mech 42(4):579–591
Burr DB, Forwood MR et al (1997) Bone microdamage acid skele-tal fragility in osteoporotic and stress fractures. J Bone Miner Res 12(1):6–15
Christen D, Levchuk A et al (2012) Deformable image registration and 3D strain mapping for the quantitative assessment of cortical bone microdamage. J Mech Behav Biomed Mater 8:184–193
Christen D, Webster DJ et al (2010) Multiscale modelling and nonlinear finite element analysis as clinical tools for the assessment of fracture risk. Philos Trans R Soc Math Phys Eng Sci 368(1920):2653–2668 Cooper DML, Turinsky AL et al (2003) Quantitative 3D analysis of
the canal network in cortical bone by micro-computed tomography. Anat Rec 274B(1):169–179
Cristofolini L, Taddei F et al (2008) Multiscale investigation of the functional properties of the human femur. Philos Trans R Soc Math A Phys Eng Sci 366(1879):3319–3341
Deligianni DD, Apostolopoulos CA (2008) Multilevel finite element modeling for the prediction of local cellular deformation in bone. Biomech Model Mechanobiol 7(2):151–159
Donaldson FE, Pankaj P et al (2011) Relating age and micro-architecture with apparent-level elastic constants: a micro-finite ele-ment study of female cortical bone from the anterior femoral mid-shaft. Proc Inst Mech Eng Part H J Eng Med 225(H6):585–596 Donaldson FE, Pankaj P et al (2008) Virtual trabecular bone models and
their mechanical response. Proc Inst Mech Eng Part H J Eng Med 222(H8):1185–1195
Eswaran SK, Gupta A et al (2006) Cortical and trabecular load sharing in the human vertebral body. J Bone Miner Res 21(2):307–314 Faridani A, Finch DV et al (1997) Local tomography. SIAM J Appl
Math 57(4):1095–1127
Fratzl P, Gupta HS et al (2007) Hindered crack propagation in materials with periodically varying Young’s modulus: lessons from biological materials. Adv Mater 19(18):2657
Fratzl P, Weinkamer R (2007) Nature’s hierarchical materials. Prog Mater Sci 52(8):1263–1334
Ghanbari J, Naghdabadi R (2009) Nonlinear hierarchical multiscale modeling of cortical bone considering its nanoscale microstructure. J Biomech 42(10):1560–1565
Gravouil A, Moes N et al (2002) Non-planar 3D crack growth by the extended finite element and level sets, Part II: level set update. Int J Numer Meth Eng 53(11):2569–2586
Hambli R (2013) Micro-CT finite element model and experimental validation of trabecular bone damage and fracture. Bone 56(2): 363–374
Hardisty MR, Zauel R et al (2013) The importance of intrinsic damage properties to bone fragility: a finite element study. J Biomech Eng Trans Asme 135(1):011004
Jager I, Fratzl P (2000) Mineralized collagen fibrils: a mechanical model with a staggered arrangement of mineral particles. Biophys J 79(4):1737–1746
Ji BH, Gao HJ (2006) Elastic properties of nanocomposite structure of bone. Compos Sci Technol 66(9):1212–1218
Jones AC, Sheppard AP et al (2004) Three-dimensional analysis of cortical bone structure using X-ray micro-computed tomography. Phys A Stat Mech Appl 339(1–2):125–130
Jordan GR, Loveridge N et al (2000) Spatial clustering of remodel-ing osteons in the femoral neck cortex: a cause of weakness in hip fracture? Bone 26(3):305–313
Keaveny TM, Morgan EF et al (2001) Biomechanics of trabecular bone. Annu Rev Biomed Eng 3:307–333
Kerschnitzki M, Wagermaier W et al (2011) The organization of the osteocyte network mirrors the extracellular matrix orientation in bone. J Struct Biol 173(2):303–311
Koester KJ, Ager JW et al (2008) The true toughness of human cortical bone measured with realistically short cracks. Nat Mater 7(8):672– 677
Lee TC, Mohsin S et al (2003) Detecting microdamage in bone. J Anat 203(2):161–172
McCalden RW, McGeough JA et al (1993) Age-related-changes in the tensile properties of cortical bone: the relative importance of changes in porosity, mineralization, and microstructure. J Bone Joint Surg Am 75A(8):1193–1205
Moes N, Dolbow J et al (1999) A finite element method for crack growth without remeshing. Int J Numer Method Eng 46(1):131–150 Moes N, Gravouil A et al (2002) Non-planar 3D crack growth by the
extended finite element and level sets, Part I: mechanical model. Int J Numer Method Eng 53(11):2549–2568
Nalla RK, Stolken JS et al (2005) Fracture in human cortical bone: local fracture criteria and toughening mechanisms. J Biomech 38(7):1517–1525
Needleman A (1987) A continuum model for void nucleation by inclu-sion debonding. J Appl Mech Trans Asme 54(3):525–531 Nicolella DP, Moravits DE et al (2006) Osteocyte lacunae tissue strain
in cortical bone. J Biomech 39(9):1735–1743
Niebur GL, Feldstein MJ et al (2000) High-resolution finite element models with tissue strength asymmetry accurately predict failure of trabecular bone. J Biomech 33(12):1575–1583
O’Brien FJ, Taylor D et al (2003) Microcrack accumulation at dif-ferent intervals during fatigue testing of compact bone. J Biomech 36(7):973–980
Pankaj P, Donaldson FE (2013) Algorithms for a strain-based plasticity criterion for bone. Int J Numer Methods Biomed Eng 29(1):40–61 Peterlik H, Roschger P et al (2006) From brittle to ductile fracture of
bone. Nat Mater 5(1):52–55
Riks E (1979) An incremental approach to the solution of snapping and buckling problems. Int J Solids Struct 15(7):529–551
Ritchie RO, Buehler MJ et al (2009) Plasticity and toughness in bone. Phys Today 62(6):41–47
Ruffoni D, Kohler T et al (2013) High-throughput quantification of the mechanical competence of murine femora: a highly automated approach for large-scale genetic studies. Bone 55(3):216–221 Ruffoni D, van Lenthe GH (2010) Chapter 93: finite element
analy-sis in bone research: a computational method relating structure to mechanical function. Comprehensive biomaterials. Elsevier Science Ruffoni D, Wirth AJ et al (2012) The different contributions of cortical and trabecular bone to implant anchorage in a human vertebra. Bone 50(3):733–738
Sahar ND, Hong SI et al (2005) Micro- and nano-structural analyses of damage in bone. Micron 36(7–8):617–629
Schneider P, Levchuk A et al (2010a) Automated micro-compression device for dynamic image-guided failure assessment of bone ultra-structure and bone microdamage. Biomed Eng 55(Suppl 1):8–10 Schneider P, Meier M et al (2010b) Towards quantitative 3D imaging
of the osteocyte lacuno-canalicular network. Bone 47(5):848–858 Schneider P, Meier M et al (2011) Serial FIB/SEM imaging for
quan-titative 3D assessment of the osteocyte lacuno-canalicular network. Bone 49(2):304–311
Schneider P, Stauber M et al (2007) Ultrastructural properties in cor-tical bone vary greatly in two inbred strains of mice as assessed by synchrotron light based micro- and Nano-CT. J Bone Miner Res 22(10):1557–1570
Schneider P, Voide R et al (2013) The importance of the intracortical canal network for murine bone mechanics. Bone 53(1):120–128 Schneider P, Voide R et al (2009) Post-processing technique for
improved assessment of hard tissues in the submicrometer domain using local synchrotron radiation-based computed tomography. Bio-med Technol 54(1):48–54
Schulte FA, Ruffoni D et al (2013) Local mechanical stimuli regulate bone formation and resorption in mice at the tissue level. Plos One 8(4):e62172
Taylor D, Hazenberg JG et al (2007) Living with cracks: damage and repair in human bone. Nat Mater 6(4):263–268
Tomar V (2008) Modeling of dynamic fracture and damage in two-dimensional trabecular bone microstructures using the cohesive finite element method. J Biomech Eng Trans Asme 130(2):021021 Ural A (2009) Prediction of Colles’ fracture load in human radius using
cohesive finite element modeling. J Biomech 42(1):22–28 Ural A, Vashishth D (2007) Effects of intracortical porosity on
frac-ture toughness in aging human bone: a mu CT-based cohesive finite element study. J Biomech Eng Trans Asme 129(5):625–631 van Rietbergen B, Weinans H et al (1995) A new method to determine
trabecular bone elastic properties and loading using micromechani-cal finite-element models. J Biomech 28(1):69
Vashishth D, Koontz J et al (2000) In vivo diffuse damage in human vertebral trabecular bone. Bone 26(2):147–152
Vaughan TJ, McCarthy CT et al (2012) A three-scale finite element investigation into the effects of tissue mineralisation and lamellar organisation in human cortical and trabecular bone. J Mech Behav Biomed Mater 12:50–62
Verhulp E, van Rietbergen B et al (2008a) Indirect determination of trabecular bone effective tissue failure properties using micro-finite element simulations. J Biomech 41(7):1479–1485
Verhulp E, Van Rietbergen B et al (2008b) Micro-finite element sim-ulation of trabecular-bone post-yield behaviour: effects of material model, element size and type. Comput Methods Biomech Biomed Eng 11(4):389–395
Voide R, Schneider P et al (2011) The importance of murine cortical bone microstructure for microcrack initiation and propagation. Bone 49(6):1186–1193
Voide R, Schneider P et al (2009) Time-lapsed assessment of microcrack initiation and propagation in murine cortical bone at submicrometer resolution. Bone 45(2):164–173
Voide R, van Lenthe GH et al (2008) Bone morphometry strongly predicts cortical bone stiffness and strength, but not toughness, in inbred mouse models of high and low bone mass. J Bone Miner Res 23(8):1194–1203
Yeni YN, Brown CU et al (1997) The influence of bone morphology on fracture toughness of the human femur and tibia. Bone 21(5):453– 459
Zimmermann EA, Launey ME et al (2010) The significance of crack-resistance curves to the mixed-mode fracture toughness of human cortical bone. Biomaterials 31(20):5297–5305
Zimmermann EA, Schaible E et al (2011) Age-related changes in the plasticity and toughness of human cortical bone at multiple length scales. Proc Natl Acad Sci USA 108(35):14416–14421
Zysset PK, Curnier A (1996) A 3D damage model for trabecular bone based on fabric tensors. J Biomech 29(12):1549–1558