Publisher’s version / Version de l'éditeur:
Engineer, 218, 5666, pp. 321-324, 1964-11-01
READ THESE TERMS AND CONDITIONS CAREFULLY BEFORE USING THIS WEBSITE. https://nrc-publications.canada.ca/eng/copyright
Vous avez des questions? Nous pouvons vous aider. Pour communiquer directement avec un auteur, consultez la
première page de la revue dans laquelle son article a été publié afin de trouver ses coordonnées. Si vous n’arrivez pas à les repérer, communiquez avec nous à [email protected].
Questions? Contact the NRC Publications Archive team at
[email protected]. If you wish to email the authors directly, please see the first page of the publication for their contact information.
NRC Publications Archive
Archives des publications du CNRC
This publication could be one of several versions: author’s original, accepted manuscript or the publisher’s version. / La version de cette publication peut être l’une des suivantes : la version prépublication de l’auteur, la version acceptée du manuscrit ou la version de l’éditeur.
Access and use of this website and the material on it are subject to the Terms and Conditions set forth at
Temperature and ventilation in the Toronto subway : an experimental
study
Brown, W. G.
https://publications-cnrc.canada.ca/fra/droits
L’accès à ce site Web et l’utilisation de son contenu sont assujettis aux conditions présentées dans le site LISEZ CES CONDITIONS ATTENTIVEMENT AVANT D’UTILISER CE SITE WEB.
NRC Publications Record / Notice d'Archives des publications de CNRC:
https://nrc-publications.canada.ca/eng/view/object/?id=ec2d8bf2-14d6-40ad-88a6-330d927ec1a5
https://publications-cnrc.canada.ca/fra/voir/objet/?id=ec2d8bf2-14d6-40ad-88a6-330d927ec1a5
Ser
THI
N21r
2
no. 228
c.
2
BLDG
N A T I O N A L l<F:SI<ARCH C O U N C I L
C A N A D A
TEMPERATUKE
ANDVENTILATION
IN
TIIICTOKONTO
SUBWAY
A N E X P E R I M E N T A L STUDY
j-"--
-
+,:a*:,-.
'.<'. ' J d s ,d I -, It 151'12 1N'l'lCl) la'IZOhIT H E
IZNGIN kII3IZ, VOL. 2 18, NO. ,iBG(j, AUGUS'I' 28, 1964, 1'.:321-324
R E S E A R C I L 13AI'14:R N O .
228
O F TI313
1)
LVISION 01'
BUILDING
l<I!lS73ARC
1-1
SOMMAIRE
Des mesures de tempiralure et d'icoule~nenl cle I'air effecluies clans cleux stations acljacentes du mitro de la rue Yonge a Toronto ont permis de co~islater que le ddbit lnoyen de la ventilalion provoquie par l'efl'et cle piston des rames se ddplacant clans les tunnels et par les ventilateurs varie entre 70 pieds 3/mn et
130
pieds 3 / m n par pied cle tunnel.Ce
clibil est suff'isant pour limiter la iempdralure moyenne du inilroh
environ11°F
au-dessus cle la teinpiralure alnbianlc et pour l i ~ n i t e r lesvariations de t e ~ n p d r a ~ u r e du mitro. dans la journie. a environ 10°F. la ternpirature ainbiante pouvant varier juscru'i 20°F. Colllpari~ h la thiorie approximative ces r i s u l ~ a t s montrent clue le mdtro cle la rue Yonge Fonctionne clans des conclitions pI.esque optiniales et que la rdduction de la ventilation serait nuisible tandis clue soil intensification n'ainiliorerait nullement les conditions actuelles de confort.
Reprillfed froin
T H E ENGINEER,
Allgust
28, 1964
$\ ;%j
>d,L
y 7 2
Temperature and Ventilation in the Toronto Subway
AN EXPERIMENTAL STUDY
By W. G. BROWN* Temperature and air flow measurements in two adjacent
stations of the Toronto Yonge Street subway system indicated average ventilation rates d u e t o train piston action plus fans of between 70ft3/min and 130ft3/min per foot of tunnel. These rates were enough to limit the average s u b w a y temperature t o about 1 1 "F above ambient and t o limit the diurnal s u b w a y temperature variation t o about 1O0F, the ambient temperature varying a s much a s 20°F. Comparison with approximate theory indicated that the Yonge Street subway is operating near optimum conditions and that reduced ventilation would be deleterious whereas increased ventilation would not be effective in further improving comfort conditions with the existing traffic.
T
H E study of subway temperature and vcntilation to be reported here was Initiated during planning of the University Avenue and east-west lines of the Toronto Rapid Transit System. The opening of the University Avenue line afforded a n appro- priate opportunity to present the results of the investigation. The Yonge Street line of thc subway, in which tests were carried out, has been in successful operation for about nine years, during which tiliic a few measurc- mcnts of temperature and air velocities were sufficient to indicate that the ventilation was generally adequate. In considering the new sections of the system, however. i t was t l i o ~ ~ g h t that a detailed study would oit'er ~lsefill design information. Accordingly, extensive tests were carried out in two adjacent stations along Yonge Strcet during tlie summer and fill1 of 1962 to determine temperatures and ventilation rates i ~ i tlle underground system.Before presenting the test results it would be well to review briefly tlie mechanism of underground railway ventilation. The heat given up by trains, passengers, and lights is removed in several ways, principally by
' Building Serviccr Section, division of building resenrch. Nn1tun;tl Rerearch Council. Ounwn, C;~n.>d:>.
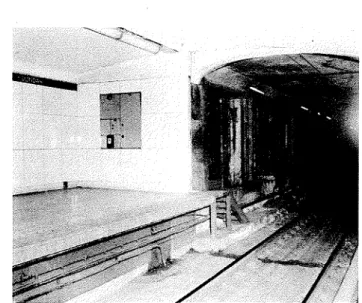
the ventilation induced by the piston cll'cct of trains in the tunnels. In trilvcrsing tunnels, the trains force air ahead of tlicrn- selves and out through vcntilation openings and passenger exits and draw air in through similar openings behind them. Fans installed in shafts between stations for emergency purposes serve as additional sources of ventilation (Fig. 1). Elevation changes from station t o station create a chimney cfTect and ait'ect vcntilation in a minor way. Tlierc is also always some natural convection through vent openings due to tclnperature diit'crcnccs alone (Fig. 2).
Owing to air interchange bet\vccn the subway and street level the tcmpcraturc in a subway is dependent on the ambient air tcmpcrature. The critical period for comfort conditions in a subway is generally mid- summer when tlic ambient temperatlire is liigli. I n mid-winter, on tlie other hand, a severe cli~natc can rcsult in uncomfortably low subway temperatures. The ambient air temperature is cliaracterised by two tcm- perature cycles, the diurnal and annual. At Toronto the mean annual ambient tem- perature is 45°F and, with an annual ampli- tude of 24"F, this results in mean daily t e ~ n p c r a t ~ ~ r e s in mid-summer and mid-winter
of 69 F and 21' F. Tlic diff'ercncc bctwecn ~ ~ i a x i ~ i i ~ ~ ~ i l and minimu111 air temperature in mid-sunimcr is about 19 F witli the rcsult that the average daytime temperature peak is about 78°F.
Tlic Yonge Street line of tlic Toronto Subwc~y extends 4-5 1iii1t.s from Union Station t o Eglinton and contains a great m a n y vcntilation opcninss and passages. It was
not possible to make ~iicasuremcnts tlirough- out and a section of tlie line c o n t a ~ n i n g the t\vo atliuccnt stiltions at College Strect and Dundas Strcct w:~s chosen for study. This scction, schcmatically rcprcscntcd in Fig. 3. is typical of subway constructiun generally and consists of vent or blast shafts at the ends of station platforms, passenger openings at the stations, and fan shafts betwccn stations. The blast shafts at stations serve tlic double purpose of providing vcntilation while reduc- ing air velocities over tlic platfor~ns. The in fan shafts are intended primarily for emergencies hut can also be operated continuously.
The vcntilation induced by thc piston action of trains varies during the d a y as a rcsult of train scheduling changes wliicli accord witli the number of passengers travelling. Information of typical train lieadwov and numbers of cars in operation
Fig are
in the * ~ o n g e Strect subway is given in Table I. The heat load on the subway also
Time
I
:rain hc;ad\~;~yI
Trains lrrr hour Cars p e r h o u r. I I I I N U N ~ I ; L ~ ~ ( a t c h d r r c l ~ n n )
I
(cacll dlreccionlTABLE lI-R~,sh Hotrr Heof 0 1 1 f p 1 1 1 ;I! tire Torolrto Yo~lge Street Srtbu,rry
6-7.30 a.m. . . . 6.30-9.30 a.m. (rush) . . . 9.30 a . m . 4 p.m. . . . 4 p.m.-6 p.m. (rush) . . . 6 p.m.-I0 p.m. . . 10 p.m.-? n.1" . . . Hen1 o u t p u t in B.l.u Source of heat m i n u t e s 3 j ZJ
!I
- 4 4 5Tminr. rnolorr. driver. brakes. I 4 6 0 Train lights . . . 30
. . . Parrcngerr o n t r a i n s
Pasrcngcrs o n p h l l b r m r . . .
I-F~,, shaft. L~~~~~~ Slalion lights 20
.
. . . . . .Erralaton 35
the fan Total . . .
1
1 7 3 0varies during the day as a result of train scheduling. Figures for rush-hour operation are given in Table 11. The approximate manner in which the heat load varies during the day is shown in Fig. 2, from which the average daily heat load is found to be about 800 U.t.~~./hour/ft. FAN SHAFTS 1-T!N!C5Q. * 1 TERAULAY ST. - VENT SHAFTS DUNDAS STREET
1
r
PASSENGERS VENT SHAFTSFig. 3-Yonge Street Subway, Dundas Station to College Station
5
0 21 [r GERRARD - -5
0 w McGILL ST.Fig. 2-Open tent shaft louvres at end of platform
ELM ST. ---- FANSHAFTS ---- WALTON ST. STREET - - - - HAYTER ST. ----
Fig. 4-Hourly variation of heat load In the Yonge Street Subway
Teniperat~o.es.-Two Fuess recording hygrothermograpl~s were installed a t loca- tions on station platforms just above head levcl and toward each end of the platform. These instruments werc not available in mid- summer but the results obtained for October can bo ~lsed to infer summer temperatures.
GRANBY ST.
E
Air Ve1orirics.-A calibrated Alnor velo- meter was used for velocity measurements in the various vent and fan shafts and passenger openings. Since the air flow fluctuated con- siderably and was continually reversed in direction by the action of the trains, it was found necessary to record the velocity every tell seconds for a period of about twenty
VENTSHAFTS
minutes in order to obtain average rcsu!ts. Since this was a tedious procedure it was decided to obtain complete results for the whole test section only during normal day- time operation, when the train headway was 32 minutes, and with fans inoperative and with the louvres on all vent shafts open. In
addition, more limited tests werc carried out to study the air flow with other train head- ways a n d with the fans in operation. The accuracy of measurements was rcduced by two causes: it was necessary to make measure- ments a t the various openings on different days, and time permitted measurements a t only one point in each opening, rather than a complete traverse.
PASSENGERS
A b Flo111.-Representative velocity meas- urements for a passenger exit (east passage, College Street) are given in Fig. 5 for the same time of day (10.30 a.m., 3; minutes headway) but taken two months a p a r t (July and September). There is no appreciable difference in the two sets of measurements. the average net outward velocity in July being 500ft/min and in September 400ft/min. The cross sectional area of the passage is 1 12ft2, hence the net outward air flow aver- ages 50 000ft3/min. Fig. 3 also shows the temperatures measured in the passage con- tinuously.
-1000
TIME - MINUTES
81.-39 min headway-ncrm;tl daytime operation
B-2! !"in head\vay-rush hour o p c m ~ i a n
Fig. 6-Air velocities (vent shaft, north-west at College Street Station) for diRerent train headways
Fig. 6 co~npares velocity readings in a vent shaft (northwest at College Station) at two different times of day (normal operation 3: minutes headaay rush-hour opcration
TEMPERATURE IN PMSAGE (]ULY 1962) - 79 3
24 minutes headway). For this par- ticular vent the net inward air velocity during normal operation is lOOft/min but during rush operation it is only about 20ft/min. Thc test results indicate that train frequency is not directly related to ventilation rate.
The summarised ventilation rates for the complete test section are givcn in Fig. 7
COLLEGE
I
JrArIoNI
--ci
-3
A-3
DUNDAS STATION --cz+l
z r
-1
A1
KEY Y = VENT SHAFT. P = PAIIENGER EXIT. f-
fAN SHAFT.T
Fig. 7-Ventilation rates in all openings at the Collegc Street and Dundas Street stations (fans not in usc)
where average flows both into and out of the subway are shown. Although tlie records d o not have high accuracy nevertheless several obsclvations can be made. It clianccd that the train schedule required trains from opposite directions to enter and leavc tlie College Station a t vcry ncarly the same times. This resulted in thc maximum pos- sible ventilation at tl11s station and is the reason for tlic large net outflow of air in the east passenger exit. The west exit was relatively restricted, resulting in far less air flow. It may also be noted that, due to the approximatc symmetry of thc station, the flow patterns of d i a ~ o n a l l y opposite vent shafts also tendcd to be similar. The fan shafts bctween the two stations, being rela- tively isolated from the stations, showed nearly identical values for both inflow and outflow. Ventilation rates in openings a t the Dundas Station are somewhat lower than those a t College Strect because here tralns arrived from opposite directions at approxilnately equal time intervals.
A test with the fans between the two stations in operation gave the results shown in Fig. 8, for the Collcge Street Station. It
c
,
,
F +oooKEY V = VENT SHAFT. P = PASSENGER EXIT.
f = FLY S H m .
Fig. 8-Ventilation rates in all openings at the College Street Statioh (fans opfrntihg)
will be notcd that the inflow at all openings has been increased by the increased outflow at the fan shafts.
If the scctioh which includcs thc openings at the station and onc pair of fan shafts is treated as a unit thcn t11c rcsults shown in Table I11 for the total inflow and outflow
TABLE Ill-Torol Ve~rlilolio~r Roles
of air arc obtained. , T h e total inflow and outRow rcsults are In ngrccment for thc Dundas Strect Station withot~t fans and for the College Strect Station with fans, indi- cating that there is no nct flow into or out
Callcsc Slrccl S~:llion
/
Tolnl ~ n l l o n - -- - - - --Il'jnlih
Tanr i n o p c r ~ l ~ \ e . .
1
I29 "00F;~ns o p u r : l l ~ \ e ... 2113 lllln
of the section through the tunnel in these two case
.
O n the other hand, results from thc Col/ep Street Station with fans inoperative indicate a large net inflow through the tunnel into the section. Such a result is due to themeeting of trains from both directions at the College Strcet Station. If the air tempcra- ture everywhere along the tunnel and at stations is assumed to be constant. then the smaller o f the inflow or outflow rates repre- sents the net ventilation of the sectio~l. Expressed a s ventilation rate per foot of section this gives figures of 80ft3/min and 70ft3/min for the C o l l e ~ e and Dundas sections with fans inoperative and 130ft3/mjn for College Street Station with fans in operation.
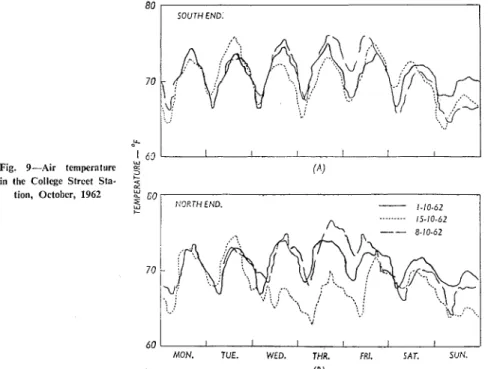
Te~irpern~~~res.-The recordcd temperatures at the two ends of the Collegc Street Station arc pvcn in Fig. 9 where they arc plotted on a daily basis for three succeeding weeks in October. Fig. 10 presents the corresponding \ d u e s of ambicnt air tcmpcratllrc as recordcd at the Bloor Street Meteorological Office. To be noted is the daily regularity of tlie subway temperatures in spite of the con- siderablc variation of ambicnt air tempcra- turc. Furthermore, largc fluctuations in ambient air teinperaturc are almost com- pletely damped o u t in the subway. Thcre is little temperature variation between tlie two cnds of the station although fluct~lat~ons were larger at the north end bccause thc rccording instrumcnt was influenced to some cxtcnt by its proximity to passcngcr exlts. The subway tempcrature and its amplitude decrease on weck-cnds, the Saturday and Sunday traffic o n the subway being con- siderably reduced.
Tol;!l o ~ ~ l l l o ~ ~
rt',nlt<~ I l l l1110
204 0:)O
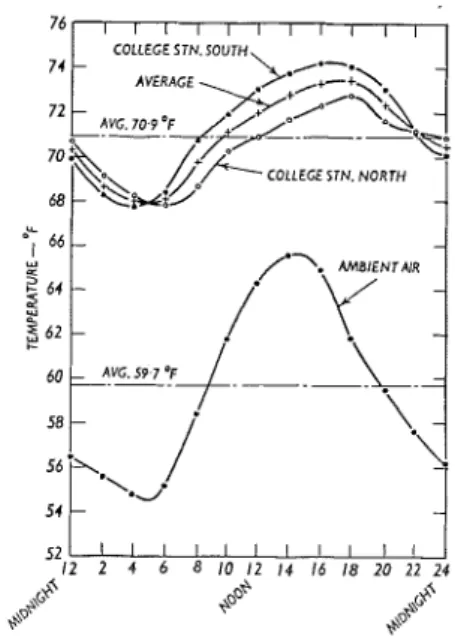
Average values of subway and ambicnt air tempcrature are given in Fig. 1 1 for wcck- day operation o n Wednesday, Thursday and Friday (records arc not complete for Monday and Tncsday) for the three-wcck pcriod. Tlic avcragc ambicnt temperature for the test pcriod was 60°F and thc ovcragc subway tempcraturc was 7I0F, ~ I I L I S thc hcat load on the subway has rcsultcd in a n average tcmpcraturc incrcasc of 11°F abovc ambient. The avcragc a m p l i t ~ ~ d c of tlic daily subway air tcmpernture variation is lcss than that of the ambient air, bcing about 3 - F a s com- pared with 6°F. It shot~ld be rcrnembered
80
SOUTH END.
1 6 g L L I I I I I
Fig. 9-Air temperature (4) in the College Struet Sta-
$
=tion, Octobur, 1962
"
" / ? ~ R T H END.
-
1-10.62.
. ..
. ..
. - 15-10-6260
1
I I I I I II
MON. 7UE. WED. THR. FRI. SAT. SUN.
8 0
COLLEGE SIN. SOUTH AVERAGE
70
P
I Fig. 10-Ambient air tem- w
= perature (Bloor Street
$
60 w Meteorological Office w Toronto), October, 1962 +2
b- 58 SO 54 52 I2 2 4 6 8 10 I2 14 16 18 20 2 2 2 4,&
+oo+,."
+@MON. TUE. WED. THR. FR1. SAT. SUN.
9
Fig. ll-Average air temperatures weekday operation
that the averaging procedure has hidden a possible future loading of the subway indicates that tllcre is no advantage to be actual peak-to-trough variations which yield as traffic increases over the years. The gained with particularly high ventilation apparent amplitudes about twice as great as value of q ~ = 4 0 0 B.t.u./hour/ft has been rates but, on the other hand, reduced ventila- these figures suggest. suggested as the heat load for trains with tion can increase temperatures
regenerative, rather than rheostatic brakes. ~ ~ ventilation and resulting hig], d ~ ~ ~ d
DISCUSSION temperatures often result near terminal
Strbn.ay Air T e t n p e r o t u r e ill M i ~ l - S u r ~ ~ r l ~ e r . CONCLUSIONS stations where trains move a t reduced speed -With the help of approximate theory A detailed investigation of ventilation and during switching operations.
developed elsewhere1 the recorded tempera- temperatures in two adjacent sections of the
tures in October can be used to estinlate the Toronto Yonge Street Subway has indicated ACKNOWLEDGMENT subway temperature in mid-summer. In this that in these sections the measured ventila- The author is greatly indebted t o Messrs. theory the normal temperature in mid- tion rates of between 70ft3/min/ft and W. H. Paterson, general manager; J. T. summer in the subway at a station is expressed 120ft3/min/ft of subway are such as to give Harvey, chief engineer; and F. C. Pattie, approximately by the following equation: reasonable temperature conditions. Other mechanical engineer, of the Subway Con- 3 . 8 9 ~ sections areprobably similar intheir behaviour struction Branch of the Toroilto Transit
'f.-7 -
I - d i - 5 . 6 x 1 ~ - 2 ( ~ / ~ ) + 3 . 6 and it can be concluded that the Yonge Commissioi~, for their assistance with pro-
Street Subway operates with near optimal blems and data p~rtnining to subway ventila- 4.9 x IO-"@/L)C., sin (7.18 s 10-lr) temperature and ventilation conditions.
+ --- -- -- - . . . - -- -- - - - tion. This article is a contribution of the
.\/I . O I k ( 1 1 - 4 . 9 ~ 10-3(Q/L))2 In designing future subway systems it is Division of Building Research of the National clear from Fig. 12 that some consideration Research Council, Canada, and is p~~blished 2.6 x 10-'(Q/L)CD sin (0.2621) should be given to expected increases in with the approval of the director of the
f \/ 1 ~(l-i-2.6-10-'0)? +
passenger traffic over the years, for the division.
increased traffic can have an appreciable R E F E R E N C C S
.
.
(1) effect on temperatures, (This situation ,i;B;",";;ezrCioDy.e Tlrcory of R o ~ i c l Trrrnrir T~,,n,rcl I'cnlilo-Sy,,~bolr:
R , , - T ~ ~ ),eat load o n tile sub\,ny. ~ l . t . ~ . , h ~ ~ , per required costly ventilation changes in the ,Mount. S. C. "Ventilation a n d cooling in on don's ~ u b e
root o r S U ~ W Z S . Railwnyr", Inrt. ~ l g . G; Vent. Engrr., plges 351-74.403, Jnnunry-
QIL-Tl,e v c n t i l l l i o n r;nc, cubic reel per h o u r root Londoll Underground.? F~urtllcr, Fig. 12 Fehru:srY. 1917. or subway.
f T h e mean annuvi outside air Lempernturc.
c;IThe ampliludc or t h e annual outride air Lcmpcralurc IZ0
cycle.
Co-The amplitude a r tile diurnal outride air lempcr;!lure
$
cycle.
r-Tirnc, hour.
5
110-
Inserting values for Toronto (T0=45"F, 2
CiI=24"F, Cu=6.7"F (July), the results for
$
varying Q/L and q~ are given in Fig. 12. For the test conditions of Q/L-80ft3/min/ft5
I00(total station ventilation-80
x
500 x 6 0 = 22 400 000ft3/hour) and qr,-B.t.u./l~our/ft the maximum temperature expected in mid-summer would be o n the average about
$
90 83°F which is in general agreement with2
summer spot measurements made in the
2
subway. (Ambient temperature vagaries$
a0-
- -
- -
-
MAXIMUM DAILY TEMP.---
MEAN DAILY TEMP, -could cause this figure to be 85°F to 87°F 2 on occasion.) If the emergency fans are made 5
use of, the maximum summer temperature for Q/L=128ft3/min/ft (total station venti-
$
70lation=3 840 000ft3/hour) would be about
2
65
AVERAGE AMBIENT AIR TEMP. = 69'F
AMBIENT AIR TEMP. AMPLITUDE - 6 . 7 ' ~
-
- -
---F.
80°F. The corresponding daily average tem- 10' 2 5 I 5 I I 1.5 I 2.5
I
5 Iperatures for these two cases would be 79°F STATION VENTIMTION RATE
-
CUBICFT. PER HR. 10'and 75°F respectively. The results for
qL=l 200 B.t.u./hour/ft in Fig. 12 represent Fig. 12-Calculated variation of Subway tempenture with ventilaticn rate and heat load
This pu1)lica~ion is being distributccl by thc Division of Bz~ilding Research of
he
National Research Council.11
shoulcl 1101 l)e rcprotluced i n whole or i n part, withoutpermission
o l the originalpublisher.
Thc Division would be glad to be o l assista~lce i n obtaining s ~ ~ c h permission.Publications o l the Division o l Buildiilg Rescarch may be ol~taincd by inailing the al~propriate remittance. ( a Bank Esprcss. or Post Oflicc Moiley Ordcr or a cheque madc pajable a1 par in O ~ l a w a . LO the Receiver General of Canada, creclil National Rcsearch Council) to 111e National Rescarch Council. Ottawa. Stanlps arc not acccplable.