Publisher’s version / Version de l'éditeur:
Canadian Journal of Civil Engineering, 22, 5, pp. 849-860, 1995-10-01
READ THESE TERMS AND CONDITIONS CAREFULLY BEFORE USING THIS WEBSITE.
https://nrc-publications.canada.ca/eng/copyright
Vous avez des questions? Nous pouvons vous aider. Pour communiquer directement avec un auteur, consultez la
première page de la revue dans laquelle son article a été publié afin de trouver ses coordonnées. Si vous n’arrivez pas à les repérer, communiquez avec nous à PublicationsArchive-ArchivesPublications@nrc-cnrc.gc.ca.
Questions? Contact the NRC Publications Archive team at
PublicationsArchive-ArchivesPublications@nrc-cnrc.gc.ca. If you wish to email the authors directly, please see the first page of the publication for their contact information.
NRC Publications Archive
Archives des publications du CNRC
This publication could be one of several versions: author’s original, accepted manuscript or the publisher’s version. / La version de cette publication peut être l’une des suivantes : la version prépublication de l’auteur, la version acceptée du manuscrit ou la version de l’éditeur.
Access and use of this website and the material on it are subject to the Terms and Conditions set forth at
Effects of tire - pavement contact pressure distributions on the
response of asphalt concrete pavements
Yue, Z. Q.; Svec, O. J.
https://publications-cnrc.canada.ca/fra/droits
L’accès à ce site Web et l’utilisation de son contenu sont assujettis aux conditions présentées dans le site LISEZ CES CONDITIONS ATTENTIVEMENT AVANT D’UTILISER CE SITE WEB.
NRC Publications Record / Notice d'Archives des publications de CNRC:
https://nrc-publications.canada.ca/eng/view/object/?id=021eb9c5-51e3-4982-8dcc-f3dd74c72e0d https://publications-cnrc.canada.ca/fra/voir/objet/?id=021eb9c5-51e3-4982-8dcc-f3dd74c72e0dhttp://www.nrc-cnrc.gc.ca/irc
Effe c t s of t ire - pa ve m e nt c ont a c t pre ssure dist ribut ions on t he
re sponse of a spha lt c onc re t e pa ve m e nt s
N R C C - 3 8 8 6 4
Y u e , Z . Q . ; S v e c , O . J .
O c t o b e r 1 9 9 5
A version of this document is published in / Une version de ce document se trouve dans:
Canadian Journal of Civil Engineering,
22, (5), pp. 849-860, October 01, 1995
The material in this document is covered by the provisions of the Copyright Act, by Canadian laws, policies, regulations and international agreements. Such provisions serve to identify the information source and, in specific instances, to prohibit reproduction of materials without written permission. For more information visit http://laws.justice.gc.ca/en/showtdm/cs/C-42
Les renseignements dans ce document sont protégés par la Loi sur le droit d'auteur, par les lois, les politiques et les règlements du Canada et des accords internationaux. Ces dispositions permettent d'identifier la source de l'information et, dans certains cas, d'interdire la copie de documents sans permission écrite. Pour obtenir de plus amples renseignements : http://lois.justice.gc.ca/fr/showtdm/cs/C-42
849
Effects of tire - pavement contact pressure
distributions on the response of asphalt
concrete pavements
Zhong
QiVue and Otto
J.
Svec
Abstract: The paper presents the development of a computer programVIEM for the elastic analysis of multilayered elastic pavements under the action of arbitrary tire-pavement contact pressure
distributions. The techniques adapted inVIEMprimarilyinvolves the use of a two-dimensional numerical integration to integrate point load solutions over the distributed pressure after discretizing the contact area into a finite number of triangular or quadrilateral elements. Values of contact pressure are inputted at the node points of discretized area. Numerical verification ofVIEMindicates that numerical solution ofhigh accuracy caD be efficiently calculated for the elastic response of multilayered asphalt pavements.
As a result, the determination of displacements and stresses (strains) can be achieved using a personal computer. With the use ofVIEM, a theoretical investigation is further perfonned to illustrate the effects of tire-pavement contact pressure distributions on the response of asphalt concrete pavements. An in situmeasured tire - pavement contact pressure distribution is utilized in the investigation. The response of asphalt concrete pavements due to the action of this measured contact pressure distribution is examined and compared with that due to the action of a unifonn and circular contact pressure distribution by taking into account the influences of moduli and thicknesses of structural layers. The results of this investigation confirm theoretically a general consensus that details of the contact pressure distribution affect stresses and strains near the surface of the pavement, whereas the response in the lower layers depends mainly on the overall load. In particular, the contact pressure distributions have a significant effect on the horizontal tensile strains at the bottom of thin asphalt concrete layer which control the fatigue failure of asphalt pavements.
Key words: tire-pavevment interaction, three-dimensional stress analysis, asphalt concrete pavements, numerical integration, multilayered elastic solids, point load solution.
rセウオュセ : Cet article traite du developpement du programme infonnatiqueVIEM pour I'analyse de chaussees elastiques multicouches soumises
a
une repartition arbitraire des pressions de contact pneu-chaussee. Les techniques incorporees au programmeVIBMont recours principalementa
I'integration numerique bidimensionnelle de solutions de charge ponctuelle apres la discretisation de la surface de contact en un nombre fini d'elements triangulaires et quadrilateraux. Les valeurs des pressions de cOntact sont saisies aux points de Doeud la surface discretisee. Laverification effectuee par VIEMindique qu'une solution numerique de grande precision peut eire calcutee efficacement pour la reponse elastique de chaussees d'asphalte multicouches. Consequemment, il est possible de determiner les deplacements et les contraintes (deformations)it l'aide d'un ordinateur personnel. Vne analyse theorique a ete effectue. pour illustrer les effelS de la repartition des pressions de contactpneu-chaussee sur Ie comportement de chaussees en beton bitumineuxit I'aide de VIBM. UDe repartition mesuree sur Ie terrain a ete utilisee dans cette analyse. Lareponse des chaussees en beton bitumineux soumises
a
I'action de cette repartition est・ク。ュゥョセ et comparee it la reponse de chaussees soumises it une repartition des pressions de contact uniformes et circulaires, en tenant compte des influences des modules et des epaisseurs des couches constituantes. Les resultats de cette analyse confinnent que des details de Ia repartition des pressions de contact influent sur les contraintes et les deformationsa
proximite de Ia surface delachaussee, alars que la reponse au niveau des couches inferieures depend surtout de la charge globale. De maniere plus precise, la repartition des pressions de contact a un effetReceived June 21, 1994. Revised manuscript accepted January 11, 1995.
Z.Q. Vue andO.J. Svec. Infrastructure Laboratory, Institute for Research in Construction, National Research Council Canada, Ottawa, ON KIA OR6, Canada.
Written discussion of this paper is welcomed and will be received by the Editor until February 29, 1996 (address inside front cover). Can. J. Civ. Eng. 22: 849-860 (1995). Printed in CanadaIImprime au Canada
850 Can.J. Civ. Eng. Vol. 22, 1995 Y,
important sur lesdeformations horizontales dues
a
la traction, dans la partie inferieure de la couche deb6ton bitumineux qui controle la d6faillance des chauss6es d'asphalte caus6e par la fatigue,
Mots eles : interaction poeu -chaussee, analyse tridimensionnelle des contraintes, chaussees en beton
bitumineux, integration numerique, solideselastiques multicouches, solutions de charge ponctuelle.
[Traduit par la r6daction)
1. Introduction
A vehicle meets the pavement at the tire -pavement inter-face. Tire-pavement contact pressure is the interaction stress between the rolling tire and pavement over an imprint area at the tire-pavement interface due to the action of vehicle axle load. Conventional approach in structural design and analysis of asphalt concrete pavements assumes that the vertical component of the contact pressure is uniformly dis-tributed over a circular imprint area and is nominally equal to the tire inflation pressure (Monismith 1992). The assump-tion of uniformly circular contact pressure distribuassump-tion seems to be adequate for asphalt pavement design and simplifies considerably the theoretical relationships of pavement perform-ance used by highway engineers. However, considerable experimental evidence exists to suggest that this assumption is not always valid (e.g., Marshek et al. 1986a; Tielking and Roberts 1987; de Beer 1994). For instance, field measure-ments by Huhtala and Pihlajamaki (1990) indicated that the highest contact pressure was in the middle of a tire-pavement contact area and could be 20%,35%, and 60% higher than the tire inflation pressures at I, 0.75, and 0.5 MPa, respec-tively. The measured truck tire - pavement contact pressures were nonuniformly distributed over noncircular imprint areas. Furthermore, the characteristics of tires used in vehicles have changed dramatically since the 1962 AASHO road test (Morris 1987), The AASHO road test developed the relation-ships between the traffic and pavement damage and formed the empirical basis of pavement design and truck regula-tion. The test vehicles predominantly used bias-ply tires to 0.55 MPa (80 psi) cold air inflation pressure at that time. At present, radial-ply tires predominate on heavy trucks, and tire inflation pressures of 0.69-0.76 MPa (100-110 psi) are typical. New tire designs, such as low prome tires and wide base single tires to replace the dual tires, are gaining acceptance. Such changes of tire characteristics have an impact on the pavement performance and complicate the study of effects of tire - pavement contact pressure on the pavement response.
A number of authors, including Christison et al. (1978), Marshek et al. (1986a, 1986b), Chen et al. (1986), Roberts (1987), Uzan and Sides (1987), Christison (1989), Krarup (1991), and Groenendijk et al. (1994), have measured Or cal-culated the influences of tire-pavement contact pressure on the stresses and strains in asphalt concrete pavements. It is a general consensus that details of the contact pressure distri-butions affect stresses and strains near the surface of the pavements, whereas the response in the lower layers depends mainly on the overall load.
The objective of the present study is to further investigate the effects of tire - pavement contact pressure distribution on the response of asphalt concrete pavements using a new computer program VIEM. The computer program VIEM,
developed at the Infrastructure Laboratory, is based on an analytical solution of a multilayered elastic solid subjected to a general surface traction (yue 1995). A typical contact pres-sure distribution meapres-sured by Huhtala and Pihlajamaki (1990) is used in the investigation, This contact pressure distribution was measured between a truck tire and an asphalt concrete pavement at the truck speed of 50 kmlh. The responses of asphalt concrete pavements due to the actions of either the measured contact pressure distribution Or a uniform circular contact pressure distribution are calculated using the com-puter programVIEMwith a PC 486 DX66, The results of the critical displacements and strains and stresses in the asphalt concrete pavements due to the two contact pressure distribu-tions are presented and compared by taking into account the influences of structural layer moduli and thicknesses. The results presented in the paper show that the computer pro-gram VIEM can be applied to the calculation of pavement responses under actual contact pressure distributions and that the contact pressure distributions have a significant effect on the strains and stresses in the surface layer.
2. Theoretical background and computer
program
VIEMMany computer programs such as BISAR, ELSYM, CHEV,
PDMAP, VESYS, CHEVIT, and CIRCLY have been developed to calculate the responses of multilayered elastic pavement sys-tems subjected to traffic loading (Monismith 1992). One of the main constraints associated with these well-known com-puter programs in pavement engineering is that the applied contact pressure has to be distributed over either one Or mOre circular areas and the load distribution over each cirCUlar area has to be uniform, Consequently, these computer pro-grams cannot be directly applied to the evaluation of pave-ment response when the tire - pavepave-ment contact pressure is nonuniforrnly distributed over a noncircular contact area.
For example, Marshek et al. (1986b) approximated a laboratory measured contact pressure to a nonuniform con-centric circular pressure distribution and used the computer programRISARin conjunction with superposition principle to calculate the asphalt pavement response. Later, Chen et al, (1986) re-evaluated the effects of contact pressure distribu-tion on pavement response using a three-dimensional (3-D) finite element approach, A linear elastic, static, finite ele-ment program called TEXGAP-3D was used in the analysis in Order to accommodate the nonuniform and noncircular con-tact pressure distribution measured statically from a labora-tory test. This problem was further examined by Uzan and Sides (1987) using a numerical integration technique. The theoretical results of layered elastic systems given by Schiff-man (1962) were utilized in the calculation of asphalt pave-ment response under a point load condition. The point load results were then used together with superposition principle
to dl tr th Po. ti tl la II
I:
p
c'f!
II 11 ds
1:
a
p t tYue and Svec 851 m n
=
1: 1:
P(HS" tj),セHsャL
tj» i=l j=lr
1r
1 = j -1j -1ーHセHウL t), セHウL t» X G(x - Hs, t), Y- セHウL t), z) XIJ(s, t)1 ds dt X G(x - セHsゥG t), Y - セHsゥL tj)' z) X IJ(s" tj)IWiWjwhere IJ(s, t)1 is the determinant of the Jacobian matrix; S,
andtj are the Gauss points;WiandWjare the Gauss weights;
and m and n are the Gauss integration numbers for the local coordinates
s
and t, respectively. Similar formulae can be written for the case of a six-node triangular element (see, for example, Bickford 1990).The following interpolation equations govern the relation-ship between the global coordinatesHセLセI and the local coor-dinates (s, t).
where L = 6 or 8; HセOL セOI are the node coordinates in the global coordinate system;N/(s, t) (l = 1,2, ... ,L) are the nondimensional interpolation functions of the six-node trian-gular or the eight-node quadrilateral elements and can be easily found in many finite element method textbooks (see, for eXanlple, Bickford 1990).
The applied contact pressure distributionーHセL セI over a triangular Or quadrilateral element canbeapproximated using the pressure values at the node points; I.e.,
L
[5]
ーHセLセI
= p(t(s, t),セHウL
t))=
1:
p/N/(s, t)l=1
wherep/(l
=
1,2, ... ,L)are the inputted pressure values at the node points.It is noted that the point load solution G(x, y, z) has the singularities ofl/Rand I/R2 asR =
../x
2+
y2+
Z2- 0for displacements and stresses, respectively. As a result, the 2-D integrals in [1] for displacements and stresses become improper integrals as the evaluation point (x, y, z) is very close to the tire - pavement contact area A at the surface of the pavement(z
=
0). Numerical errors couldbeinduced to the results (in particular, of the stresses) if the numerical integrations described above are directly applied (Sharma and Rao 1984; Uzan and Sides 1987). Special techniques are required to overcome the problem of improper integrals. For eXanlple, the closed-form solution for the singular terms in the point lOad solutionGI.;c, y, z) as 0 S z/hl<
I (wherehI is the thickness of the first layer) given by Yue (1995) can be used to treat the numerical problem. One mayanalyti-cally integrate the parts of the integrals [1]- [3] associated with the singular terms.
1 L
セ
=Hs,
t) =1:
セ[nゥHsL
t) 1=1 Lセ
=
セHウL
t) =1:
セ[nOHウL
t) 1=1 [4] to numerically integrate the solution for the pavement responsedue to a nonuniform and noncircular contact pressure dis-tribution. A 4 X 4 Gauss quadrature scheme was adopted in the calculation of the two-dimensional (2-D) integration. Accurate results could be obtained. Yet, one of the limita-tions, as stated in the paper (Uzan and Sides 1987), was that the solution may not converge in some cases of very thick layers. Tielking and Roberts (1987) and Roberts (1987) modified the finite eiement code ILLIPAVE developed by Duncan et al. (1968) to allow a nonuniform and noncircular pressure distribution to be calculated. The tire-pavement contact pressure was numerically evaluated from a static finite element tire model. One of the advantages of using
ILLIPAVE was that the moduli of nonstabilized pavement layers could be modelled as stress-sensitive materials.
The above literature review reveals that there is a need to develop a simplified computational procedure to calculate stably and accurately the stresses and deformation in multi-layered elastic pavements due to the action of nonuniform and noncircular contact pressure. As a result, a computer progranl VIEM has been developed for this purpose and can
be used in a personal computer. The analytical solution given by Yue (1995) for the 3-D response of a multilayered elastic solid subjected to a concentrated point traction is used in the computational scheme. Verification given in the report (Yue 1995) shows that there is no problem in the numerical evaluation of the point load solution G(x, y, z) with high accuracy and efficiency. In particular, the singularity of the point load solution in a multilayered elastic solid was expressed in exact closed-form (in terms of elementary func-tions). The solution S(x, y, z) for the 3-D response of a mUltilayered elastic pavement subjected to an arbitrary tire-pavement contact pressure p(x,y) can be expressed as follows in a Cartesian coordinate system(x, y, z) using the superposition principle.
[I] S(x, y, z) =
IL
ーHセL
セIgHク
-セL
y -セL
z)、セ 、セ
where the 2-D integration limit A is the imprint area. Inorder to numerically calculate the 2-D integral [I], a concept of discretization technique, similar to that used in finite element methods, is adopted (e.g., Sharma and Rao 1984; Bickford 1990). The imprint (contact) area is discre-tized into triangular and (or) quadrilateral elements. The solutionS(x,y,z)([I]) is then equal to the summation of the integralslk(x, y, z)over the discretized triangular or quadri-lateral elements Ak (k = I, 2, ... , N).
N
[2] S(x, y, z) =
1:
!t(x, y, z)k-l
Two isoparanletric elements, Le., the six-node triangular element and the eight-node quadrilateral element, are used to numerically calculate the integrals !tl.;c, y, z) over the dis-cretized triangular and quadrilateral elements, respectively. For eXanlple, the following formulae are applicable to an eight-node quadrilateral element.
[3] lk(x, y, z) =
I I
ーHセL
セIgHク
-セL
Y -セL
z)、セ 、セ
A. j•
1 j•
p
d
!££L
852
-p
r
[6] S(r, z) = - '
J
<I>(p, zla)Jm(Prla)J1(p) dp7fa2 0
increase in the discretization elements does not improve the accuracy of the numerical results for strains (or stresses). In particular, in the case of 88 elements, the relative errors between the exact and numerical solutions are 0.1% and 0.9% for the strains evaluated at the points (z = 10 mm,
r
=
0; or zla=
101150=
0.067, r=
0) and (z=
0,r
=
155mm; orzla=
0,ria=
1551150=
1.033), respec-tively. For the maximum tensile strain at the bottom of the asphalt concrete (AC) layer(z=
100mm, r=
0), the rela-tive errors between the exact and numerical solutions are less than 0.037% in the cases of 12 and 20 elements.The exact solutions of displacements and strains in Tables 1-4 are calculated using the following solution expression in a cylindrical coordinate system (Yue 1995) and were verified using the computer program BLSYMS.
where P, is the applied total load; a is the radius of a cir-cular contact area; Jm is the Bessel function of the orderm (m = 0, 1, 2); <I> are the analytical kernel functions of a multilayered elastic system (Yue 1995). The absolute and (or) relative errors of the semi-infinite integration are 10-6
Can. J. Civ. Eng. Vol. 22, 1995
v
Table 1. Vertical displacements (mm) along the vertical axis 1
wherer
=
O.•
Numerical solutionswiththe element number of
Exact Z solution 12 20 36 88 0.0 0.71921 0.71834 0.71846 0.71724 0.71906 10.0 0.72115 0.72088 0.72069 0.72049 0.72114 15.0 0.72185 0.72141 0.72134 0.72166 0.72185 25.0 0.72277 0.72225 0.72226 0.72281 0.72277 50.0 0.72257 0.72206 0.72206 0.72248 0.72256 75.0 0.71912 0.71861 0.71861 0.71902 0.71912 100.0 0.71225 0.71174 0.71174 0.71215 0.71225 200.0 0.63719 0.63672 0.63672 0.63709 0.63719 350.0 0.56975 0.56932 0.56932 0.56966 0.56974
Table 2. Vertical displacements (mm) along the radial axis
where z =
o.
Numerical solutions with the element number of Exact r solution 12 20 36 88 25.0 0.71694 0.71787 0.71521 0.71538 0.71639 50.0 0.71018 0.71138 0.70950 0.70951 0.71071 100.0 0.68390 0.68460 0.68308 0.68359 0.68444 150.0 0.64015 0.63933 0.63927 0.63984 0.64007 155.0 0.63426 0.63382 0.63381 0.63419 0.63426 160.0 0.62908 0.62862 0.62862 0.62899 0.62907 165.0 0.62413 0.62366 0.62366 0.62403 0.62413 175.0 0.61464 0.61416 0.61417 0.61454 0.61463 185.0 0.60547 0.60500 0.60501 0.60538 0.60547 200.0 0.59213 0.59167 0.59167 0.59204 0.59213 300.0 0.51233 0.51194 0.51194 0.51225 0.51233
-
... r---","\
r\
\
\
(d)
Fig. 1. Discretizations of a circular area using(a) 12,(b) 20,
(c) 36, and (d) 88 elements.
(a)
3. Numerical verification of
VIEMIn the ensuing, a numerical example is given to verify the above discretization technique. In this example, the tire-pavement contact pressure is uniformly distributed over a circular area at the surface of a three-layered elastic pave-ment. The total applied load is 40leN and the radius of the circular contact area is 150 mm. The moduli of the three layers (from top to bottom) are EI = 3000, E2
=
250, andE3
=
50 MPa. The Poisson ratios are PI=
0.35, P2=
0.3,and P3
=
0.4. The thicknesses of the first and second layersare selected ash,
=
100 andh2=
250mm. The third layer, I.e., the subgrade is an elastic halfspace. The interface between any two connected layers is perfectly bonded. The circular imprint area is discretized into 12,20, 36, or 88 ele-ments with 3, 5, 9, or 22 eleele-ments in a quarter as shown in Fig. 1. The numerical results presented in this paper are oniy those for vertical displacements and radial normal strains in the pavement along the vertical axis (r = 0) and the radial axis (z = 0) using the integration order of 4 X 4.Tables 1 and 2 illustrate the results of the vertical displace-ments along the vertical axis and the radial axis, respec-tively. Comparing with the exact solutions, the data presented in Tables 1 and 2 demonstrate that very accurate results can be achieved for displacements at any location of the multi-layered elastic pavement using the discretization techniques. Increase in the discretization elements improves the accuracy of the numerical results for displacements. In particular, in the case of 88 elements, the relative errors between the exact solutions and the numerical results are less than 0.03% for the displacements at any point in the pavement. In the case of 12 elements, the relative errors are less than 0.2
%.
The results of the radial normal strains are presented in Tables 3 and 4. These data in Tables 3 and 4 illustrate that increase in the discretization elements improves the accuracy of the numerical results for strains (or stresses) provided that the valuation point is not located within the tire -pavement contact area at the surface of the pavements. Yet if the evaluation point is located within the contact area, the
•
Vue and Svec 853
Table 3. Radial normal strains (10-3) along the vertical axis wherer = O.
Numerical solutions withthe element number of
Exact
z
solution 12 20 36 88 0.0 -0.32423 -0.28591 -0.28591 -0.28601 -0.28603 10.0 -0.25415 -0.23848 -0.24353 -0.30327 -0.25394 15.0 -0.22100 -0.21039 -0.21981 -0.24993 -0.22137 20.0 -0.18895 -0.18591 -0.18931 -0.19878 -0.18902 25.0 -0.15788 -0.15768 -0.15810 -0.15828 -0.15788 30.0 -0.12766 -0.12805 -0.12770 -0.12510 -0.12766 50.0 -0.01276 -0.01278 -0.01273 -0.01178 -0.01276 75.0 0.12775 0.12773 0.12773 0.12783 0.12775 100.0 0.28163 0.28155 0.28155 0.28162 0.28163 200.0 0.24412 0.24398 0.24398 0.24409 0.24412 350.0 0.34854 0.34830 0.34830 0.34849 0.34854Table 4. Radial normal strains (10-') along the radial axis where
z
=
O.Numerical solutions withthe element number of
Exact r solution 12 20 36 88 25.0 -0.31883 -0.56934 -0.23884 -0.20631 -0.23799 50.0 -0.30273 -0.58382 -0.25607 -0.22706 -0.54917 100.0 -0.24142 -0.43818 -0.26538 -0.21836 -0.48787 150.0 -0.11899 -0.11905 -0.12346 -0.11994 -0.10040 155.0 -0.07474 -0.07787 -0.08044 -0.07384 -0.07406 160.0 -0.06858 -0.06693 -0.06747 -0.06724 -0.06862 165.0 -0.06240 -0.06107 -0.06118 -0.06197 -0.06241 175.0 -0.05011 -0.04977 -0.04978 -0.05011 -0.05011 185.0 -0.03823 -0.03814 -0.03814 -0.03823 -0.03823 200.0 -0.02170 -0.02166 -0.02166 -0.02169 -0.02170 300.0 0.03665 0.03664 0.03664 0.03665 0.03665 セ
s
:I,
"e
,-,s nr-m
a ld -6in calculation of the exact solutions.
In general, high accuracy and efficiency can be achieved for the numerical solutions using the discretization technique (VIEM). The accuracy of the numerical solutions increases rapidly as the distance of the evaluation location to the tire - pavement contact area increases.Ifit is necessary, spe-cial techniques should be adopted to accurately evaluate strains and stresses at the evaluation point located within the tire - pavement contact area at the surface of a multilayered pavement. Similar observations can be obtained for the numerical solutions using the integration order of 3 X 3. It is also noted that it requires about 7 s CPU time in a PC486 DX66 for VIEM to calculate the displacements and stresses and strains at a point (say,
r
= 0 andz
= 0) using the 36 element discretization of the circular area with the Gauss integration order of 4 X 4 (the total Gauss points are 432). The remainder of this paper will be focused on the applica-tion ofVIEMto evaluation of the pavement response under a measured tire-pavement contact pressure distribution.4. A measured contact pressure
distribution
Figure 2 illustrates a 3-D tire-pavement contact pressure distribution used in the analysis. This is an approximate
simulation of the road measurement conducted by the Road and Traffic Laboratory, the Technical Research Centre of Finland (VTT) (Huhtala andpゥィi。ェセ。ォゥ 1990). The contact pressure was measured between the front tire of a truck and the pavement at the 50km/h truck speed using a dynamic contact stress (pressure) measuring device. The axle load was 60 kN. The front tire was a bald radial tire and the cold air inflation pressure was 0.75 MPa. The contact pressure distribution is not symmetric. The tire imprint is longer on the right-hand side facing the traffic direction. The highest stress in the middle of the contact area is about 35% greater than the tire cold air inflation pressure. This measured con-tact pressure distribution is noted as MCP in the following analysis, for simplicity. For the purpose of comparison, the conventional tire-pavement contact pressure distribution (CCP), where the contact pressure is equal to the tire cold air inflation pressure (0.75 MPa) and is uniformly distributed over a circular area of 225.68 mm in 、ゥセ・エ・イL is also employed. The total load for both contact pressure distribu-tions (I.e., MCP and CCP) is 30 kN.
Typical three or four structural layers of asphalt pave-ments are selected for analyses. The mechanical properties of each structural layer are characterized by the effective elastic modulus Ej and the Poisson ratio Vj, where the
•
EPWnmZYWYTIiPC 'T"T ''T T"Tt· '" 7 .7 . &854 Can, J, Civ, Eng. Vol. 22, 1995 'y
Fig. 2. Distribution of a measured tire-pavement contact pressure and the Cartesian coordinates: (a) 3-D pressure distribution; (b)tire imprint area.
(a)
(b)
QセイMMMMMMMMML 90 -90 Ii o s MQセP -I 50 -, 20 - 90 -6(l -30 0 30 60 90 120 1SO(b)
ISO 120 90 60 セ E 30 E ....-r.n 0'x
c -30 I >. -60 -90 -'20 -120 -ISO Miセo -120 -90 -60 -30 0 30 60 90 120 UO -90Fig. 3. 3-D response of a three-layer asphalt pavement induced by a measured tire-pavement contact pressure (MCP): (a) surface deflection contour (mm); (b)major horizontal strain contour at the bottom of asphalt concrete layer (x 10-4) .
(0 )
fiO en 0 )(?
-30 >. 120 1セo 90 ... E 30 E x-axis (mm) x-axis (mm)layer is noted as hj' For a three-layer system, the asphalt
concrete (AC), base, and subgrade layers are noted byj =
1,2.
and 3, respectively. For a four-layer system, the AC, base, subbase, and subgrade layers are noted byj=
1,2,3. and 4. respectively. An elastic halfspace representation is assumed for the subgrade. The interface between any two connected layers is assumed to be perfectly bonded.A Cartesian coordinate system is used in the analysis (Fig. 2). The
x
and y axes are parallel to the transverse and longitudinal directions of the pavement respectively, while the z-axis represented pavement depth. The positive direction of the y-axis is the traffic direction. The origin of the Carte-sian coordinates is located exactly at the loading centre ofthe experimentally measured contact pressure distribution.s.
3-D response of an asphalt concrete
pavement
Numerical results presented below illustrate the 3-D response of a typical three-layer asphalt pavement subjected to the measured tire-pavement contact pressure distribution (MCP). The material property and the thickness of each layer are selected as the same of those in the verification example of Sect. 3.
Figure3a shows the contour of the vertical deflections at
the surface of the pavement and Fig. 3b shows the contour
of the major horizontal strains at the bottom of AC layer. These two figures illustrate that the nonaxisymmetric response of the asphalt pavement is mainly in the local region near the
Vue and Svec 855
1.8 -t-"'-"'-""""-""T'"""T""..,--r-...,--r--r--r-.--r--!
-150 -90 -30 30 90 150
Horizontal distance from loading centre (mm)
(b)
,-... 3.4,.
0 セ -'0 3.2<
....
0 3.0a
.s
....
0 2.8 .,Q....
al l::l 2.6 .OO Glb
11.1 2.4-
.=l
=
0 2.2 セ 'oO'"'
0 ..c::l'"'
2.0 C3eaEl€)along r-axia. CCP0 - along x-axis. Mep
....
al - - along y-axia. MCP
;:e ooeoo along r-axls. CCP
- along x-axis. MCP . . . along y-axis. Mep
0.48
0.58
-150 -90 -:30 30 90 150
Horizontal distance from loadine centre (mm) 0.51
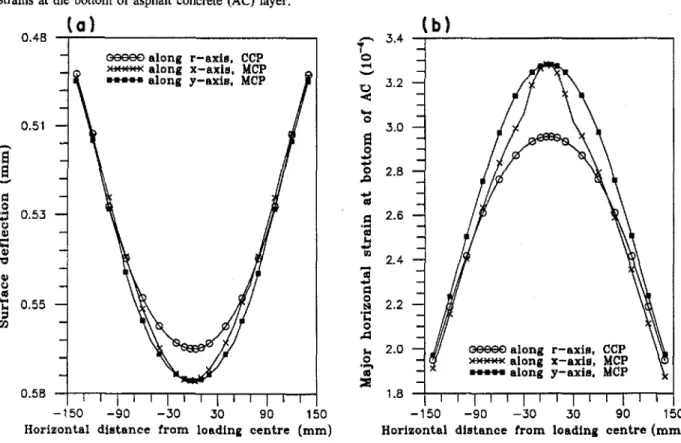
Fig. 4. Response of a three-layer pavement subjected to a measured tire-pavement contact pressure distribution (MCP) or a conventional tire -pavement contact pressure distribution (CCP): (a) surface deflections; (b) major horizontal strains at the bottom of asphalt concrete (AC) layer.
(a)
i
8
-tire-pavement contact area. The minor and major axes of the 3-D response are along the transversal and longitudinal directions of the pavement, i.e.,xand y axes, respectively.
The maximum deflection and strain are located at the loading centre, which can be respectively observed in Figs. 4a and 4b.
For the purpose of comparison, the surface deflections and the major horizontal strains at the bottom of AC layer of the pavement induced by the uniform circular contact pres-sure distribution (CCP) are also plotted in Figs. 4a and 4b, respectively. The maximum differences between the pave-ment responses induced by the two contact pressure distribu-tions (MCP and CCP) are located at the loading centre. The maximum surface deflection, the maximum tensile strain at the bottom of AC layer, and the maximum compressive strain at the top of subgrade layer induced by MCP increase respectively by 1.6
%,
11%,
and 0.5% over those induced by CCP.6. Sensitivity analysis of pavement
responses
With the use of the computer programVIEM,sensitivity
analy-ses are carried out to illustrate the effect of tire - pavement contact pressure distributions on pavement responses. At first, a sensitivity analysis of a three-layer pavement system is performed. The considered variables are the layer thick-nesseshi and h2and the layer moduli E" E2 , and E3•The
Poisson ratios(vI, V2,andV3) for the three structural layers
are assigned to be 0.35, 0.3, and 0.4 respectively for this first example. The sensitivity analysis is focused on the effect
of the two contact pressure distributions (Le., MCP and CCP) on the maximum tensile strain£tat the bottom of AC
layer and the maximum compressive strain£c at the top of
subgrade.
The effects of the structural layer thicknesses (ht andh2 )
on the pavement responses due to the MCP and the CCP are illustrated in Figs. 5-9. In these figures, the elastic moduli of the three layers (EI , E2, and E3) are fixed to be 3000,
250, and 50 MPa, respectively. Figure 5 illustrates the varia-tions of the maximum tensile strain£tat the bottom of AC
layer due to the MCP and the CCP versus the thickness of AC layer (hi)' Two base layer thicknesses HセI of 100 and 400 rom are considered. There is a so-called critical thick-ness ofhi (about 40-50 rom) at which £t is a maximum.
Below this critical thickness, the thinner the AC layer, the smaller the value of ft. At hi
=
25 rom, the percentageincreases of£tdue to the MCP over that due to the CCP are the largest ones which are equal to 82.9% and 112.6% for
h2
=
100 and 400 mm, respectively. With the increase ofhifrom 25 to 200 rom, the increases of£tdue to the MCP over
that due to the CCP are decreasing. At the critical thickness, the percentage increases are 33.0% and 43.6% for
h"
= 100 and 400 rom, respectively. Athi=
200 rom, the percentage increases are 2.64% and 3.19% forh2 = 100 and 400 rom,respectively.
The effect of the base layer thickness (h2 ) on the
maxi-miiin
tensile strain£tat the bottom of AC layer is presentedin Fig. 6, where three AC layer thicknesses(hi)of 50, 100. and 150 rom are used. With the increase ofセ from 50 to 400 rom, the percentage increases of£tdue to the MCP over
that due to the CCP are slowly increasing. At h2 = 50 rom,
.
.
856 Can. J. Civ. Eng. Vol. 22, 1995 200 OGGOO hl
=
100 mm • •••• h.=400 mm Solid line: MCP Dash line: CCP E1=3000 MPa; tll=0.35 E.= 250 MPa: '1).=0.30E,"" 50 MPa: tI,=0,40
50 100 150 hi
(mm)
ell "t:I CIil""
':-10 ::l rn....
0 g..s
-20....
(1$=
....
(1$ b-30 ll'l-
(1$ Col....
t:
ell >-40 .e
;:le
....
l< ;; -50 0Fig. 7. Maximum compressive strain at top of subgrade vs. AC layer thickness.
'b
0"-T---,
-0 -200 03S€E)h.= 100 mm ••••• h.=400 mm E1=3000 MPa; '111""0.35E.""
250 MPa; '11.=0.30 Es"" 50 MPa; '110=0.40 Solid line: MepDash line: CCP 50 100 150 hi
(mm)
u < 6....
0S
0 5 ;j 0 .D....
(1$ I:l 4....
(1$.::
rn Cll 3-
....
In I:l IV....
8
2 ;:le
....
l< III :::Il 0Fig. 5. Maximum tensile strain at bottom of AC layer vs. AC layer thickness.
MイWNNNNLNMMMMMMMMMMMMMMセ o
-0
-Fig. 6. Maximum tensile strain at bottom of AC layer vs. base layer thickness.
ooeEl€)hJ "" 50 mm ャKャKIuHセ hl=100 mm
•••••hl""150 mm
E1=3000 MPa; '111=0.35 EI ,," 250 MPa; '11.=0.30
Es= 50 MPa; 'IIs=0.40 Solid line: Mep
Dash line: CCP 400 OGGOO hI
=
50 mm JャKIeャHセ hl=100 mm ... hl=150 mm Solid line: MCP Dash line: CCP E1=3000 MPa; '1)1=0.35E.=
250 MPa; tI.=O.30Es" 50 MPa; tI,=O.40 100 200 300 h2
(mm)
0--,.---,
III "t:I CIili-
lO rn....
0 g..s
-20....
CIil=
....
(1$ b-30 lD-
(1$ Col ::l""
セ -40e
;:l8
....
l< セMUP 0Fig. 8. Maximum compressive strain at top of subgrade vs. base layer thickness .
-r
o ...; -400 100 200 300 hz (mm)
... 9 I 0 ...;-セ
....
0 7S
0::
0 .D....
CIil I:: 5....
III セ1I'J III-....
ll'l=
セ 3El
;:le
....
"
III :::Il 0the percentage increases are 18.4%, 8.0%, and 4.2% for
hi = 50, 100, and 150mID, respectively. At h
z
= 400mID, the percentage increases are 31.2%, 11.6%, and 5.7% forhI
=
50, 100, and 150mID, respectively.Figure 7 illustrates the variations of the maximum com·
pressive straintcat the top of subgrade due to the MCP and
the CCP versus the thickness of AC layer (hi)' Two base layer thicknesses (h
z)
of 100 and 400 mm are considered. The increases oft cdue to the MCP over that due to the CCPYue and Svec 857
6000
GGG€IE)E.= 50 MPa
****'ItE.=250 MPa
••••• E."'500 MPa Solid line: MCP DlIllh line: CCP hl=100 mm; 1.11=0.35 h.=250 mmi 1.1.=0.30 Es
=
50 MPa; 1.Is=0.40 1500 3000 4500 EI (MPa)o
セ
11El
o :: 9 o ,.Q....
ell=
7'f
....
IIIoS
5...
III c:l2
...
oFig. 10. Maximum tensile strain at bottom of AC layer ys. AC layer modulus. ,r13
--r---,
I C"'"'
' - ' 200 セィャBGQPP mm _ ••• hg=400 mm E.=3000 MPa; '1)."'0.35 E.= 250 MPa; 1).=0.30 Ea=
50 MPa; 1)a=0.40 Solid line: MCP Dash line: CCP 50 100 150 hI(mm)
-Tc ':::'16....
=
QJセQT
セ Q, QJ :ill=
...
=
'iii
9 セ....
11.1 III-
';J 6=
.3
§
4a
Nセ (lI 2 0Fig. 9. Maximum tensile strain in asphalt pavement ys. AC layer thickness.
le
i.
:P
are very small and slowly decreasing with the increase of hi from 25 to 200 mm. At hi
=
25 mm, the percentage increases are 45% and 0.55% for h2=
100 and 400 mm, respectively. AthI=
200 mm, the percentage increases are 0.64% and 0.16% forセ=
100 and 400 mm, respectively. The effect of the base layer thickness (h2) on themaxi-mum compressive strain £c at the top of subgrade is pre-sented in Fig. 8, where three AC layer thicknesses (hd of 50, 100, and 150 mm are used. The increases of£cdue to the MCP over that due to the CCP are very small and slowly decreasing with the increase ofh2 from 50 to 400 mm. At
h2 = 50 mm, the percentage increases are 4.3%, 2.3%, and 1.4% for hi
=
50, 100, and 150 mm, respectively. Ath2=
400 mm, the percentage increases are 0.42%, 0.28 %, and 0.19% for h1
=
50, 100, and 150 mm, respectively.It is noted herewith that the maximum horizontal tensile strains (£tmax) in the pavement may not locate at the bottom of AC layer when AC layer and (or) base layer are thin. Figure 9 illustrates the variations of EI1rulJI versus the AC
layer thickness (hi), where the results of two base layer thicknesses of 100 and 400 mm are plotted. It is observed that (i) forh2
=
100 mm, Etmaxis located at different depthswithin the base layer and (ii) for セ
=
400 mm, £trnax is located at different depths within the base layer when h1isless than about 70 mm and is located at the bottom of AC layer once hi is larger than about 70 mm. The maximum horizontal tensile strain E1max is always increasing with the decrease in h1from 200 to 25 mm. The increases ofEI1rulJI
due to the MCP over that due to the CCP are decreasing with the increase ofhifrom 25 to 200 rom. Ath1 = 50 mm, the
percentage increases of£tmaxdue to the MCP over that due
to the CCP are 6.88% and 26.96% for h2 = 100 and
400 mm, respectively. At hi = 200 mm, the percentage
increases are 0.99
%
and 3.19%
for h2 = 100 and 400 mm, respectively.The effects of the structural layer moduli (E1, E2 , and
E3) on the maximum tensile strain at the bottom of AC layer
(£,) due to the actions of the MCP and the CCP are illus-trated in Figs. 10 -12. In these three figures, the thicknesses of the AC and base layers (h1and h2) are fixed to be 100
and 250 mm, respectively. Figure 10 illustrates the varia-tions of£( due to the MCP and the CCP versus EI> where
the base layer modulus(E2) is 50, 250, or 500 MPa and the
subgrade layer modulus (E3 ) is 50 MPa. The increases off.t
due to the MCP over that due to the CCP are monotonically decreasing with the increase ofEI' At E1
=
500 MPa, thepercentage increases ofE(due to the MCP over that due to the CCP are 15.4%, 21.9%, and 32.5% for E2
=
50,250, and 500 MPa, respectively. At EI=
6000 MPa, theper-centage increases are 7.2%,8.7%, and 10.7% forE2
=
50,250, and 500 MPa, respectively.
Figure 11 illustrates the variations of£(due to the MCP and the CCP versus E2 ,where the AC layer modulus (E1) is
1000, 3000, or 6000 MPa and the subgrade layer modulus
(E3) is 50 MPa. The increases of£( due to the MCP over that due to the CCP are monotonically and slowly increasing with the increase ofE2 • At E2
=
50 MPa, the percentageincreases of£(due to the MCP over that due to the CCP
are
10.20%, 7.64%, and 6.54% for EI=
1000, 3000, and6000 MPa, respectively. Atセ
=
1000 MPa, the percent-age increases are 36.32%, 18.96%, and 13.75% for E1=
1000, 3000, and 6000 MPa, respectively.
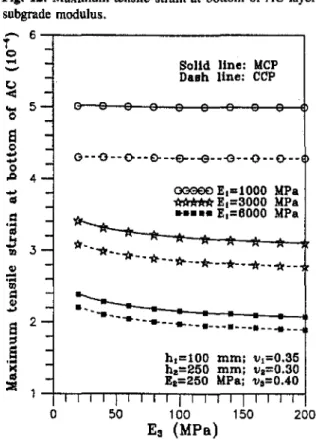
Figure 12 illustrates the variations of£t due to the MCP
and the CCP versus
E
3 ,where the AC layer modulus(£1)is1000, 3000, or 6000 MPa and the base layer modulus (£2)
is 250 MPa. The increases of£tdue to the MCP over that
, > -セ セ >. - ,- • r L ,.... セ セ " LセBG _ I
858 Can. J, Civ. Eng. Vol. 22, 1995
Solid line: Mep Dash line: CCP
ooeElE)E1=1000 MPa
***'Irk E1=3000 MPa
••••• E.=6000 MPa h.=100 mm; 1.11=0.35 h z"'250 mm; 1.Iz"'0.30 E.=250 MPa: 1).=0.40 G- -<7--()o --E>-MMe^MMセM --G- -<7. -
0--*,'...
K""A'-.
セMN セMMJB⦅NJBN -k••*--.'-
...
-
..
-
-
..
-
-.-.
-
..
-
..
-
...
'-8
セ
o セ 4...
III I::...
lUセ
:s
Fig. 12. Maximum tensile strain at bottom of AC layer vs. subgrade modulus.
T
6 Q...
-hl=100 mm; 1.11=0.35 h2"'250 mm; 1.1.=0.30 E.= 50 MPa; '11.=0.400GaE:l€)Ej=1000 MPa
セeェ]SPPP MPa ... E1=6000 MPa Solid line: MCP Dash line: CCP to) < 11
....
o8
セ
9.8
Fig. 11. Maximum tensile strain at bottom of AC layerVS.
base layer modulus.
-13-...---,
T Q ...-o
250 500 750 E2 (MPa) 1000o
50 100 150 E3 (MPa.) 200due to the CCP are very slowly increasing with the increase ofE3 •At E3
=
20 MPa, the percentage increases of£1due to the MCP over that due to the CCP are 16.58%,10.53%, and 8.20% for E1=
1000, 3000, and 6000 MPa, イ・ウー・」セtively. At E3
=
200 MPa, the percentage increases are16.60%, 11,70%, and 9.57% for £1 = 1000, 3000, and 6000 MPa, respectively.
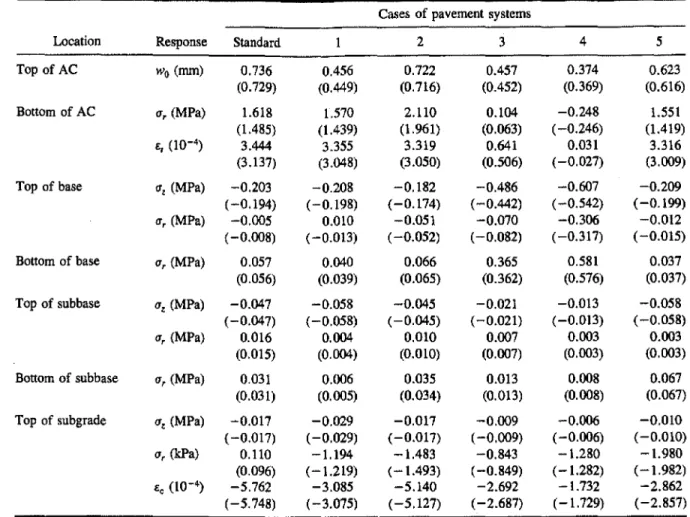
The second sensitivity analysis example is the responses of four-layer Q.avement systems subjected to the actions of the two contact pressure distributions (MCP and CCP). The results are illustrated in Table 5, where six four-layer ー。カ・セ ment systems are considered (Huang 1993). The standard case consists of an AC surface layer, a crushed stone base, a granular subbase, and a subgrade. The pavement param-eters are assigned as follows: £1
=
3500,£2=
200,E3 =100,£4
=
30 MPa; PI=
0.3, P2=
0.35, P3=
0.35, P4=
0.45; andh1
=
100,h2=
200,h3=
200 mm, andh4=
00.The other five cases of pavement systems are formulated in such a way so that each case has only one parameter different from the standard case. Case 1 has a strong subgrade with an effective elastic modulus three times greater than that of the standard case, i.e., E4
=
90 MPa. In case 2, all layers are assumed incompressible, i.e., PI=
P2=
P3=
P4 =0.5. The granular base is replaced by an asphalt base with
£2= 2000 MPa in case 3 and by a cement-treated base with £2
=
6000 MPa in case 4. In case 5, a five-layer system is used with the top 350 rom of the subgrade of the standard case replaced by a lime-stabilized layer withE4=
150 MPa and P4=
0.45.The comparisons of effects due to the MCP and the CCP are focused on the pavement responses at the surface and interfaces. The variables of the pavement responses include
(i) the maximum surface deflection, wo; (ii) the maximum tensile strain£1at the bottom of the AC layer; (iii)the
maxi-mum vertical normal stress Uz at each interface; (iv) the maximum radial normal stresses Urat the top and bottom of
each layer; and(v)the maximum vertical compressive strain £cat the top of the subgrade. The following observations can be made from the digital results in Table 5.
(a) The values of Wo due to the MCP are slightly larger than those due to the CCP for all the six cases (less than 1.5%).
(b) The values of£1and(Jrat the bottom of the AC layer
due to the MCP are more than 7
%
higher than those due to the CCP for all the cases except case 4. In case 4, the values of£1andUrat the bottom of the AC layer due to the CCP arenegative, which indicates that the bottom of the AC layer is not in tension horizontally under the action of the CCP. Besides, although£1at the bottom of the AC layer due to the MCP is positive, it is very small (0.031 X 10⁻⁴); and (Jris
negative (= -0.027).
(c) For all six cases, the values of Uz at the interface
between AC and base layers due to the MCP are more than 4.6% higher than those due to the CCP.
(d) At the interfaces between the base and subbase layers, the increases ofUzand(Jrdue to the Mep over those due to
the CCP are very small.
(e) At the interfaces between the subbase and subgrade layers, there are almost no differences in the values ofUz
and Ur due to the MCP and the CCP. In partiCUlar, the
values of£cdue to the MCP are less than 0.5% higher than those due to the CCP.
7. Conclusions and recommendations
The paper presents the theoretical background for the devel-opment of a computer program VIEM using a discretization technique. Numerical verification presented in the paper
Vue and Svec
Table 5. Sensitivity analysis of pavement responses due to two contact pressure distributions (MCP and CCP). Cases of pavement systems
Location Response Standard 2 3 4 5
Top of AC wQ(mm) 0.736 0.456 0.722 0.457 0.374 0.623 (0.729) (0.449) (0.716) (0.452) (0.369) (0.616) Bottom of AC (J, (MPa) 1.618 1.570 2.110 0.104 -0.248 1.551 (1.485) (1.439) (1.961) (0.063) (-0.246) (1.419) E.,(10-4) 3.444 3.355 3.319 0.641 0.031 3.316 (3.137) (3.048) (3.050) (0.506) (-0.027) (3.009)
Top of base f1l (MPa) -0.203 -0.208 -0.182 -0.486 -0.607 -0.209
(-0.194) (-0.198) (-0.174) (-0.442) (-0.542) (-0.199)
(Jr(MPa) -0.005 0.010 -0.051 -0.070 -0.306 -0.012
(-0.008) (-0.013) (-0.052) (-0.082) (-0.317) (-0.015)
Bottom of base (J,(MPa) 0.057 0.040 0.066 0.365 0.581 0.037
(0.056) (0.039) (0.065) (0.362) (0.576) (0.037)
Top of subbase (Jl (MPa) -0.047 -0.058 -0.045 -0.021 -0.013 -0.058
(-0.047) (-0.058) (-0.045) (-0.021) (-0.013) (-0.058)
(Jr(MPa) 0.016 0.004 0.010 0.007 0.003 0.003
(0.015) (0.004) (0.010) (0.007) (0.003) (0.003)
Bottom of subbase flr (MPa) 0.031 0.006 0.035 0.013 0.008 0.067
(0.031) (0.005) (0.034) (0.013) (0.008) (0.067)
Top of subgrade fll (MPa) -0.017 -0.029 -0.017 -0.009 -0.006 -0.010
(-0.017) (-0.029) (-0.017) (-0.009) (-0.006) (-0.010)
flr (kPa) 0.110 -1.194 -1.483 -0.843 -1.280 -1.980
(0.096) (-1.219) (-1.493) (-0.849) (-1.282) (-1.982)
E.e(10-4) -5.762 -3.085 -5.140 -2.692 -1.732 -2.862
(-5.748) (-3.075) (-5.127) (-2.687) (-1.729) (-2.857)
Note: Numbersinparentheses are due to the CCP. other numbers are due to the MCP.
859
s
11
e
:r
indicates that VIEMcan be used to accurately and efficiently calculate the elastic response of multilayered pavements due to the action of arbitrary tire-pavement contact pressure dis-tributions. With the use ofVIEM; a theoretical investigation is further performed to illustrate the effects of tire - pavement contact pressure distributions on the response of asphalt con-crete pavements.An
in situ
measured tire-pavement contact pressure distribution is utilized in the investigation.The results of this investigation confirm theoretically the general consensus that the details of the contact pressure dis-tributions affect stresses and strains near the surface of the pavement, whereas the response in the lower layers depends mainly on the overall load. In particular, the contact pressure distributions have a significant effect on the horizontal tensile strains at the bottom ofAC layer which control the fatigue failure of asphalt pavements.
The unifonn and circular contact pressure distribution commonly used in pavement design and analysis may under-estimate the tensile strain at the bottom of AC layer.
Finally, it is recommended that VIEM can be further applied to the analysis of instrumented pavement response under the action of actual contact pressure distributions.
Acknowledgements
The authors would like to thank the referees for their con-structive comments which enhanced the presentation of this paper.
R.ferences
Bickford, W.B. 1990. A first course in finite element method. Richard D. Irwin, Inc., Boston, Mass.
Chen, H.H., Marshek, K.M., and Saraf, C.L. 1986. Effects of truck tire contact pressure distribution on the design of flexible pavements: a three-dimensional finite element approach. Transportation Research Board, National Research Council. Washington, D.C., Transportation Research Record 1095, pp.72-78.
Christison, J.T. 1989. Pavement response/tire pressure study. Alberta Research Council, Edmonton, Alta., Report No. HTE 89/07.
Christison, LT., Anderson, K.O., and Shields, B.P. 1978. In situ measurements of strains and deflections in a full-depth asphaltic concrete pavement. Proceedings ofthe Association of Asphalt Paving Technologists, Lake Buena Vista, Fla.• Vol. 47, pp. 398-433.
de Beer, M. 1994. Measurement of tire/pavement interface stresses under moving wheel loads. Reprint, Third Conference on Vehicle-Road and Vehicle-Bridge Interaction, June 5
-to,
Noordwijkerhout, The Netherlands. Research Report DPVT 224, Pavement Engineering Technology, Division of Roads and Transport Technology, CSIR, P.O. Box 395, Pretoria 001, South Africa.
Duncan. J.M., Monismith, C.L., and Wilson, E.L. 1968. Finite element analysis of pavements. Highway Research Board, Washington, D.C., Highway Research Record 228, pp. 18-33. Groenendijk, J., Vogelzang, C.H., Molenaar, A.A.A., and Dohmen. L.J.M. 1994. Performance tests under accelerated
セ[ZBGGイGGGGGGGMG\ - ...,- .
-",
860 Can. J. Civ. Eng. Vol. 22, 1995
z
y f tmax R Sj (or fj) S(r, z) Wo Wj xList of symbols
a radius of a circular contact area
A imprint area
Eo elastic modulus of the jth layer
C(x, y, z) point load solution of a multilayer elastic solid
hj thickness of thejthlayer
Ik(x, y, z) integral over discretized triangular or quadri-lateral elementsAk(k = 1, 2, ,N)
positive integer (l, 2, 3, 4, 5, )
Bessel function of the orderm (m
=
0, 1, 2) determinant of the Jacobian matrixGauss integration number for the local coor-dinate
s
(or t)nondimensional interpolation functions of the six-node triangular (or the eight-node quadri-lateral) element, (l
=
1, 2, ... , 6 (or 8» arbitrary tire - pavement contact pressure dis-tributioninputted pressure values at the node point l (l =
1, 2, ... , 6(or 8» total tire load
radial coordinate of a cylindrical coordinate system
"Jx2
+
y2+
Z2Gauss point
axisymmetrical solution of a pavement subject
to a uniform circular contact pressure
Sex, y. z) solution of a multilayer elastic pavement subject to surface traction
maximum surface deflection Gauss weight
independent variable of the x-axis in a Cartesian coordinate system
independent variable of the y-axis in a Cartesian coordinate system
independent variable of the z-axis in a Cartesian or cylindrical coordinate system
maximum compressive strain at the top of subgrade
maximum tensile strain at the bottom of asphalt concrete layer
maximum horizontal tensile strains in the pavement
analytical kernel functions of a mUltilayer elastic system
node coordinate in the global coordinate system Poisson ratio of the jth layer
maximum radial normal stresses at the top and bottom of each structural layer
maximum vertical normal stress at each interface
p(x, y) PI j Jm
II(s,
f)1 m (orn)loading with the L1NTRACK test facility in the Netherlands. Proceedings of the Fourth International Conference on Bearing Capacity of Roads and Airfields, Minneapolis, Minn., July, pp. 1163-1179.
Huang, Y.H. 1993. Pavement analysis and design. Prentice-Hall, Englewood Cliffs, NJ .
Huhtala, M., and Pihlajamaki, J. 1990. Truck tires and pavements. Proceedings of the Third International Conference on Bearing Capacity of Roads and Airfields, Trondheim, Norway, July, pp. 669-679.
Krarup, J. 1991. Instrumentation for a full-scale pavement test in the Danish road testing machine.InRoad and airport pavement response monitoring system. Edited by V.C. Janoo and R.A. Eaton. American Society of Civil Engineers, New York. pp. 96-111.
Marshek, K.M., Chen, H.H., Connell, R.B., and Hudson, W.R. 19800. Experimental determination of pressure distribution of truck tire-pavement contact. Transportation Research Board, National Research Council, Washington, D.C., Transportation Research Record 1070, pp. 9-14.
Marshek, K.M., Chen, RH., Connell, R.B., and Saraf, C.L.
1986b. Effect of truck tire inflation pressure and axle load on flexible and rigid pavement performance. Transportation Research Board, National Research Council, Washington, D.C., Transportation Research Record 1070, pp. 14-21.
Monismith, C.L. 1992. Analytical based asphalt pavement design and rehabilitation: theory to practice, 1962-1992. Transporta-tion Research Board, NaTransporta-tional Research Council, Washington, D.C., Transportation Research Record 1354,pp. 5-26.
Morris, J.R. 1987. Effect of heavy vehicle characteristics on pavement responses and performance - phase I. National Cooperative Highway Research Program, Transportation Research Board, Washington, D.C., Report No. 1-25,August. Roberts, F.L. 1987.Flexible pavement strains caused by auto tires. ASCE Journal of Transportation Engineering, 113:471-483.
Schiffman, R.L. 1962. General analysis of stresses and displace-ments in layered elastic systems. Proceeding of International Conference on the Structural Design of Asphalt Pavements. University of Michigan, Ann Arbor, Mich., August, pp.
369-384.
Sharma, K.G., and Rao, V.G. 1984. Stresses and displacements in an elastic mass due to distributed loading by discretization tech-nique. Imemational Journal for Numerical and Analytical Methods in Geomechanics, 8:427-444.
Tielking, J.T., and Roberts, P.L. 1987. Tire contact pressure and its effect on pavement strain. ASCE Journal of Transportation Engineering, 113:56-250.
Uzan, J., and Sides, A.1987.The effect of contact area shape and pressure distribution on multilayer systems response. Transpor-tation Research Board, National Research Council, Washington, D.C., Transportation Research Record 1117,pp. 21-24.
Yue, Z.Q. 1995. On elastostatics of multilayered solids subjected to general surface traction. Quarterly Journal of Mechanics and Applied Mathematics. In press.