HAL Id: hal-02956386
https://hal.inrae.fr/hal-02956386
Submitted on 7 Oct 2020
HAL is a multi-disciplinary open access
archive for the deposit and dissemination of sci-entific research documents, whether they are pub-lished or not. The documents may come from teaching and research institutions in France or abroad, or from public or private research centers.
L’archive ouverte pluridisciplinaire HAL, est destinée au dépôt et à la diffusion de documents scientifiques de niveau recherche, publiés ou non, émanant des établissements d’enseignement et de recherche français ou étrangers, des laboratoires publics ou privés.
Distributed under a Creative Commons Attribution - NonCommercial - NoDerivatives| 4.0 International License
Laëtitia Perrin, Benjamin Allès, Chantal Julia, Denis Lairon, Serge Hercberg,
Mathilde Touvier, Julia Baudry, Emmanuelle Kesse-Guyot
To cite this version:
Laëtitia Perrin, Benjamin Allès, Chantal Julia, Denis Lairon, Serge Hercberg, et al.. Organic food consumption and Gluten-free diet, is there a link? results in French adults without celiac disease. British Journal of Nutrition, Cambridge University Press (CUP), In press, pp.1-37. �10.1017/S0007114520003323�. �hal-02956386�
This peer-reviewed article has been accepted for publication but not yet copyedited or typeset, and so may be subject to change during the production process. The article is considered published and may be cited using its DOI
10.1017/S0007114520003323
The British Journal of Nutrition is published by Cambridge University Press on behalf of The Nutrition Society
Organic food consumption and Gluten-free diet, is there a link? results in French adults without celiac disease
Authors
Laëtitia Perrin1, Benjamin Allès1, Chantal Julia1,2, Serge Hercberg1,2, Mathilde Touvier1, Denis Lairon3, Julia Baudry1 and Emmanuelle Kesse-Guyot1
Job titles:
Laëtitia Perrin: biostatistics Master
Benjamin Allès: Researcher in nutritional epidemiology Chantal Julia: Associate Professor in Nutrition, MD, PhD Serge Hercberg: Professor of Nutrition and Public Health
Mathilde Touvier: Head of the Nutritional epidemiology research team (EREN) Denis Lairon: Researcher in nutrition
Julia Baudry: Researcher in nutritional epidemiology
Emmanuelle Kesse-Guyot: Senior Researcher in nutritional epidemiology Affiliations:
1
Université Paris 13, CRESS – EREN (Nutritional Epidemiology Research Team) INSERM, INRA, CNAM, 74 rue Marcel Cachin, 93017 Bobigny, France
2
Public Health Department, Avicenne Hospital, AP-HP, 93017 Bobigny, France
3 , INSERM (U1062), INRA (U1260), C2VN, Faculté de Médecine
de la Timone, 27 boulevard Jeab Moulin, 13005 Marseille, France
https://www.cambridge.org/core
. INRAE - Toulouse
, on
07 Oct 2020 at 14:39:06
, subject to the Cambridge Core terms of use, available at
https://www.cambridge.org/core/terms
.
Corresponding author: Emmanuelle Kesse-Guyot, PhD
Nutritional Epidemiology Research Team (CRESS-EREN U1153 Inserm / U1125 Inra / Cnam / Paris 13 University)
SMBH Paris 13, 74 rue Marcel Cachin F-93017 Bobigny Cedex. France Tel: +33 1 48 38 89 79 E-mail: e.kesse@eren.smbh.univ-paris13.fr Word count: 4,486 Tables: 5 Figures: 2 Supplemental tables: 1
Running Head: gluten avoidance and organic food Clinical trial register number: NCT03335644
https://www.cambridge.org/core
. INRAE - Toulouse
, on
07 Oct 2020 at 14:39:06
, subject to the Cambridge Core terms of use, available at
https://www.cambridge.org/core/terms
.
ABSTRACT
The rising popular belief that gluten is detrimental for health has led to growth in gluten avoidance in people without celiac disease. Little information is available on their dietary profiles and their behavior regarding other specific dietary-related features. Our aim was to compare the consumption of organic foods between gluten avoiders and non-avoiders, and their places of food purchase. We described their sociodemographic and dietary profiles. The study population included participants of the NutriNet-Santé cohort who both completed a food exclusion questionnaire and an organic semi-quantitative food frequency questionnaire (n=23,468). Food intake and organic food consumption ratios were compared using ANCOVA models adjusted for age, sex and energy intake. Associations between gluten avoidance and organic food consumption as well as places of food purchase were investigated with multivariable logistic regression. Participants avoiding gluten were more likely to be women and had a healthier dietary profile. Organic food consumption was higher among gluten avoiders (48.50% of total diet for total avoiders, 17.38% for non-avoiders). After adjustments for confounders, organic food consumption and purchase in organic stores were positively associated with gluten avoidance: aOR Q5 vs Q1 organic food=4.95, 95% CI=3.70-6.63 and aOR organic stores vs supermarkets=1.82, 95% CI=1.42-2.33 for total avoiders. Our study highlights that individuals who avoid gluten are high organic consumers and frequently purchase their foods in organic stores which propose an extended offer of gluten-free food. Further research is needed to determine the underlying common motivations and the temporality of the dietary behaviors of healthy people avoiding gluten.
https://www.cambridge.org/core
. INRAE - Toulouse
, on
07 Oct 2020 at 14:39:06
, subject to the Cambridge Core terms of use, available at
https://www.cambridge.org/core/terms
.
INTRODUCTION
Initially, the gluten-free diet (GFD) is a medical response for people with celiac disease (CD), a systemic autoimmune disorder for which GFD is the only available effective treatment. This diet involves excluding foods that contain the protein gluten, including wheat barley and rye. Its prevalence is estimated at 0,8% in Western countries(1). However, in the last decade, the adherence to a GFD has considerably increased, outside a diagnosis of CD(2–5). Indeed, many studies have reported that people who avoid gluten today are mostly healthy people(2,6–16). The two main motives reported for avoiding gluten among subjects without celiac disease are that gluten may trigger intestinal and/or extraintestinal symptoms, and that gluten is considered better for health. The first group referred to non-celiac gluten sensitivity population (NCGS) also considered as population suffering from gluten-related disorders(17). This disorder is characterized by symptoms related to gluten, but no biomarkers have been identified and the diagnosis is mainly based on self-declaration. For these people, following a gluten-free diet is beneficial and reduces their symptoms. For the second group, media, and celebrities, as well as high-level athletes, contribute to the popularity of gluten avoidance by claiming its possible health benefits, including weight loss(6,7,18). Indeed, studies investigating motives related to gluten avoidance have shown that one quarter to one third of avoiders put forward the belief of a health benefit(9–11). However, so far, there is no scientific consensus that gluten avoidance would be beneficial for the general population(6,19). In the meantime, the market of gluten-free food has considerably grown: +28% between 2004 and 2011(20), and +34% between 2009 and 2014 in the USA(21), and +10.4% between 2014 and 2019 in Europe(22). In addition, gluten-free product offer is particularly important in specialized organic stores who generally offer a broader range of alternative products(23). One may ask whether gluten avoidance is associated with other considered healthy food choices, in particular organic food consumption. It is important to identify their behaviors to be able to clearly determine their impact on health. In
https://www.cambridge.org/core
. INRAE - Toulouse
, on
07 Oct 2020 at 14:39:06
, subject to the Cambridge Core terms of use, available at
https://www.cambridge.org/core/terms
.
previous studies, including ours(24,25), it has been shown that individuals avoiding gluten adopt an overall healthier food profile with greater consumption of fruits and vegetables, and fewer sweetened beverages. Christoph et al.(25) also reported that individuals considering organic products healthy were 4 times more likely to consider also gluten-free food healthy, like those who favor unprocessed products (6 times more). However, in this study, organic and unprocessed products were evaluated using a unique question concerning the importance for participants to eat organic (or unprocessed) food, with 4 modalities of answers.
In addition, the role of organic food on health is not well documented and definition greatly varied in the literature. Some authors used more or less accurate question about frequencies while other quantitatively estimated organic food consumption. Their consumption reduces exposure to pesticides, and some studies show better nutritional intake, but often their consumption is accompanied by other healthy behaviors such as physical activity(26). However, organic foods are considered as healthy and some places of purchase are the same(27) thus we hypothesize that gluten avoiders may also be organic food consumers.
The aim of the present study was therefore to compare the consumption of organic products (as a whole and by food group) in individuals (partially or totally) avoiding gluten or not, and their places of food purchases of organic food.
MATERIALS AND METHODS Study population
Participants are adult volunteers from the NutriNet-Santé study, a web-based observational prospective open cohort study launched in May 2009 in France. This study aims to investigate the relationship between nutrition and health, as well as the determinants of dietary patterns and nutritional status. The design and methodology of the NutriNet-Santé study have been previously described in detail elsewhere(28). At inclusion in the cohort and yearly thereafter,
https://www.cambridge.org/core
. INRAE - Toulouse
, on
07 Oct 2020 at 14:39:06
, subject to the Cambridge Core terms of use, available at
https://www.cambridge.org/core/terms
.
participants completed a set of self-administered questionnaires on dietary intake, health and anthropometric, sociodemographic and lifestyle characteristics. Participants were also regularly invited to complete optional complementary questionnaires.
Ethics
The NutriNet-Santé study is conducted according to the guidelines from the Declaration of Helsinki and was approved by the ethics committee of the French Institute for Health and Medical Research (IRB Inserm no. 0000388FWA00005831) and by the National Commission on Informatics and Liberty (CNIL no. 908450 and no. 909216). All subjects signed an electronic informed consent. This study is registered in ClinicalTrials.gov (NCT03335644). Data collection
Definition of participants with gluten free-diet
Between September and December 2016, participants were asked to complete an optional questionnaire inquiring food exclusions and their underlying motives. The questionnaire included three parts relating to the exclusion of 83 types of foods, specific diets and their motivations, and allergies. In this questionnaire, the following question was asked: « Do you
exclude products containing wheat/barley/rye/oats (gluten) from your diet? » and the possible
responses were « yes totally/yes partially/no ». Three groups were defined: total avoiders, partial avoiders or non-avoiders.
Participants reporting a celiac disease (CD) were excluded from the present study. Participants were considered to have a CD if they answered within the framework of the food exclusions questionnaire, « yes » to the question « Do you have a celiac disease? » and if they reported a medical diagnosis o o h yp of “d g o ” on questions «Diagnosed by a
general practitioner, a specialist, a dietician?» or when they reported a CD in whichever
yearly health questionnaire.
https://www.cambridge.org/core
. INRAE - Toulouse
, on
07 Oct 2020 at 14:39:06
, subject to the Cambridge Core terms of use, available at
https://www.cambridge.org/core/terms
.
Sociodemographic and lifestyle data
At baseline and yearly thereafter, sociodemographic, anthropometric and lifestyle characteristics were collected. These characteristics included sex, age, height, weight, education level, occupational category, monthly income, smoking status and physical activity (measured by the International Physical Activity Questionnaire(29,30)). The baseline questionnaires were pilot-tested and compared against traditional assessment methods(31,32) as well as clinical measurement for anthropometric data(33). The monthly income per household unit was calculated by dividing monthly income by consumption units (CU) where the first adult in the household represents 1 CU, other persons older than 14 years represent 0.5 CU, and other persons younger than 14 years represent 0.3 CU, following national statistics methodology and guidelines of the French National Institute of Statistics and Economics Studies (INSEE)(34). Body Mass Index (BMI) (in kg/m2) was calculated as the ratio of weight to squared height and then classified following the WHO guidelines.
Dietary data and Organic Food Consumption
An optional organic food semi-quantitative frequency questionnaire (Org-FFQ) was proposed to the cohort participants (June - December 2014). This questionnaire is originally based on an original validated FFQ(35) and has been described elsewhere(36). Participants were asked to report their frequency of consumption and portion sizes over the past year for 264 food and beverage items. The portion sizes for each food consumed were estimated according to standard measurements (e.g., home containers, grams displayed on the package or photographs available via the interactive interface). These photographs came from a validated picture booklet(37). The frequency of consumption referred to usual consumption over the past year on an increasing scale including yearly, monthly, weekly or daily units, as suitable. Participants had to provide only one answer and selected an average portion size using validated photographs. Then consumptions were translated as daily quantity.
https://www.cambridge.org/core
. INRAE - Toulouse
, on
07 Oct 2020 at 14:39:06
, subject to the Cambridge Core terms of use, available at
https://www.cambridge.org/core/terms
.
From the 264 food items, 33 food/beverage groups were designed on a nutritional basis. To estimate the level of organic food consumption in the diet, participants indicated for each item how often the consumption was organic through a 5-point ordinal scale ranging from « never » to « always ». The modalities were weighted as follows: 0, 0.25, 0.50, 0.75 and 1, respectively(36). From the whole diet, we calculated the average daily intake (in g/day). The contribution of organic food consumption in the diet was then calculated by dividing the total organic food intake (g/day) by the total food intake (g/day), excluding water. This ratio was multiplied by 100 to obtain the contribution of organic food consumption as a percentage of weight. Nutrient intakes were estimated using a published nutrient database(38). Only participants with a plausible energy intake were included in the analyses, the over-reporters and under-reporters were excluded. They were identified by a ratio of energy intake to energy requirement, estimated with the Schofield equations according to sex, age and BMI(39). Energy requirement, accounting for physical activity level, was compared with energy intake. The ration between energy intake and energy requirement was calculated and participants with ratios below or above cutoffs previously identified (below 0.35 or above 1.93) were excluded. To assess the adherence to the nutrient-based French recommendations, the probability of adequate nutrient intake (PANDiet) was computed(40). This 100-point score represents the average of two sub-scores: the adequacy sub-score estimating the proportion of adequacy for 21 items for which the usual intake should be above a reference value, multiplied by 100, and the moderation sub-score corresponding to the proportion of adequacy for six items for which the usual intake should not exceed a reference value, multiplied by 100.
Place of food purchase
Place of purchase for each organic food was collected from an optional questionnaire on consumer attitudes and motives (July 2014 - January 2015). Places of purchase were grouped
https://www.cambridge.org/core
. INRAE - Toulouse
, on
07 Oct 2020 at 14:39:06
, subject to the Cambridge Core terms of use, available at
https://www.cambridge.org/core/terms
.
into 5 classes: hard discount, grocery stores, shopping centers, markets and organic stores. Participants had to select a place of purchase for each food group (across a maximum of 30 food groups). Then, for each place, the proportion of purchase has been calculated: the number of responses for each place was summed and divided by the number of total responses. Next, the purchase place with the highest proportion was considered as the main place of purchase. Since this questionnaire was optional, analyses were performed on a sub-sample (N=16,885). A total of 1,002 persons had multiple places with the same proportion of purchase. For these participants, we considered shopping centers as the main place (the most frequented place in the overall sample).
Statistical analysis
Sociodemographic, lifestyle characteristics and places of purchase were described (using means, SDs or percentages) among total gluten avoiders, partial gluten avoiders and gluten non-avoiders. P-values referred to chi-square test or one-way ANOVA test, depending on the type of variable.
Macronutrients were assessed by computing the percentage of energy intake from carbohydrates, lipids, and proteins. Micronutrients intakes were adjusted for energy intake using the residual method(41). Consumption of 33 food groups, macronutrients and micronutrients intake were reported as mean values and 95% Confidence Intervals (CI) using an analysis of covariance (ANCOVA), adjusted for age and sex, and for food groups for daily energy intake. Micronutrients intakes were adjusted for energy intake using the residual method(41). Contribution of organic foods to each food group (ratios with their SDs) are also provided and were adjusted for age, sex and total consumption of food group.
The proportion of total organic food consumption was categorized into quintiles to assess the association between the type of diet and organic food consumption. With regard to gluten-free avoiding, three categories were considered: 1) overall gluten-free diet that included all
https://www.cambridge.org/core
. INRAE - Toulouse
, on
07 Oct 2020 at 14:39:06
, subject to the Cambridge Core terms of use, available at
https://www.cambridge.org/core/terms
.
individuals avoiding gluten whether or not they followed any other diets, 2) gluten-free diet only that included only participants who avoided gluten but did not follow any other diet and 3) participants who followed both gluten-free and lactose-free diets. A multivariable polytomic logistic regression model was performed. Adjusted Odds Ratios (aOR) with their 95% CI are presented. The model was adjusted for age, sex, education level (no diploma or primary studies/secondary studies/higher educational level), occupational category (9 classes), com (<1200 € p C /1200–2300 € p C />2300 € p C ), mok g u ( smoker/former smoker/occasional smoker/regular smoker), physical activity (low, moderate, high) and total daily energy intake without alcohol.
Two multivariable polytomic logistic regression models were also performed to assess the association between gluten avoidance and place of purchase of organic foods. The first model was adjusted for sociodemographic confounding factors, namely age, sex, education level, occupational category, income level, smoking status and physical activity. The second model was further adjusted for organic food consumption to more clearly determine the role of gluten avoidance in the choice of place of purchase. Sensitivity analyses were performed using multivariable logistic regression models focusing on place of purchase. In order to ensure that the choice of the main place of purchase for people who had more than one did not influence the model (shopping centers in principal analysis), we also performed the same set of analysis using markets as the main place of purchase for these individuals.
Two-sided tests and a p value <0.0001 were used for statistical significance, given the high number of statistical tests performed and the large sample size. All statistical analyses were performed using SAS software (version 9.4, SAS Institute, Inc., Cary, NC, USA).
https://www.cambridge.org/core
. INRAE - Toulouse
, on
07 Oct 2020 at 14:39:06
, subject to the Cambridge Core terms of use, available at
https://www.cambridge.org/core/terms
.
RESULTS Sample selection
Of the initial 121,266 participants who received the optional questionnaire on food exclusions, a total of 34,781 completed it. Within this sample, we excluded participants who reported a diagnosed CD, with missing sociodemographic data and living overseas, and those who did not completed the Org-FFQ. The final sample available for analysis included 23,468 individuals (Figure 1) including 499 total gluten avoiders, 2,023 partial avoiders, and 20,946 non-avoiders. The percentage of participants avoiding gluten in this study was 10.75%, 2.13% of whom totally excluded gluten.
Sociodemographic and individual characteristics
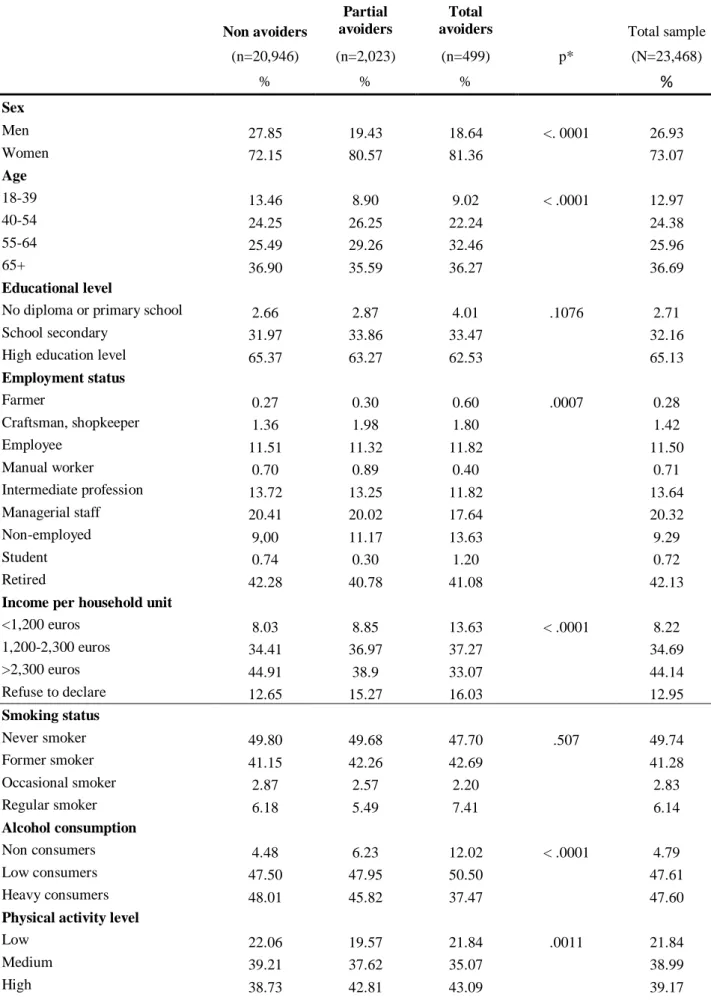
Table 1 presents sociodemographic and lifestyle characteristics of the participants according to the gluten avoidance, as well as for the whole sample. Participants avoiding gluten were more likely to be women, between 55 and 64 years old, single, non-employed, physically active, to have lower monthly income per household unit, to be low alcohol consumers and to present less obesity. No difference regarding education level and smoking status was observed across the gluten avoidance groups.
Partial and total avoiders showed some differences: partial avoiders were more frequently in the age group between 40 and 64 years. Total avoiders were less likely to be managerial staff or to belong to an intermediate profession than partial and non-avoiders. Partial avoiders did not have a lower income per household unit, but they were in the middle class.
Participants avoiding gluten were more likely to report having allergies. The percentage of individuals self-reporting allergies increased along with the avoidance of gluten in the diet. Gluten avoiders were also more likely to adhere to another specific diet, especially lactose-free diet, but also the vegetarian diets or both.
https://www.cambridge.org/core
. INRAE - Toulouse
, on
07 Oct 2020 at 14:39:06
, subject to the Cambridge Core terms of use, available at
https://www.cambridge.org/core/terms
.
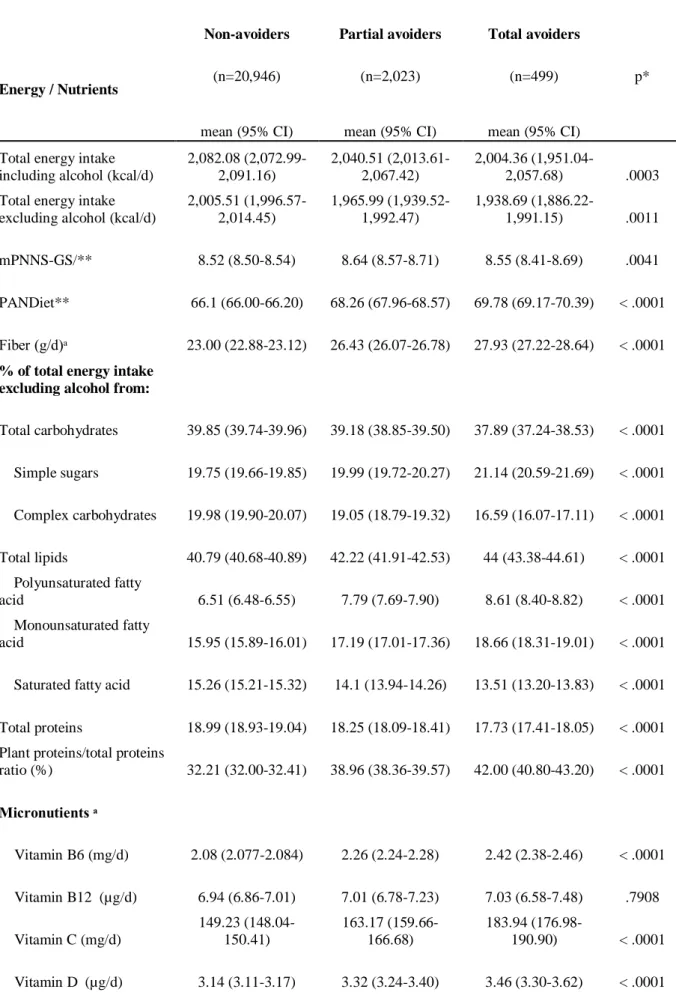
Nutritional characteristics
Table 2 presents nutrient intake across gluten avoidance groups. First, total energy intake decreased as gluten is avoided. Individuals avoiding gluten also exhibited a lower overall protein intake but a higher proportion of vegetable protein relative to total intake, a higher polyunsaturated fatty acid (PUFA) and monounsaturated fatty acid (MUFA) intake as well as a lower saturated fatty acid intake. As regards nutrients, levels increased or decreased along with the avoidance of gluten. Intake of total carbohydrates and complex carbohydrates were lower among individuals avoiding gluten while sugars and fiber intake was higher. Partial avoiders had an intake of simple sugars lower than total avoiders, but similar to non-avoiders. Regarding micronutrients, gluten avoiders exhibited healthier nutritional profiles with, for instance, higher intake of C, D, E vitamins and folate. For minerals, people avoiding gluten also exhibited a higher intake of magnesium, potassium, copper and iron. On the opposite, they showed a lower intake of calcium, sodium, phosphorus, zinc, and heme-iron. As for macronutrients, a gradient was observed from total avoiders to avoiders or from non-avoiders to total non-avoiders, as appropriate, except for magnesium, iron and heme-iron. Intake of magnesium, iron and heme-iron were no different between total and partial avoiders. Concerning the adherence to the French nutritional references, gluten avoiders exhibited healthier dietary patterns with a higher PANDiet score (total avoiders > partial avoiders > non-avoiders, p<.0001).
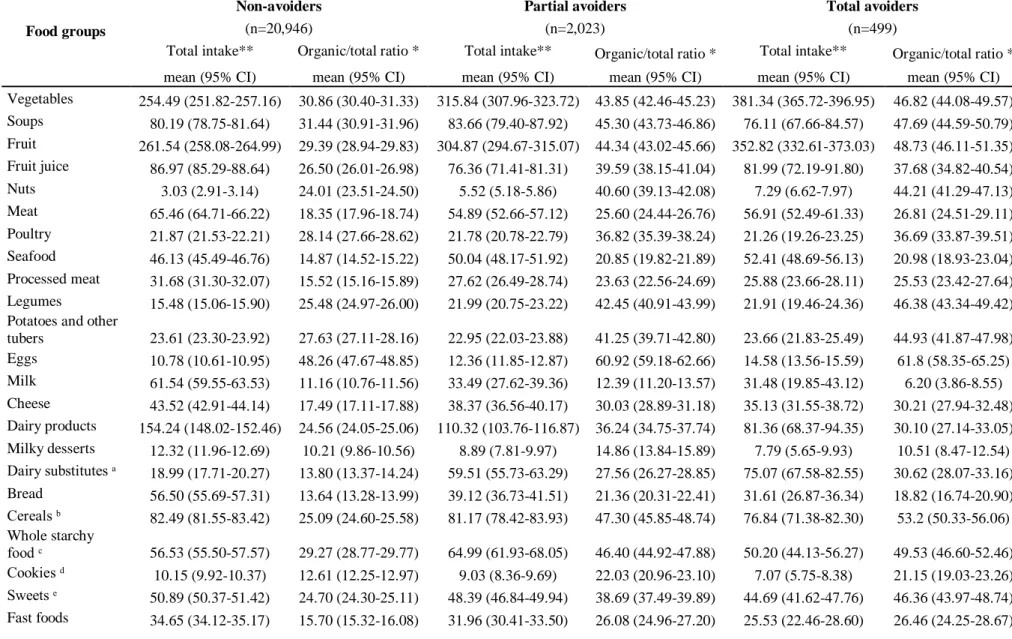
Food intakes and level of organic food consumption
Individuals avoiding gluten (partial or total) showed a higher consumption of foods mostly consumed as unprocessed (vegetables, fruits, legumes, fish, eggs, nuts, oils) and a lower consumption of fatty and/or sweet processed foods (processed meat, cookies, sweet, fast food, dressing and butter and sweet beverages) compared to non-avoiders (Table 3). They also exhibited a lower consumption of meat and dairy products and higher consumption of their
https://www.cambridge.org/core
. INRAE - Toulouse
, on
07 Oct 2020 at 14:39:06
, subject to the Cambridge Core terms of use, available at
https://www.cambridge.org/core/terms
.
substitutes than non-avoiders. Specifically, partial avoiders had a higher consumption of whole starchy food and soups, and lower consumption of fruit juices. However, snacks products were largely consumed by individuals avoiding gluten (1.5 to 2 times more).
The proportion of organic food in the diet was significantly higher among people avoiding gluten. Overall, 48.50% of total avoiders and 40.04% of partial avoiders consumed more than 50% of products coming from organic production in their diet, compared with 17.38% of non-avoiders (data not tabulated).
Individuals avoiding gluten consumed a higher proportion of organic foods for most food groups compared with non-avoiders except for dairy products. Partial avoiders differed from total avoiders by a higher proportion of organic food for dairy products, bread and butter. Among gluten avoiders (total or partial), food group for which the contribution of organic food exceeded 40% for both groups were eggs, fruits, vegetables, legumes, nuts, potatoes, whole starchy food, cereals, oils and non-alcoholic drinks (coffee, tea, chocolate, except soda).
Table 4 shows the association between exclusion diets and consumption of organic foods. Compared to non-avoidance, gluten avoidance was positively associated with a higher consumption of organic foods (aOR Q5 vs Q1= 4.81 (95% CI: 4.09, 5.67) for partial gluten avoidance and aOR Q5 vs Q1= 4.95 (95% CI: 3.70, 6.63) for total gluten avoidance). Combining gluten avoidance and lactose-free diets was also strongly associated with consumption of organic products (aOR Q5 vs Q1= 9.22 (95% CI: 6.24-13.64)).
Place of purchase of individuals avoiding gluten
Gluten avoiders purchased more often organic foods in specialized organic stores compared with non-avoiders (48% of total avoiders, 42% of partial avoiders and 21% of non-avoiders) (Figure 2). In non-avoiders, supermarkets were the main place of purchase (53%), followed by markets (23%).
https://www.cambridge.org/core
. INRAE - Toulouse
, on
07 Oct 2020 at 14:39:06
, subject to the Cambridge Core terms of use, available at
https://www.cambridge.org/core/terms
.
Adjusted models for sociodemographic factors between gluten avoidance and organic food place of purchase showed that individuals purchasing mostly in organic stores were more likely to avoid gluten [organic stores vs supermarkets: OR= 2.64 (95% CI: 2.35, 2.97) for partial gluten avoiders, and OR= 3.47 (95% CI: 2.78, 4.34) for total gluten avoiders] (Table 5). A positive association was also observed between total gluten avoiders and organic food purchase in hard discount. Other food purchase place showed no association with gluten avoidance.
Further adjustment for total organic food consumption showed similar but attenuated association for organic stores. In contrast, the relationship between total gluten avoidance and purchase in hard discount slightly increased. Sensitivity analyses, replacing markets by shopping centers as the reference on 1,002 exaequo data, showed similar results for the two models (Table Supplemental 1).
DISCUSSION
The present study is one of the first to consider the association between the contribution of organic food in the diet among a large sample of individuals and the avoidance of gluten using detailed dietary data. We found a marked positive association between gluten avoidance and contribution of organic food to the diet. A gradient was also observed with total avoiders consuming more of organic food than partial avoiders. This contribution was higher for all types of products, except milk and dairy products. These results appear consistent with the motives reported by individuals avoiding gluten, including health: individuals without celiac disease who avoid gluten are concerned by health and adopt this behavior considered healthier(6,7,9–11). In our previous study, gluten avoiders reported as main motives physical well-being (26% and 39% for total and partial avoiders), belief of a long-term health impact (22% and 28%, respectively) and the total avoiders also reported allergy and/or intolerance
https://www.cambridge.org/core
. INRAE - Toulouse
, on
07 Oct 2020 at 14:39:06
, subject to the Cambridge Core terms of use, available at
https://www.cambridge.org/core/terms
.
(20%)(24). It seems that gluten avoidance, like the consumption of organic food(42–44), belongs to a global attitude for a healthy diet.
Sociodemographic profiles of gluten avoiders
Our study is concordant with previous works showing that gluten avoiders were more likely to be women(2,9,12,13,15,16,25) and to report multiple food intolerances and allergies(2,8,12,13,45), particularly lactose intolerance(8,12,13,45).
Sociodemographic characteristics and behaviors of organic food consumers have been widely described in the literature(46–48). We briefly reported them to identify concordance and discordance with individuals avoiding gluten. Like gluten avoiders, organic food consumers have been shown to be more likely to be women(36,46–50). We observed that gluten avoiders in comparison with non-avoiders did not show any difference concerning education level and they were older than non-avoiders (between 55 and 64 years old). Studies investigating organic food consumers showed heterogeneous results regarding age and education level: younger(51) or older(36,50). higher education level(36,52–54) or lower(55,56). Unlike our results about gluten avoiders, several studies showed that organic food consumers had higher income(36,46) and overall higher social status(50,57,58). Nevertheless, we observed differences between total and partial avoiders: partial gluten avoiders were more often managerial staff than total avoiders and their income was not low.
Outside sociodemographic characteristics, individuals avoiding gluten and organic food consumers exhibit many common lifestyle and food behaviors. Many studies reported this healthy lifestyle among organic food consumers(48,50,52,59,60). In this study, we observed that individuals avoiding gluten had similar behaviors: they were more likely to be physically active, to consume less alcohol and to be less likely to present obesity.
Dietary behaviors of individuals avoiding gluten – comparison with organic food consumers
https://www.cambridge.org/core
. INRAE - Toulouse
, on
07 Oct 2020 at 14:39:06
, subject to the Cambridge Core terms of use, available at
https://www.cambridge.org/core/terms
.
Regarding food consumption and nutrient intake, individuals avoiding gluten showed a comparable diet to organic food consumers. As individuals avoiding gluten in our study, organic food consumers had a much higher consumption of vegetables, fruits, legumes, fish and nuts and a much lower consumption of meat, processed meat, sweet and fatty products, dairy products and sweet beverages than non-avoiders(48,50,58,59,61,62). We also observed that participants who avoid gluten were characterized by a high intake of plant-based food. This feature was also observed among organic food consumers(59). Individuals avoiding gluten presented similar nutrient profiles than those observed in organic food consumers(58,61–63): they had a lower total energy intake, a higher proportion of energy from PUFA and intake of fiber, and a smaller proportion of energy from saturated fat and intake of protein. Like organic food consumers, they presented a better nutritional diet quality: the PANDiet score was highest with a gradient for more gluten avoidance. In this study, as previously reported among organic food consumers(52,58,59,63), we observed also a higher proportion of individuals reporting to be vegetarians among gluten avoiders compared with individuals who do not avoid it.
The contribution of organic food in the diet of gluten avoiders was higher for all products, except milk because its overall consumption was low. Organic food consumers reported the same trends in food groups(48): the most popular organic food groups were eggs in first, fruits and vegetables, whole starchy foods and oils, and the least popular were meat and dairy products.
The data of this study are in accordance with ones of a recent US study about people who value gluten-free products(25). In this study, individuals who value gluten-free products had healthy behaviors: they had a higher consumption of vegetables and fruits and a lower consumption of sugar-sweetened beverages as well as a higher intake of fiber and lower
https://www.cambridge.org/core
. INRAE - Toulouse
, on
07 Oct 2020 at 14:39:06
, subject to the Cambridge Core terms of use, available at
https://www.cambridge.org/core/terms
.
intake of saturated fat. Finally, they reported that individuals who value gluten-free products value also organic food, but also unprocessed food and local food.
Many characteristics are shared by people avoiding gluten and organic food consumers: they are physically active, consume less alcohol, have a higher consumption of fruit and vegetables and a lower consumption of meat. It seems that people without celiac disease avoiding gluten may be a specific group of organic food consumers. They are characterized by additional behaviors of food exclusion.
Place of purchase
The analysis of place of purchase showed that nearly half of the gluten avoiders bought organic food in organic stores against about 20% for non-avoiders. This association between gluten avoidance and purchase in organic stores remained even after adjustment for total consumption of organic food. To the best of our knowledge, no study investigated the place of purchase of products among people avoiding gluten. In fact, we had no information on the main reasons for this choice: specifically, we were not able to identify whether gluten avoiders purchase their organic food in organic stores because they prefer organic food and then buy gluten-free foods due to the large offer, or if they choose to buy gluten-free foods in organic stores due to large offer and thus also consumed organic foods. Surprisingly, we also observed an association between total gluten avoidance and purchase in hard discount which may be explained by the fact that in our study, the total gluten avoiders were more likely to have a lower income.
Strengths and limitations
Several limitations of this study should be mentioned. Firstly, the participants enrolled in our study were volunteers in a nutrition cohort and were probably more interested in nutritional issues and had healthier lifestyles issues than the general population. They exhibited particular characteristics when compared to the general French population(64,65). As the food exclusion
https://www.cambridge.org/core
. INRAE - Toulouse
, on
07 Oct 2020 at 14:39:06
, subject to the Cambridge Core terms of use, available at
https://www.cambridge.org/core/terms
.
and orgFFQ questionnaires were optional, participants excluding food and high organic food consumers were certainly more willing to fill in these questionnaires. However, the proportion of non-consumers of organic food was similar to the national figures(66). Second, all data in this study were self-reported, which may be prone to measurement errors and desirability bias(67). Thirdly, no information was available on the consumption of gluten-free substitutes and their specific nutritional values in our sample. This lack might lower estimations of nutrient intakes in gluten avoiders. Finally, due to the cross-sectional design of our study, we were not able to determine whether gluten avoidance led to a higher consumption of organic products, or if participants who had a high consumption of organic products were more likely to avoid the gluten.
This study also showed important strengths. The first was its large sample size, which provides an access to a wide diversity of dietary behaviors. It also allowed for control of potential effects of confounding factors. A further strength was the use of a Org-FFQ: it was based on a validated FFQ which had shown relative validity and reproducibility(35), and it included a very large range of foods (264 items) enabling to estimate of usual diet over the previous year. The use of the Org-FFQ enabled to provide detailed data and allowed to assess the proportion of organic foods per type of food and in the whole diet. This strength is major because the only study which related gluten avoidance and organic food was only based on the perception of foods rather than actual consumption(25).
In conclusion, the present study provides new insights into the characterization of individuals without reported celiac disease avoiding gluten. These findings underline a strong positive correlation between gluten avoidance and organic food consumption. It appears that gluten avoidance for non-celiac individuals is a subset of organic food consumers, that is often related to other specific dietary practices (vegetarians) and to adoption of healthy behaviors. It would be important to take this thought into account in future studies. Future research is needed to better understand the relationship between gluten avoidance and organic food consumption.
https://www.cambridge.org/core
. INRAE - Toulouse
, on
07 Oct 2020 at 14:39:06
, subject to the Cambridge Core terms of use, available at
https://www.cambridge.org/core/terms
.
Author’s contribution
Th u ho ’ co bu o w fo ow – LP and EKG: designed the research; BA, CB, SH, MT, CJ, DL, JB, EKG: conducted the research; LP: performed statistical analysis and drafted the manuscript; EKG: supervised statistical analysis and the writing; LP, BA, CB, SH, MT, CJ, DL, JB and EKG: contributed to the data interpretation and revised each draft for important intellectual content. All authors read and approved the final manuscript. EKG had primary responsibility for the final content, she is the guarantor.
Acknowledgements
The authors thank Cédric Agaesse (dietitian); Thi Hong Van Duong, Younes Esseddik (IT manager), Régis Gatibelza, Djamal Lamri, Jagatjit Mohinder and Aladi Timera (computer scientists); Julien Allegre, Nathalie Arnault, Laurent Bourhis and Fabien Szabo de Edelenyi, PhD (supervisor) (data-manager/statisticians) for their technical contribution to the NutriNet-Santé study and Nathalie Druesne-Pecollo, PhD (operational coordination).
We thank all the volunteers of the NutriNet-Santé cohort. Funding / Support: Financial Support:
This study is part of the GlutN project that was supported by the French National Research Agency (Agence Nationale de la Recherche) in 2017 (AAPG ANR 2017).
The NutriNet-Santé cohort study is funded by the following public institutions: Ministère de la Santé, Santé Publique France, Institut National de la Santé et de la Recherche Médicale, Institut National de la Recherche Agronomique (INRA), Conservatoire National des Arts et Métiers (CNAM) and Paris 13 University. The funders had no role in study design, data collection and analysis, decision to publish, or preparation of the manuscript. Study sponsors had no part in study design, collection, analysis, and interpretation of data and the writing of the article and the decision to submit it for publication.
Role of the sponsors: Funders played no role in the design and conduct of the study; collection, management, analysis, and interpretation of the data; and preparation, review, or approval of the manuscript.
Conflict of interest: The authors declared no support from any institution for the submitted work.
https://www.cambridge.org/core
. INRAE - Toulouse
, on
07 Oct 2020 at 14:39:06
, subject to the Cambridge Core terms of use, available at
https://www.cambridge.org/core/terms
.
1. Singh P, Arora A, Strand TA et al. (2018) Global Prevalence of Celiac Disease: Systematic Review and Meta-analysis. Clin Gastroenterol Hepatol; 16: 823-836.e2
2. Aziz I, Lewis NR, Hadjivassiliou M et al. (2014) A UK study assessing the population prevalence of self-reported gluten sensitivity and referral characteristics to secondary care. Eur J Gastroenterol Hepatol; 26: 33–39
3. Rubio-Tapia A, Ludvigsson JF, Brantner TL et al. (2012) The prevalence of celiac disease in the United States. Am J Gastroenterol; 107: 1538–44; quiz 1537, 1545
4. Kim H, Patel KG, Orosz E et al. (2016) Time trends in the prevalence of celiac disease and gluten-free diet in the US population: results from the National Health and Nutrition Examination Surveys 2009-2014. JAMA Intern Med; 176: 1716–1717
5. Choung RS, Unalp-Arida A, Ruhl CE et al. (2016) Less Hidden Celiac Disease But Increased Gluten Avoidance Without a Diagnosis in the United States: Findings From the National Health and Nutrition Examination Surveys From 2009 to 2014. Mayo Clin
Proc;
6. Gaesser GA, Angadi SS (2012) Gluten-free diet: Imprudent dietary advice for the general population? J Acad Nutr Diet; 112: 1330–1333
7. Gaesser GA, Angadi SS (2015) Navigating the gluten-free boom. J Am Acad PAs; 28: 1– 7
8. Golley S, Corsini N, Topping D et al. (2015) Motivations for avoiding wheat consumption in Australia: results from a population survey. Public Health Nutr; 18: 490–499
https://www.cambridge.org/core
. INRAE - Toulouse
, on
07 Oct 2020 at 14:39:06
, subject to the Cambridge Core terms of use, available at
https://www.cambridge.org/core/terms
.
9. Reilly NR (2016) The Gluten-Free Diet: Recognizing Fact, Fiction, and Fad. J Pediatr; 175: 206–10
10. Dunn C, House L, Shelnutt KP (2014) Consumer Perceptions of Gluten-Free Products and the Healthfulness of Gluten-Free Diets. J Nutr Educ Behav; 46: S184–5
11. Lu Z, Zhang H, Luoto S et al. (2018) Gluten-free living in China: The characteristics, food choices and difficulties in following a gluten-free diet - An online survey. Appetite; 127: 242–8
12. Cabrera-Chávez F, Granda-Restrepo DM, Arámburo-Gálvez JG et al. (2016) Self-reported prevalence of gluten-related disorders and adherence to gluten-free diet in Colombian adult population. Gastroenterol Res Pract; 2016
13. Cabrera-Chávez F, Dezar GV, Islas-Zamorano AP et al. (2017) Prevalence of self-reported gluten sensitivity and adherence to a gluten-free diet in argentinian adult population. Nutrients; 9: 81
14. Ontiveros N, Hardy MY, Cabrera-Chavez F (2015) Assessing of celiac disease and nonceliac gluten sensitivity. Gastroenterol Res Pract; 2015
15. Ontiveros N, Rodríguez-Bellegarrigue CI, Galicia-Rodríguez G et al. (2018) Prevalence of Self-Reported Gluten-Related Disorders and Adherence to a Gluten-Free Diet in Salvadoran Adult Population. Int J Environ Res Public Health; 15: 786
16. DiGiacomo DV, Tennyson CA, Green PH et al. (2013) Prevalence of gluten-free diet adherence among individuals without celiac disease in the USA: results from the Continuous National Health and Nutrition Examination Survey 2009–2010. Scand J
Gastroenterol; 48: 921–925
https://www.cambridge.org/core
. INRAE - Toulouse
, on
07 Oct 2020 at 14:39:06
, subject to the Cambridge Core terms of use, available at
https://www.cambridge.org/core/terms
.
17. Catassi C, Bai JC, Bonaz B et al. (2013) Non-Celiac Gluten sensitivity: the new frontier of gluten related disorders. Nutrients; 5: 3839–53
18. Lis DM, Stellingwerff T, Shing CM et al. (2015) Exploring the popularity, experiences, and beliefs surrounding gluten-free diets in nonceliac athletes. Int J Sport Nutr Exerc
Metab; 25: 37–45
19. Marcason W (2011) Is there evidence to support the claim that a gluten-free diet should be used for weight loss? J Am Diet Assoc; 111: 1786
20. Sapone A, Bai JC, Ciacci C et al. (2012) Spectrum of gluten-related disorders: consensus on new nomenclature and classification. BMC Med; 10: 13
21. Igbinedion SO, Ansari J, Vasikaran A et al. (2017) Non-celiac gluten sensitivity: All wheat attack is not celiac. World J Gastroenterol; 23: 7201–10
22. Elli L, Branchi F, Tomba C et al. (2015) Diagnosis of gluten related disorders: Celiac disease, wheat allergy and non-celiac gluten sensitivity. World J Gastroenterol WJG; 21: 7110
23. Lee AR, Ng DL, Zivin J, Green PHR (2007) Economic burden of a gluten-free diet. J
Hum Nutr Diet Off J Br Diet Assoc; 20: 423–30
24. Perrin L, Allès B, Buscail C et al. (2019) Gluten-free diet in French adults without coeliac disease: sociodemographic characteristics, motives and dietary profile. Br J Nutr; 1–9
25. Christoph MJ, Larson N, Hootman KC et al. (2018) Who Values Gluten-Free? Dietary Intake, Behaviors, and Sociodemographic Characteristics of Young Adults Who Value Gluten-Free Food. J Acad Nutr Diet; 118: 1389–98
https://www.cambridge.org/core
. INRAE - Toulouse
, on
07 Oct 2020 at 14:39:06
, subject to the Cambridge Core terms of use, available at
https://www.cambridge.org/core/terms
.
26. Brantsæter AL, Ydersbond TA, Hoppin JA et al. (2017) Organic Food in the Diet: Exposure and Health Implications. Annu Rev Public Health; 38: 295–313
27. Hercberg S, Castetbon K, Czernichow S et al. (2010) The Nutrinet-Santé Study: a web-based prospective study on the relationship between nutrition and health and determinants of dietary patterns and nutritional status. BMC Public Health; 10: 242
28. Hagströmer M, Oja P, Sjöström M (2006) The International Physical Activity Questionnaire (IPAQ): a study of concurrent and construct validity. Public Health Nutr; 9: 755–62
29. Craig CL, Marshall AL, Sjöström M et al. (2003) International physical activity questionnaire: 12-country reliability and validity. Med Sci Sports Exerc; 35: 1381–95
30. Touvier M, Méjean C, Kesse-Guyot E et al. (2010) Comparison between web-based and paper versions of a self-administered anthropometric questionnaire. Eur J Epidemiol; 25: 287–96
31. Vergnaud A-C, Touvier M, Méjean C et al. (2011) Agreement between web-based and paper versions of a socio-demographic questionnaire in the NutriNet-Santé study. Int J
Public Health; 56: 407–17
32. Lassale C, Péneau S, Touvier M et al. (2013) Validity of web-based self-reported weight and height: results of the Nutrinet-Santé study. J Med Internet Res; 15: e152
33. Définition - Unité de consommation | Insee (2019) Available from: https://www.insee.fr/fr/metadonnees/definition/c1802 (accessed June 2020)
34. Obesity: preventing and managing the global epidemic. Report of a WHO consultation.
World Health Organ Tech Rep Ser 2000; 894: i–xii, 1–253
https://www.cambridge.org/core
. INRAE - Toulouse
, on
07 Oct 2020 at 14:39:06
, subject to the Cambridge Core terms of use, available at
https://www.cambridge.org/core/terms
.
35. Kesse-Guyot E, Castetbon K, Touvier M et al. (2010) Relative validity and reproducibility of a food frequency questionnaire designed for French adults. Ann Nutr
Meta; 57: 153–62
36. Baudry J, Méjean C, Allès B et al. (2015)Contribution of Organic Food to the Diet in a Large Sample of French Adults (the NutriNet-Santé Cohort Study). Nutrients; 7: 8615– 32
37. Le Moullec N, Deheeger M, Preziosi P et al. (1996) Validation du manuel-photos utilisé pou ’ quê m d ’ ud S . VI. X. Cah Nutr Diététique; 31: 158–164 38. Arnault N, Caillot L, Castetbon K et al. (2013) Table de composition des aliments
NutriNet-Santé. Paris Ed Économica;
39. Schofield WN (1985) Predicting basal metabolic rate, new standards and review of previous work. Hum Nutr Clin Nutr; 39 Suppl 1: 5–41
40. Verger EO, Mariotti F, Holmes BA et al. (2012) Evaluation of a diet quality index based on the probability of adequate nutrient intake (PANDiet) using national French and US dietary surveys. PloS One; 7: e42155
41. Willett W, Stampfer MJ (1986) Total energy intake: implications for epidemiologic analyses. Am J Epidemiol; 124: 17–27
42. Ellison B, Duff BRL, Wang Z et al. (2016) Putting the organic label in context: Examining the interactions between the organic label, product type, and retail outlet.
Food Qual Prefer; 49: 140–50
https://www.cambridge.org/core
. INRAE - Toulouse
, on
07 Oct 2020 at 14:39:06
, subject to the Cambridge Core terms of use, available at
https://www.cambridge.org/core/terms
.
43. Baudry J, Péneau S, Allès B et al. (2017) Food Choice Motives When Purchasing in Organic and Conventional Consumer Clusters: Focus on Sustainable Concerns (The NutriNet-Santé Cohort Study). Nutrients; 9
44. Magnusson MK, Arvola A, Hursti UKK et al. (2003) Choice of organic foods is related to perceived consequences for human health and to environmentally friendly behaviour.
Appetite; 40: 109–17
45. Volta U, Bardella MT, Calabrò A et al. (2014) Study Group for Non-Celiac Gluten Sensitivity. An Italian prospective multicenter survey on patients suspected of having non-celiac gluten sensitivity. BMC Med; 12: 85
46. Davies A, Titterington AJ, Cochrane C (1995) Who buys organic food?: A profile of the purchasers of organic food in Northern Ireland. Br Food J; 97: 17–23
47. Aertsens J, Verbeke W, Mondelaers K et al. (2009) Personal determinants of organic food consumption: a review. van Huylenbroek G, editor. Br Food J; 111: 1140–67
48. Oates L, Cohen M, Braun L (2012) Characteristics and consumption patterns of Australian organic consumers. J Sci Food Agric; 92: 2782–7
49. Lockie S, Lyons K, Lawrence G et al. (2004) Choosing organics: a path analysis of factors underlying the selection of organic food among Australian consumers. Appetite; 43: 135–46
50. Eisinger-Watzl M, Wittig F, Heuer T et al. (2015) Customers Purchasing Organic Food - Do They Live Healthier? Results of the German National Nutrition Survey II. Eur J Nutr
Food Saf; 5: 59–71
https://www.cambridge.org/core
. INRAE - Toulouse
, on
07 Oct 2020 at 14:39:06
, subject to the Cambridge Core terms of use, available at
https://www.cambridge.org/core/terms
.
51. Moon W, Balasubramanian S, Rimal AP (2005) Agro‐biotechnology and organic food purchase in the United Kingdom. Br Food J; 107: 84–97
52. Schifferstein HNJ, Oude Ophuis PAM (1998) Health-related determinants of organic food consumption in The Netherlands. Food Qual Prefer; 9: 119–33
53. Pearson D, Henryks J, Jones H (2011) Organic food: What we know (and do not know) about consumers. Renew Agric Food Syst; 26: 171–7
54. Dettmann RL, Dimitri C (2010) Who’ buy g o g c g b ? D mog ph c characteristics of U.S. consumers. J Food Prod Mark; 16: 79–91
55. Thompson GD, Kidwell J (1998) Explaining the Choice of Organic Produce: Cosmetic Defects, Prices, and Consumer Preferences. Am J Agric Econ; 80: 277–87
56. Worsley T, Lea E (2005) u ’ o g c food b f , d mog ph c d u . Br
Food J; 107: 855–69
57. O’Do o P, cC thy M (2002) Irish consumer preference for organic meat. Br Food
J; 104: 353–70
58. Petersen SB, Rasmussen MA, Strøm M et al. (2013) Sociodemographic characteristics and food habits of organic consumers – a study from the Danish National Birth Cohort.
Public Health Nutr 2013; 16: 1810–9
59. Baudry J, Allès B, Péneau S et al. (2017) Dietary intakes and diet quality according to levels of organic food consumption by French adults: cross-sectional findings from the NutriNet-Santé Cohort Study. Public Health Nutr; 20: 638–48
60. Lockie S, Lyons K, Lawrence G et al. (2002) E g ‘G ’: o o b h d organic food consumption in Australia. Sociol Rural; 42: 23–40
61. Torjusen H, Lieblein G, Næs T et al. (2012) Food patterns and dietary quality associated with organic food consumption during pregnancy; data from a large cohort of pregnant women in Norway. BMC Public Health; 12: 612
https://www.cambridge.org/core
. INRAE - Toulouse
, on
07 Oct 2020 at 14:39:06
, subject to the Cambridge Core terms of use, available at
https://www.cambridge.org/core/terms
.
62. Pelletier JE, Laska MN, Neumark-Sztainer D et al. (2013) Positive Attitudes toward Organic, Local, and Sustainable Foods Are Associated with Higher Dietary Quality among Young Adults. J Acad Nutr Diet; 113: 127–32
63. Baudry J, Touvier M, Allès B et al. (2106) Typology of eaters based on conventional and organic food consumption: results from the NutriNet-Santé cohort study. Br J Nutr; 116: 700–9
64. Andreeva VA, Salanave B, Castetbon K et al. (2015) Comparison of the
sociodemographic characteristics of the large NutriNet-Santé e-cohort with French Census data: the issue of volunteer bias revisited. J Epidemiol Community Health; 69: 893–8
65. Andreeva VA, Deschamps V, Salanave B et al. (2016) Comparison of Dietary Intakes Between a Large Online Cohort Study (Etude NutriNet-Santé) and a Nationally Representative Cross-Sectional Study (Etude Nationale Nutrition Santé) in France: Addressing the Issue of Generalizability in E-Epidemiology. Am J Epidemiol; 184: 660– 9
66. Baromètre de consommation et de perception des produits biologiques (2018). rapport_barometre_agencebiocsa_2018.pdf. Available from:
http://www.agencebio.org/sites/default/files/upload/rapport_barometre_agencebiocsa_20 18.pdf (accessed June 2020).
67. Kesse-Guyot E, Assmann K, Andreeva V et al. (2016) Lessons Learned From
Methodological Validation Research in E-Epidemiology. JMIR Public Health Surveill; 2: e160 https://www.cambridge.org/core . INRAE - Toulouse , on 07 Oct 2020 at 14:39:06
, subject to the Cambridge Core terms of use, available at
https://www.cambridge.org/core/terms
.
N=34,165 subjects without coeliac disease
N=616 with coeliac disease
N=698 481 with missing data on socioeconomic variables 217 living overseas N=33,467 subjects with available
information on socioeconomic variables
N=9,999 did not completed the Org-FFQ
Final sample N=23,468
N=34,781 subjects completed the food exclusion questionnaire Figure 1. Flowchart of the study.
https://www.cambridge.org/core
. INRAE - Toulouse
, on
07 Oct 2020 at 14:39:06
, subject to the Cambridge Core terms of use, available at
https://www.cambridge.org/core/terms
.
Table 1. Sociodemographic and lifestyle characteristics according to gluten avoidance. Partial avoiders Total avoiders
Non avoiders Total sample (n=20,946) (n=2,023) (n=499) p* (N=23,468) % % % % Sex Men 27.85 19.43 18.64 <. 0001 26.93 Women 72.15 80.57 81.36 73.07 Age 18-39 13.46 8.90 9.02 < .0001 12.97 40-54 24.25 26.25 22.24 24.38 55-64 25.49 29.26 32.46 25.96 65+ 36.90 35.59 36.27 36.69 Educational level
No diploma or primary school 2.66 2.87 4.01 .1076 2.71 School secondary 31.97 33.86 33.47 32.16 High education level 65.37 63.27 62.53 65.13
Employment status Farmer 0.27 0.30 0.60 .0007 0.28 Craftsman, shopkeeper 1.36 1.98 1.80 1.42 Employee 11.51 11.32 11.82 11.50 Manual worker 0.70 0.89 0.40 0.71 Intermediate profession 13.72 13.25 11.82 13.64 Managerial staff 20.41 20.02 17.64 20.32 Non-employed 9,00 11.17 13.63 9.29 Student 0.74 0.30 1.20 0.72 Retired 42.28 40.78 41.08 42.13
Income per household unit
<1,200 euros 8.03 8.85 13.63 < .0001 8.22 1,200-2,300 euros 34.41 36.97 37.27 34.69 >2,300 euros 44.91 38.9 33.07 44.14 Refuse to declare 12.65 15.27 16.03 12.95 Smoking status Never smoker 49.80 49.68 47.70 .507 49.74 Former smoker 41.15 42.26 42.69 41.28 Occasional smoker 2.87 2.57 2.20 2.83 Regular smoker 6.18 5.49 7.41 6.14 Alcohol consumption Non consumers 4.48 6.23 12.02 < .0001 4.79 Low consumers 47.50 47.95 50.50 47.61 Heavy consumers 48.01 45.82 37.47 47.60
Physical activity level
Low 22.06 19.57 21.84 .0011 21.84 Medium 39.21 37.62 35.07 38.99 High 38.73 42.81 43.09 39.17 https://www.cambridge.org/core . INRAE - Toulouse , on 07 Oct 2020 at 14:39:06
, subject to the Cambridge Core terms of use, available at
https://www.cambridge.org/core/terms
.
Body mass index
Normal, <25 64.58 69.11 72.55 <. 0001 65.14 Overweight, 25-30 25.51 20.71 19.44 24.97
Ob ≥30 9.91 10.18 8.02 9.89
Declared other diets
Vegetarians 5.72 12.85 12.63 < .0001 6.48 Lactose-free 4.40 17.00 23.45 5.89 Vegetarians + lactose-free 0.46 3.26 5.41 0.81 No dieting 89.43 66.88 58.52 86.82
Declared food allergy
Yes 7.61 12.46 16.03 < .0001 8.21
No 92.39 87.54 83.97 91.79
Average number of allergies if
food allergy (=yes), mean (SD) 1.40 (0.83) 1.86 (1.27) 1.94 (1.33) < .0001 1.48 (0.94)
*p Values are based on the ² test or the one-way anova test as appropriate. SD: Standard deviation.
https://www.cambridge.org/core
. INRAE - Toulouse
, on
07 Oct 2020 at 14:39:06
, subject to the Cambridge Core terms of use, available at
https://www.cambridge.org/core/terms
.
Table 2. Nutritional intake profiles among total, partial and non- avoiders.
Non-avoiders Partial avoiders Total avoiders
Energy / Nutrients (n=20,946) (n=2,023) (n=499) p*
mean (95% CI) mean (95% CI) mean (95% CI) Total energy intake
including alcohol (kcal/d)
2,082.08 (2,072.99-2,091.16) 2,040.51 (2,013.61-2,067.42) 2,004.36 (1,951.04-2,057.68) .0003 Total energy intake
excluding alcohol (kcal/d)
2,005.51 (1,996.57-2,014.45) 1,965.99 (1,939.52-1,992.47) 1,938.69 (1,886.22-1,991.15) .0011 mPNNS-GS/** 8.52 (8.50-8.54) 8.64 (8.57-8.71) 8.55 (8.41-8.69) .0041 PANDiet** 66.1 (66.00-66.20) 68.26 (67.96-68.57) 69.78 (69.17-70.39) < .0001 F b (g/d)ᵃ 23.00 (22.88-23.12) 26.43 (26.07-26.78) 27.93 (27.22-28.64) < .0001
% of total energy intake
excluding alcohol from:
Total carbohydrates 39.85 (39.74-39.96) 39.18 (38.85-39.50) 37.89 (37.24-38.53) < .0001 Simple sugars 19.75 (19.66-19.85) 19.99 (19.72-20.27) 21.14 (20.59-21.69) < .0001 Complex carbohydrates 19.98 (19.90-20.07) 19.05 (18.79-19.32) 16.59 (16.07-17.11) < .0001 Total lipids 40.79 (40.68-40.89) 42.22 (41.91-42.53) 44 (43.38-44.61) < .0001 Polyunsaturated fatty acid 6.51 (6.48-6.55) 7.79 (7.69-7.90) 8.61 (8.40-8.82) < .0001 Monounsaturated fatty acid 15.95 (15.89-16.01) 17.19 (17.01-17.36) 18.66 (18.31-19.01) < .0001
Saturated fatty acid 15.26 (15.21-15.32) 14.1 (13.94-14.26) 13.51 (13.20-13.83) < .0001
Total proteins 18.99 (18.93-19.04) 18.25 (18.09-18.41) 17.73 (17.41-18.05) < .0001 Plant proteins/total proteins
ratio (%) 32.21 (32.00-32.41) 38.96 (38.36-39.57) 42.00 (40.80-43.20) < .0001 Micronutients ᵃ Vitamin B6 (mg/d) 2.08 (2.077-2.084) 2.26 (2.24-2.28) 2.42 (2.38-2.46) < .0001 Vitamin B12 (µg/d) 6.94 (6.86-7.01) 7.01 (6.78-7.23) 7.03 (6.58-7.48) .7908 Vitamin C (mg/d) 149.23 (148.04-150.41) 163.17 (159.66-166.68) 183.94 (176.98-190.90) < .0001 Vitamin D (µg/d) 3.14 (3.11-3.17) 3.32 (3.24-3.40) 3.46 (3.30-3.62) < .0001 https://www.cambridge.org/core . INRAE - Toulouse , on 07 Oct 2020 at 14:39:06
, subject to the Cambridge Core terms of use, available at
https://www.cambridge.org/core/terms
.
Vitamin E (mg/d) 14.13 (14.06-14.21) 16.39 (16.17-16.62) 18.03 (17.58-18.47) < .0001 Beta-Carotene (µg/d) 4,522.09 (4,478.51-4,565.66) 5,377.22 (5,248.12-5,506.33) 6,426.32 (6,170.48-6,682.16) < .0001 Retinol (µg/d) 598.93 (586.84-611.02) 604.49 (568.68-640.30) 575.07 (504.10-646.04) .7648 Folate (µg/d) 413.41 (411.43-415.39) 467.1 (461.25-472.96) 511.87 (500.26-523.47) < .0001 Minerals ᵃ Calcium (mg/d) 1,140.96 (1,136.20-1,145.73) 1,056.89 (1,042.77-1,071.01) 1,006.53 (978.55-1,034.51) < .0001 Potassium (mg/d) 3,857.44 (3,845.18-3,869.69) 4,004.87 (3,968.57-4,041.17) 4,184.64 (4,112.70-4,256.58) < .0001 Magnesium (mg/d) 490.72 (488.68-492.76) 523.47 (517.42-529.52) 523.96 (511.97-535.95) < .0001 Sodium (mg/d) 2,642.31 (2,634.35-2,650.27) 2,478.70 (2,455.11-2,502.29) 2,268.46 (2,221.71-2,315.20) < .0001 Copper (mg/d) 2.09 (2.08-2.11) 2.38 (2.34-2.42) 2.46 (2.38-2.53) < .0001 Iron (mg/d) 15.90 (15.84-15.95) 17.00 (16.84-17.17) 17.02 (16.69-17.35) < .0001 Heme-iron (mg/d) 1.47 (1.45-1.48) 1.30 (1.25-1.34) 1.28 (1.19-1.37) < .0001 Phosphorus (mg/d) 1,517.84 (1,513.82-1,521.85) 1,502.18 (1,490.28-1,514.08) 1482.76 (1 459.18-1 506.34) .0009 Zinc (mg/d) 13.35 (13.31-13.39) 12.99 (12.87-13.10) 12.68 (12.45-12.90) < .0001
* p Values are based on ANCOVA test adjusted for age and sex.
** p Values are based on ANCOVA test adjusted for total energy intake (without alcohol), age and sex.
ᵃ adjusted for total energy intake (without alcohol) using the residual method.
https://www.cambridge.org/core
. INRAE - Toulouse
, on
07 Oct 2020 at 14:39:06
, subject to the Cambridge Core terms of use, available at
https://www.cambridge.org/core/terms
.