HAL Id: tel-01751414
https://hal.univ-lorraine.fr/tel-01751414
Submitted on 29 Mar 2018HAL is a multi-disciplinary open access archive for the deposit and dissemination of sci-entific research documents, whether they are pub-lished or not. The documents may come from teaching and research institutions in France or abroad, or from public or private research centers.
L’archive ouverte pluridisciplinaire HAL, est destinée au dépôt et à la diffusion de documents scientifiques de niveau recherche, publiés ou non, émanant des établissements d’enseignement et de recherche français ou étrangers, des laboratoires publics ou privés.
induced damages on buildings
Yinfei Cai
To cite this version:
Yinfei Cai. Simulation of underground mining subsidence and its induced damages on buildings. Other. Université de Lorraine, 2015. English. �NNT : 2015LORR0010�. �tel-01751414�
AVERTISSEMENT
Ce document est le fruit d'un long travail approuvé par le jury de
soutenance et mis à disposition de l'ensemble de la
communauté universitaire élargie.
Il est soumis à la propriété intellectuelle de l'auteur. Ceci
implique une obligation de citation et de référencement lors de
l’utilisation de ce document.
D'autre part, toute contrefaçon, plagiat, reproduction illicite
encourt une poursuite pénale.
Contact : ddoc-theses-contact@univ-lorraine.fr
LIENS
Code de la Propriété Intellectuelle. articles L 122. 4
Code de la Propriété Intellectuelle. articles L 335.2- L 335.10
http://www.cfcopies.com/V2/leg/leg_droi.php
UNIVERSITE DE LORRAINE
Ecole Nationale Supérieure des Mines de Nancy Laboratoire GeoRessources
Ecole Doctorale RP2E THESE
Présentée en vue du grade de DOCTEUR DE L’UNIVER“ITE DE LORRAINE en Génie Civil-Hydrosystèmes-Géotechnique
Par Yinfei CAI
Simulation of underground mining subsidence and its induced
damages on buildings
Simulation des affaissement miniers et de leurs conséquences
sur le bâti
le 13 Mars 2015 Devant le jury composé de
Alec M. MARSHALL – University of Nottingham – UK Rapporteur
José M. GALERA – Universidad Politécnica de Madrid – Spain Rapporteur
Marwan AL-HEIB – INERIS – France Examinateur
Hussein MROUEH – Université Lille 1 – France Examinateur
Thierry VERDEL – Université de Lorraine – France Directeur de thèse Olivier DECK – Université de Lorraine – France Co-directeur de thèse
i
The exploitation of underground mineral resources often causes subsidence phenomena on the ground surface. In urban regions, these phenomena may induce small to severe damage to buildings.
The objective of this thesis is to improve the methods of subsidence computation and building damage evaluation, and to develop some tools based on these methods to study the mining subsidence and building damage cases in Lorraine.
By investigating the topography influence on subsidence under simplified mining conditions, and using numerical models with varying mining depths and ground surface angles, a new influence function method, which is based on a probability density function of a skew normal distribution, to simulate the element subsidence, was firstly developed and can be used to compute the mining subsidence caused by the excavation under non-flat surface. Several numerical simulations and two field subsidence cases were studied and showed that compared to the original influence function method, the improved method better simulated subsidence, especially in terms of horizontal displacements.
Then, plane framed structural models were chosen to study the mechanical behavior of 3D buildings. For each building, two plane models located in the vertical sections passing through the p i iple i e tia a es of the uildi g’s p oje ti e pol go were considered. Their geometry and mechanical characteristics were chosen according to the construction type and used materials of the building under consideration. Then, by using the matrix displacement method with some modifications, the internal forces and displacements for the entire structure could be computed. The achieved internal forces could then be compared to damage grade criteria to determine the extent of building damage.
Finally, by using the improved methods of subsidence computation and building damage evaluation, a real case application was performed in Joeuf city (France). The subsidence was computed and applied to the defined structural models as support displacements, and then the damage extents of the buildings in Joeuf were predicted. In the worst case, if all six
ii
maximum vertical subsidence and horizontal displacement were approximately equal to 2 m and 1 m, respectively, and 37% of the buildings in the city were in high danger.
Keywords: mining subsidence, topography influence, numerical simulation, asymmetrical influence function, building damage assessment, matrix displacement method, structural modeling
iii
L’e ploitatio des essou es i ales soute ai es e t aî e sou e t des affaisse e ts de terrain à la surface. Dans les zones urbanisées, ces affaissements peuvent entraîner des dommages importants aux bâtiments.
L’o je tif de ette thèse est de proposer une amélioration des méthodes d’esti atio des u ettes d’affaissement et des méthodes d’ aluatio des do ages sus epti les de se produire sous leurs effets puis de développer des outils basés sur ces méthodes pour étudier les affaissements et les dommages sur des cas pratiques.
Pa l’ tude de l’i flue e de la topog aphie su la fo atio des u ettes d’affaisse e t, sous des o ditio s d’e ploitatio si plifi e et pa l’utilisatio de od les u i ues sous différentes conditions de profondeur et de pente en surface, une nouvelle fonction d’i flue e, as e su u e de sit de p o a ilit o ale as t i ue, est p opos e. Au o t ai e des thodes ou a tes e ista tes, elle pe et d’a lio e le al ul de la u ette d’affaisse e t ua d la su fa e du sol ’est pas pla e, o e le o t e t plusieu s
o pa aiso s a e des si ulatio s u i ues et deu as d’ tudes.
Ensuite, nous introduisons une modélisation simplifiée des habitations en maçonnerie sous la forme de od les de st u tu es idi e sio els ois s, alig s a e les a es d’i e tie de la st u tu e tudi e et da s les uels la thode des d pla e e ts est ise e œu e pou al ule les effo ts i te es et les d fo atio s sous l’effet de d pla e e ts i posées des fondations. Ces modèles simplifiés dont les caractéristiques géométriques et mécaniques so t d fi is pou ha ue t pe de âti e t tudi , pe ette t d’esti e les effo ts appli u s à ha ue âti e t d’u e ille e pos e à u affaisse e t de te ain et de fournir de ou eau it es d’ aluatio des do ages p e a t e o pte da a tage d’i fo atio s que les méthodes habituelles.
Finalement, sur la base des nouvelles méthodes proposées tant pour le calcul de l’affaisse e t ue pou l’esti atio des dommages, nous proposons une estimation des dommages dans la ville de Joeuf qui nous amène au chiffre de 37% des habitations
iv considéré.
Cette thèse est structurée en quatre chapitres:
Chapitre 1
Les affaissements miniers et leurs dégâts sur les constructions sont l’o jet de cette thèse, et sont brièvement présentés dans ce chapitre.
Tout d'abord, ous p se to s et illust o s le o ept de u ette d’affaisse e t, les fa teurs qui la définissent tels l'affaissement vertical, le déplacement horizontal, la pente, la courbure, et certains paramètres qui la caractérisent comme la valeur de l'affaissement maximal et l'angle de l'influence. Puis, les affaissements historiques causés par les exploitations souterraines en Lorraine (France) en utilisant la méthode des chambres et piliers sont examinés. Ainsi, depuis 1996, plusieurs affaissements ont endommagé plus de cinq cents bâtiments. Enfin, nous présentons plusieurs méthodes utilisées pour prédire l'affaissement induit par une exploitation minière souterraine telles que des méthodes empiriques, la méthode des profils, la méthode des fonctions d'influence, la méthode des modèles physiques ou encore les méthodes numériques. La méthode des fonctions d'influence est p se t e plus e d tail et fe a l’o jet d’a lio atio da s les hapit es sui a ts afi de prendre en compte l'influence des variations topographiques.
Dans la pratique, la déformation horizontale et la courbure, qui sont respectivement induites par des déplacements horizontaux et verticaux non uniformes, sont des paramètres critiques responsables des dommages dans les constructions. Leurs influences sur un bâtiment sont présentées. Les méthodes empiriques, analytiques et numériques peuvent être utilisées dans l'évaluation des dommages aux bâtiments situ s e zo e d’affaisse e t. La méthode des éléments finis (FEM), sera utilisée dans un cadre particulier afin d'évaluer les dommages de construction à grande échelle (une ville par exemple).
Chapitre 2
v
l'extraction d’u e couche horizontale d'une mine souterraine située sous une surface plane, mais fournit des résultats i o e ts lo s ue la su fa e ’est pas plane. Une première partie présente quelques fonctions d'influence usuelles, le principe originel de la méthode des fonctions de d’influence et les caractéristiques de l'affaissement pour une topographie plane. Les conditions d'exploitation réelles sont généralement trop compliquées pour séparer l’influence topographique de l’i flue e d'autres facteurs. Néanmoins, par le biais de modélisations numériques simplifiées, nous pouvons analyser l'influence de la topographie seule e t. C’est e ue ous faiso s e utilisa t des od les o po ta t u e seule fo atio o heuse au dessus d’u e ou he e ploit e ho izo tale et da s lesquels la topog aphie est o stitu e d’u e pe te o sta te. Dans de telles conditions d'exploitation simplifiées, la manière dont les caractéristiques de l’affaisse e t so t affe t es pa la topographie peut être étudiée.
Ainsi, deux nouvelles fonctions d'influence asymétriques sont suggérées pour calculer le déplacement vertical et horizontal. Elles sont basées sur des fonctions de densité de probabilité normales corrigées par des fonctions d'erreur complémentaires. Leurs paramètres peuvent être reliés à l’angle d'inclinaison de la surface et la profondeur moyenne de l'exploitation minière, ce qui permet à ces nouvelles fonctions d'influence de prendre en compte les variations topographiques. Après cela, les déplacements verticaux et horizontaux à chaque point de surface peuvent être calculées par la méthode de superposition standard et la u ette d’affaisse e t à grande échelle peut être calculée.
La méthode ainsi améliorée e uie t la o aissa e ou l’esti atio de l’affaisse e t maximal attendu ainsi que des angles d’i flue e ui peu e t t e o te us à partir de données de terrain. Plusieurs simulations numériques et deux cas test, respectivement en France et en Chine, ont été étudiés et o t e t l’a lio atio o te ue par rapport à la méthode des fonctions d'influence originale, notamment en termes de déplacements horizontaux.
vi
Ce chapitre vise à présenter une méthode de modélisation du comportement mécanique d’ha itatio s i iles à u e g a de helle u e ille pa e e ple afi de fou ir une estimation préliminaire des dommages induits par un affaissement minier. Comme la p isio e uise ’est pas essai e e t le e, il est o u e t ad is ue des od les D, ui o t l’a a tage de la p og a atio fa ile et du al ul apide, peu ent être utilisés pour résoudre des problèmes structuraux 3D.
Dans le présent chapitre, deux modèles structurels plans sont mis en place dans des sections verticales passant par les axes principaux d'inertie du polygone de projection horizontale d'un bâtiment. Ils sont utilisés pour simuler un bâtiment 3D du monde réel.
La méthode matricielle des déplacements est alors utilisée. Quelques modifications sont appo t es à ette thode pou te i o pte des a a tages de Mathe ati a™. Les od les structurels, simplication de la structure réelle, sont d'abord préparés par la discrétisation du od le e listes de œuds et d’ l e ts. E suite, les elatio s fo e-déplacement d'un élément sont introduites de façon traditionnelle. Après cela, en vue d'organiser les relations force-déplacement de l'ensemble du modèle structurel, nous sautons l'étape de l'organisation de la matrice de rigidité de la structure en résolvant directement un ensemble d'équations composées des conditions d'équilibre des forces dans le système de coordonnées global à chaque noeud. Enfin, les forces internes et les déplacements dans le modèle structurel peuvent être résolus. Notre méthode a été vérifiée par des comparaisons avec deux logiciels commerciaux.
Les niveaux de dégradation du bâtiment modélisé peuvent être déterminées à partir des forces internes calculées dans la structure : forces axiales, forces de cisaillement et moments de flexion, grâce à l'utilisation de critères associant des plages de valeurs de ces forces aux différents niveaux de dommages. L'étendue des dommages peut être appréciée à partir de l'une des forces internes et son critère correspondant, ou à partir de deux d'entre elles et de leurs critères correspondants, ou de toutes les trois et leurs critères. Grâce au code
vii
par des lignes colorées utilisées pour distinguer les différents niveaux de dommage. La cinématique des dommages de la structure est également disponible.
En pratique, la portée de la méthode développée dans ce chapitre est plus grande que l'évaluation des dommages de construction induites par un affaissement minier. Elle peut également être utilisée pour étudier les dommages dus à des forces externes et des déplacements arbitraires.
Chapitre 4
Dans ce chapitre, en utilisant les méthodes de calcul d'affaissement (présenté dans le chapitre 2) et du calcul de dommages aux bâtiments (présenté dans le chapitre 3), une application est effectuée dans la ville de Joeuf, qui est située au-dessus d’u e zo e d’e t a tio i i e et se trouve dans une vallée. Plus de 1 500 bâtiments composent cette ville habitée de plus de 7000 personnes. L’affaisse e t i ie est l’al a p i ipal au uel est exposé cette ville.
Sous Joeuf, six zones ont été exploitées en deux couches (couche grise et couche S2-S3). Prenant les données topographiques et minières en compte, et compte tenu de la valeur de l'affaissement maximum local attendue et de l'angle d'influence dans cette région, nous pouvons calculer l'affaissement prévisionnel à Joeuf. Lors du calcul, plusieurs combinaisons d’effo d e e t des zo es i i es peu e t t e e isag es.
Selon les données relatives aux bâtiments de la ville de Joeuf, cinq ensembles de modèles structurels typiques (deux modèles pour chaque) sont choisis pour les simuler. Les propriétés des éléments de structure (la rigidité en flexion EI et la rigidité axiale EA) ainsi que les charges initiales sont définies (pour les murs, le premier étage, et les autres étages) pour les différents types de bâtiments, de e ue les asse lages d’ l e ts elati e e t à la géométrie des ouvrages. Un modèle longitudinal et un modèle transversal sont considérés pour chaque bâtiment.
viii
comparant les forces internes avec des critères de dommages, les niveaux de dommages de tous les bâtiments de Joeuf peuvent être évalués. Selon les forces axiales et les moments fléchissant sur les structures, 19%, 23%, et 37% des bâtiments sont en danger élevé en vertu de l'affaissement causé par l'effondrement de la couche grise, la couche S2-S3, ou des deux couches, respectivement. Une comparaison avec une méthode existante montre également que la nouvelle méthode fournit des résultats crédibles.
Mots-clefs : Affaissement minier, influence de la topographie, simulation numérique, fo tio d’i flue e as t ique, évaluation des dommages aux bâtiments, méthode des déplacements, modélisation des structures
ix
I would like to express my gratitude to all those who helped me during the writing of this thesis.
My deepest gratitude goes first and foremost to Professor Thierry Verdel and Olivier Deck, my supervisors, for their constant encouragement and guidance. They have walked me through all the stages of the writing of this thesis. Without their consistent and illuminating instruction, this thesis could not have reached its present form.
Second, I would like to express my heartfelt gratitude to my dear colleagues, especially to Abla-Mimi Edjossan-sossou, who has always been helping me out of difficulties and supporting without a word of complaint.
Last my thanks would go to my beloved family for their loving considerations and great confidence in me all through these years.
x
Abstract ... i
Résumé ... iii
Remerciements ... ix
Table of contents ...x
List of figures ... xiii
List of tables ... xix
General introduction ... 1
Introduction générale ... 4
Chapter 1: State of the art in mining subsidence and building damage assessment ... 6
Chapit e : Etat de l’a t da s le al ul des affaisse e ts i ie s et des do ages i duits aux bâtiments ... 6
Abstract of chapter 1 ... 7
Résumé du chapitre 1 ... 8
1.1 Mining subsidence caused by underground excavation ... 9
1.1.1 Underground extraction zone and ground mining subsidence ... 9
1.1.2 Mining subsidence in Lorraine ... 10
1.1.3 Methods of mining subsidence calculation ... 14
1.2 Building damage caused by mining subsidence ... 15
1.2.1 Behavior of building affected by subsidence ... 15
1.2.2 Building damage evaluation ... 19
Chapter 2: Improving the influence function method to take ground topographic variations into account in mining subsidence prediction ... 23
Chapit e : A élio atio de la éthode des fo tio s d’i flue e pou p e d e e o pte les variations topographiques du sol dans la détermination des cuvettes d’affaisse e t . 23 Abstract of chapter 2 ... 24
Résumé du chapitre 2 ... 25
2.1 The influence function method ... 26
2.1.1 A widely used method ... 26
2.1.2 Principles of the influence function method ... 27
2.1.3 Characteristics of subsidence in flat terrain due to horizontal underground mining ... 29
2.2 Topography influence on subsidence ... 30
2.2.1 Data sources ... 30
xi
2.3.1 Element mining subsidence ... 35
2.3.2 Asymmetrical influence function ... 38
2.3.3 Full-scale subsidence ... 44
2.4 The usage of the developed code ... 47
2.4.1 Corrections from field data ... 47
2.4.2 The methodology of the developed code ... 48
2.5 Application cases ... 49
2.5.1 Case study 1 ... 49
2.5.2 Case study 2 ... 50
2.6 Conclusions ... 52
Chapter 3: Introducing structural mechanics into building damage assessment under mining subsidence ... 54
Chapit e : La é a i ue des st u tu es au se vi e de l’évaluatio des do ages aux âti e ts e zo e d’affaisse e t i ie ... 54
Abstract of chapter 3 ... 55
Résumé du chapitre 3 ... 56
3.1 Plane framed structural model... 57
3.1.1 The choice of the plane framed model ... 57
3.1.2 Structural model and its components ... 58
3.2 The choice of the matrix displacement method ... 61
3.3 Principle of the matrix displacement method for the analysis of a plane framed structure ... 62
3.3.1 Preparation of a structural model and the input data lists ... 62
3.3.2 Force-displacement relations of an element (mainly after Bao and Gong 2006, Leet et al. 2011)... 70
3.3.3 Force-displacement relations of the structure ... 75
3.3.4 Output data ... 79
3.3.5 Verification ... 81
3.4 Building damage evaluation ... 84
3.4.1 Building damage evaluation depending on the internal forces ... 84
3.4.2 Kinematic analysis ... 87
3.5 Conclusions ... 91
Chapter 4: Case study – damage evaluation of Joeuf city due to mining subsidence ... 93
Chapitre 4: Etude de cas – évaluation des dommages potentiels dans la ville de Joeuf ... 93
Abstract of chapter 4 ... 94
Résumé du chapitre 4 ... 95
4.1 Overview of the city of Joeuf ... 96
4.2 Modelling of the mining subsidence in Joeuf ... 98
xii
4.3 Definition of structural models for the buildings in Joeuf ... 120
4.3.1 Investigations about the buildings in Joeuf ... 121
4.3.2 Standardization of structural models ... 125
4.4 Damage evaluation of the buildings in Joeuf due to mining subsidence ... 147
4.4.1 The structural models with the influence of subsidence ... 148
4.4.2 The internal force criteria for building damage evaluation ... 150
4.4.3 Damage evaluation results in Joeuf ... 152
4.5 Conclusions ... 161
General conclusions and perspectives ... 162
Conclusions générales et perspectives ... 166
References ... 169
Annex 1: The sample of subsidence data got by numerical simulations ... 177
Annex 2: Input and output data of the case studies of subsidence computation ... 180
Annex 3: The building typology in mining subsidence area ... 189
xiii
Figure 0. Scheme of the general organization of this thesis ... 3 Figure 1. The presentation of extraction zone and mining subsidence (Deck 2002) ... 10 Figure 2. Subsidence due to the rupture of the pillars when using the room and pillar method:
(a) excavation using the room and pillar method; (b) the rupture of the pillars, the collapse of the extraction zone, and the settlement of the overlying strata; 90% of the subsidence occurs in a few hours or days; (c) the final subsidence trough becomes stable in a few months ... 11 Figure 3. Subsidence phenomena in Lorraine: (a) farmland (source: INERIS); (b) building
(source: GISOS); (c) road (source: INERIS) ... 12 Figure 4. Presentation of the subsidence issues in Lorraine (Geoderis 2000): (a) the iron basin
in Lorraine; (b) the undermined urban zones ... 13 Figure 5. Behavior of a building influenced by horizontal strain: (a) by the compressive strain;
(b) by the tensile strain... 16 Figure 6. Behavior of a building influenced by curvature: (a) on a convex ground surface; (b)
on a concave ground surface ... 17 Figure 7. Behavior of a building influenced by both horizontal strain and curvature (Kratzsch
1983): (a) & (b) multi-influence of horizontal strain and curvature; (c) single influence of horizontal strain (c-1 to c-3) and curvature (c-4 to c-5) ... 18 Figure 8. Principles of the analytical methods for the evaluation of the building damage
(Saeidi 2010): (a) a building; (b) using a beam to perform the building and considering its self weight; (c) taking the curvature (∆ ) and horizontal strain (� ) into account; (d) computing the maximum strains (� , � , and � ) ... 21 Figure 9. The influence function (f(r), can be any one of the influence functions listed in Table
2) of the extraction of a mining element (the vertical displacement is magnified
compared to the relative distance between the surface and the extraction zone) ... 27 Figure 10. Calculation of a full-scale mining subsidence basin (Step 1: Definition of the mining polygon; Step 2: Rasterization and discretization of the mining polygon; Definition of the properties of every grid mesh; Step 3: Discretization of the surface; Calculation of the influence on surface grid meshes) ... 28 Figure 11. Subsidence curves when excavating a flat mine under a flat surface (vertical scale
is magnified compared to the horizontal) ... 29 Figure 12. Numerical simulation model (FLAC 2D) with a surface slope of 10° and mean depth of 300 m ... 31 Figure 13. Variation of subsidence with surface dip angle and mean depth got by numerical
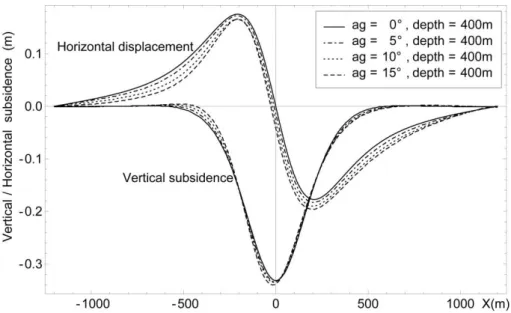
simulations: (a) Comparison of vertical and horizontal subsidence; (b) Comparison of horizontal strain and slope ... 33 Figure 14. Variation of element subsidence with surface slope angle obtained by numerical
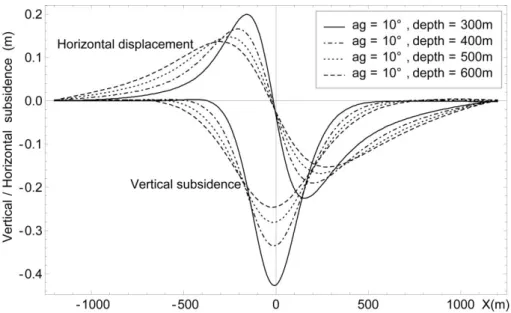
simulations ... 36 Figure 15. Variation of element subsidence with mean mining depth obtained by numerical
xiv
depth = 400 m) ... 37 Figure 17. The relationships between parameters of new asymmetrical influence functions
and surface angle and mean depth: (a)~(d) are the fittings of the parameters of infv in Equation 5, the fitting results are shown in Equation 7 ~ Equation 10; (e)~(h) are the fittings of the parameters of infh in Equation 6, the fitting results are shown in Equation 11 ~ Equation 14 ... 40 Figure 18. Element subsidence comparison (numerical simulation, original symmetrical
influence function method and new asymmetrical influence function method): (a) when surface angle is 5°, mean depth is 450 m; (b) when surface angle is 10°, mean depth is 600 m; (c) when surface angle is 15°, mean depth is 600 m ... 42 Figure 19. Differences in element subsidence computation (numerical simulation minus
original symmetrical influence function method and numerical simulation minus new asymmetrical influence function method): (a) when surface angle is 5°, mean depth is 450m; (b) when surface angle is 10°, mean depth is 600m; (c) when surface angle is 15°, mean depth is 600m ... 43 Figure 20. The surface angle and mining depth when surface angles vary ... 44 Figure 21. Comparison of the methods in the case of subcritical full-scale subsidence (surface angle = 10°, mean depth = 300 m, length of mining zone = 300 m) ... 45 Figure 22. Comparison of the methods in the case of critical full-scale subsidence (surface
angle = 15°, mean depth = 500 m, length of mining zone = 800 m) ... 46 Figure 23. Comparison of the methods in the case of supercritical full-scale subsidence
(varied angle, mean depth = 300 m, length of mining zone = 800 m) ... 46 Figure 24. Comparison of the methods in the case of critical full-scale subsidence (surface
angle = 11°, mean depth = 400 m, length of mining zone = 600 m; multi-layered roof, the Young modules of roof1, roof2 and roof3 are 5.0, 13.0 and 30.6 MPa, the mean
thicknesses of roof1, roof2 and roof3 are 50, 250 and 100 m) ... 47 Figure 25. The usage process diagram of the developed code ... 49 Figure 26. Comparison between the measured vertical subsidence (Angevillers, France) and
the computed subsidence either from the original or the new influence function
method (unit of subsidence: m) ... 50 Figure 27. Comparison between the measured vertical and horizontal subsidence (Jincheng,
China) and the computed subsidence either from the original or the new influence function method ... 51 Figure 28. Principal axes of inertia of the projected polygons of the structures in a horizontal
plane (top view), i.e. the chosen sections where the plane models are built ... 58 Figure 29. A plane framed structural model with 6 elements (E1 – E6), 6 nodes, including 4
joints (N2 – N5), and 2 supports (S1 and S2, i.e. N1 and N6) ... 59 Figure 30. The commonly used supports: (a) fixed support; (b) hinged support; (c) roller
support; (d) directional support ... 60 Figure 31. Preparation of a structural model: (a) the line diagram of a structure; (b) the
xv
the units of , , and � are m, m, and rad, respectively. ... 64 Figure 32. Displacements and forces at two ends of an element in local coordinate system
(the end displacements and forces are positive in the directions of the arrows) ... 67 Figure 33. Composing a structural model (the displacements of S1 and the deformation of E1
are magnified) ... 68 Figure 34. From a local to a global coordinate system: (a) the element end displacements and
forces in local coordinate system; (b) the element end displacements and forces in global coordinate system ... 73 Figure 35. The solving processes of a structure without element loads... 76 Figure 36. Transformation relations of the element end forces in the local coordinate system
and the axial forces, shear forces, and bending moments: (a) the element end displacements in the local coordinate system; (b) the axial forces, shear forces, and bending moments at the ends of an element ... 78 Figure 37. The transformations of element loads ... 79 Figure 38. Some interesting output data (the structural model, external loads and support
displacements can refer to Figure 33, Equation 22, and Equation 23): (a) the axial force diagram; (b) the shear force diagram; (c) the bending moment diagram; (d) the
deformations of the structure (they are magnified compared to the size of the structure) ... 81 Figu e . Co pa iso : the i te al fo es a d displa e e ts got Ro ot™ “t u tu al
Analysis software (the structural model, external loads and support displacements can refer to Figure 33): (a) the axial force diagram; (b) the shear force diagram; (c) the bending moment diagram; (d) the deformations of the structure (they are magnified compared to the size of the structure) ... 83 Figure 40. Comparison 2: the internal forces and displacements got by SM Solver software
(the structural model, external loads and support displacements can refer to Figure 33): (a) the axial force diagram; (b) the shear force diagram; (c) the bending moment
diagram; (d) the deformations of the structure (they are magnified compared to the size of the structure) ... 84 Figure 41. Damage evaluation results along the deformed shape of a structure (the structural
model, external loads and support displacements can refer to Figure 33, Equation 22, and Equation 23; the deformations of the structure are magnified compared to the size of the structure): (a) the damage evaluation result according to the axial force over the structure; (b) the damage evaluation result according to the bending moment over the structure ... 86 Figure 42. Kinematic damage evaluation results according to the axial force over the
structure (the structural model and external loads can refer to Figure 33, Equation 22, and Equation 23; the displacements of the support S1 are the functions of the stage serial number as in Equation 44; the deformations of the structure are magnified
compared to the size of the structure) ... 89 Figure 43. Kinematic damage evaluation results according to the bending moment over the
xvi
the statements in the brackets of Figure 42) ... 91
Figure 45. Variations of the bending moments of several interesting points on the structure (refer to the statements in the brackets of Figure 42) ... 91
Figure 46. The position of the city of Joeuf ... 96
Figure 47. Aerial view of the city of Joeuf ... 97
Figure 48. Digitization of the buildings of Joeuf ... 97
Figure 49. The superposition of the 2D topography iso-contours, the elevation points, and the buildings of Joeuf ... 100
Figure 50. The enlarged detail of the part of Joeuf city in Figure 49 ... 101
Figure 51. 3D model of the topography (the length of the z axis is magnified compared to the length of the x/y axes) ... 102
Figure 52. Typical vertical section of the mines in Joeuf ... 103
Figure 53. The layer gray and three mining polygons: Polygon 1 – Polygon 3 ... 104
Figure 54. The layer S2-S3 and three mining polygons: Polygon 4 – Polygon 6 ... 104
Figure 55. The superposition of the mining polygons of the layer gray (Polygon 1 – Polygon 3) and the layer S2-S3 (Polygon 4 – Polygon 6) ... 105
Figure 56. The superposition of the mining polygons, the buildings of Joeuf, and the topography ... 107
Figure 57. Preparation of the topography data at the equidistant points in the calculation range ... 109
Figure 58. Discretization of the mining polygons (Polygon 1 – Polygon 3) of the layer gray . 110 Figure 59. Discretization of the mining polygons (Polygon 4 – Polygon 6) of the layer S2-S3111 Figure 60. Vertical subsidence iso-contours caused by the excavation of the layer gray (i.e. Polygon 1 – Polygon 3) ... 113
Figure 61. Horizontal displacement (in x direction) iso-contours caused by the excavation of the layer gray (i.e. Polygon 1 – Polygon 3) ... 114
Figure 62. Horizontal displacement (in y direction) iso-contours caused by the excavation of the layer gray (i.e. Polygon 1 – Polygon 3) ... 114
Figure 63. Vertical subsidence iso-contours caused by the excavation of the layer S2-S3 (i.e. Polygon 4 – Polygon 6) ... 115
Figure 64. Horizontal displacement (in x direction) iso-contours caused by the excavation of the layer S2-S3 (i.e. Polygon 4 – Polygon 6) ... 116
Figure 65. Horizontal displacement (in y direction) iso-contours caused by the excavation of the layer S2-S3 (i.e. Polygon 4 – Polygon 6) ... 117
Figure 66. Vertical subsidence iso-contours caused by the excavation of the iron mines under Joeuf city (i.e. layer gray and layer S2-S3, Polygon 1 – Polygon 6) ... 118
Figure 67. Horizontal displacement (in x direction) iso-contours caused by the excavation of the iron mines under Joeuf city (i.e. layer gray and layer S2-S3, Polygon 1 – Polygon 6) ... 119 Figure 68. Horizontal displacement (in y direction) iso-contours caused by the excavation of
xvii
buildings ... 122 Figure 70. Map of Joeuf city with the zones according to the construction eras, the
geometrical characteristics, and the structural properties of the buildings ... 123 Figure 71. Photographs of the most common buildings in Joeuf ... 125 Figure 72. Selection of the axes where the structural models will be performed for each
building: using the principal inertia axes of the building (passing through the centroid point of the building) ... 127 Figure 73. Two structural models are set up in the longitudinal and transverse sections of the
building with an idealized cuboid shape ... 128 Figure 74. Selection of the axes where the structural models will be performed for each
building: using the axis from the building centroid point directing to the subsidence center and the axis perpendicular to the former at the building centroid (not suitable and rejected) ... 129 Figure 75. Typical structural model TSM 1: (a) transverse model; (b) longitudinal model with 3 cells on each floor (10.3 m < Length SL1 – SL2 < 14.3 m), standard length of each cell (Lc)
is 4.1 m; (c) variant of longitudinal model with 4 cells (14.4 m < Length SL1 – SL2 < 18.4
m); (d) variant of longitudinal model with 2 cells (6.2 m < Length SL1 – SL2 < 10.2 m) . 130
Figure 76. Typical structural model TSM 2: (a) transverse model; (b) longitudinal model (Lc = 4.0 m)... 131 Figure 77. Typical structural model TSM 3: (a) transverse model; (b) longitudinal model (Lc =
5.0 m)... 131 Figure 78. Typical structural model TSM 4: (a) transverse model; (b) longitudinal model (Lc =
4.1 m)... 131 Figure 79. Typical structural model TSM 5: (a) transverse model; (b) longitudinal model (Lc =
8.8 m)... 132 Figure 80. The distribution of the typical structural models (TSM) in Joeuf ... 134 Figure 81. The distribution of the building types in Joeuf (about 25% of the types are
hypothetic) ... 136 Figure 82. Typical rectangular cross sections of the column and beam of a plane frame model
... 138 Figure 83. The rectangular cross section for a beam: (a) the cross section in a beam; (b) the
typical rectangular cross section between two columns, used for the reinforce concrete buildings; (c) the special rectangular cross section between two columns, used for the unreinforced masonry buildings (ex. The 1st floor) with the marital of timber ... 139
Figure 84. The composite cross section for a beam: (a) the cross section in a beam; (b) the composite cross section of the beam between two columns, used for the reinforced masonry buildings and the 1st floor of the unreinforced masonry buildings; (c) the
chosen unit composite cross section ... 140 Figure 85. The simplified composite cross section for a beam and the neutral axes for the
whole section (z-z’ , fo the o ete pa t - ’ , a d fo the steel pa t - ’ .... 141 Figure 86. The European standard beam IPN 80 ... 142
xviii
marked in Figure 72 as example), the structural shapes, element properties, and initial loads should be specified: (a) transverse model of the building No.621; (b) longitudinal model of the building No.621 ... 147 Figure 89. Transformation of the subsidence at the supports to the support displacements: (a)
building with the subsidence at the supports; (b) building with the support
displacements... 149 Figure 90. Evaluation of the building damage caused by mining subsidence due to the
collapse of both the layer gray and layer S2-S3 (the vertical subsidence contours are plotted in the figure with the unit of meter) according to the axial forces in the buildings ... 153 Figure 91. Evaluation of the building damage caused by mining subsidence due to the
collapse of both the layer gray and layer S2-S3 (the vertical subsidence contours are plotted in the figure with the unit of meter) according to the bending moments in the buildings ... 154 Figure 92. Evaluation of the building damage caused by mining subsidence due to the
collapse of both the layer gray and layer S2-S3 (the vertical subsidence contours are plotted in the figure with the unit of meter) according to the axial forces and bending moments in the buildings ... 155 Figure 93. Comparison of the proportion of the buildings in each damage grade due to the
collapse of both the layer gray and layer S2-S3 ... 156 Figure 94. Evaluation of the building damage caused by mining subsidence due to the
collapse of the layer gray (the vertical subsidence contours are plotted in the figure with the unit of meter) according to the axial forces and bending moments in the buildings ... 157 Figure 95. Evaluation of the building damage caused by mining subsidence due to the
collapse of the layer S2-S3 (the vertical subsidence contours are plotted in the figure with the unit of meter) according to the axial forces and bending moments in the
buildings ... 158 Figu e . Usi g “aeidi’s da age si ulator to evaluate of the building damage caused by
mining subsidence due to the collapse of the layer gray and layer S2-S3 (the vertical subsidence contours are plotted in the figure with the unit of meter) ... 159 Figu e . The diffe e es et ee the uildi g da age g ades o tai ed “aeidi’s da age
simulator and those obtained by the method presented in this research (the former minus the latter) ... 160 Figure 98. Distribution of the differences of building damage grades shown in Figure 97 ... 161 Figure 99. Types of foundations considered in the typology ... 190 Figure 100. Photographs of the typical buildings in Joeuf ... 195
xix
Table 1. Some mining subsidence events recorded in the iron basin in Lorraine (Deck 2002) ... 13 Table 2. Some influence functions used in subsidence prediction ... 26 Table 3. The physical and mechanical characteristics used in the model ... 31 Table 4. The maximum and minimum values of subsidence (x-position of the given values are
also indicated) ... 34 Table 5. Parameters of the influence functions ... 39 Table 6. The sum of the squares of the differences between the numerical simulation results
and the original symmetrical or improved asymmetrical influence function method results (element subsidence); Bold values are the best results and all correspond to asymmetrical influence function ... 44 Table 7. The sum of the squares of the differences between the numerical simulation results
and the original symmetrical or improved asymmetrical influence function method results (full-scale subsidence); Bold values are the best results and all correspond to asymmetrical influence function ... 47 Table 8. The sum of the squares of the differences between the field data and the original
symmetrical or improved symmetrical influence function method results (case study 2); Bold values are the best results and all correspond to asymmetrical influence function 52 Table 9. The node displacement lists ... 66 Table 10. The load lists ... 69 Table 11. Element end displacements in the global coordinate system ... 80 Table 12. Element end forces in the global coordinate system ... 80 Table 13. Element end displacements in the local coordinate system ... 80 Table 14. Element end forces in the local coordinate system ... 80 Table 15. Axial forces, shear forces, and bending moments at the element ends ... 81 Table 16. The criteria of damage grades (only for the structure in Figure 33) ... 85 Table 17. The coordinates of the ground surface (part) over the iron mines in Joeuf... 99 Table 18. The coordinates of the polygon 1 of the layer gray ... 105 Table 19. The coordinates of the polygon 2 of the layer gray ... 106 Table 20. The coordinates of the polygon 3 of the layer gray ... 106 Table 21. The coordinates of the polygon 4 of the layer S2-S3 ... 106 Table 22. The coordinates of the polygon 5 of the layer S2-S3 ... 106 Table 23. The coordinates of the polygon 6 of the layer S2-S3 ... 106 Table 24. Main characteristics of the layer gray and the layer S2-S3 and the expected
maximum vertical subsidence values of these two layers ... 112 Table 25. The calculation and exhibition scenarios of the subsidence computation in Joeuf113 Table 26. The maximum and minimum subsidence values caused by the excavation of the
iron mines under Joeuf city ... 120 Table 27. General characteristics of the buildings in Joeuf (the positions of the zones in this
xx
Table 29. Description of the 5 building types in Joeuf (the connected houses are combined) ... 135 Table 30. The young moduli ( ) for the materials ... 137 Table 31. The dimensions and properties of the cross sections for different buildings ... 144 Table 32. The axial rigidities and flexural rigidities of the cross sections for different building
types ... 145 Table 33. The initial loads on the beams ... 146 Table 34. The compressive and tensile strengths of masonry, concrete, and steel ... 150 Table 35. The allowed maximum compressive and tensile forces for different elements of
different building types ... 151 Table 36. The criteria of building damage evaluation depending on the allowed maximum
internal forces (including axial force and bending moment) ... 152 Table 37. Statistics of the proportion of the buildings in each damage grade due to the
collapse of both the layer gray and layer S2-S3 ... 155 Table 38. Statistics of the proportion of the buildings in each damage grade due to the
collapse of the layer gray or layer S2-S3... 158 Table 39. The subsidence data derived from the numerical simulations to study the
characteristics of subsidence changed by topography (simplified, the distances between two points are all 10 m in numerical simulations) ... 177 Table 40. The coordinates of the ground surface over an iron mine in Angevillers ... 181 Table 41. The measured vertical subsidence over an iron mine in Angevillers ... 182 Table 42. The coordinates of the two likely collapsed mining zones in Angevillers ... 184 Table 43. The calculated vertical subsidence data using the original symmetrical influence
function method in Angevillers ... 184 Table 44. The calculated vertical subsidence data using the improved asymmetrical influence
function method in Angevillers ... 185 Table 45. The coordinates of the ground surface over the #2307 working face in Jincheng . 186 Table 46. The coordinates of the #2307 working face in Jincheng ... 186 Table 47. The measured subsidence over the #2307 working face in Jincheng ... 186 Table 48. The calculated subsidence data using the original symmetrical influence function
method in Jincheng ... 187 Table 49. The calculated subsidence data using the improved asymmetrical influence
function method in Jincheng ... 188 Table 50. Classification of building length ... 190 Table 51. The summary of the categories of the selected four relevant parameters of building
for the building typology in mining subsidence area ... 191 Table 52. The most common building types in Lorraine region ... 191 Table 53. Types of the buildings in the visited zones (zones 1, 3, 4, 5, 6, 7, 10, and 11) in Joeuf
(the positions of the zones can refer to Figure 69 and Figure 70 in section 4.3.1, the meanings of the building typology can refer to Annex 3) ... 196 Table 54. Types of the buildings in the unvisited zones (zones 2, 8, 9, 12, 13, 14, and 15) in
1
General introduction
France was one of the major mining nations until the second half of the 20th century. In
Lorraine, the iron basin was intensively exploited from the late 19th century, and the last
exploitation was stopped in 1997. The exploitation in Lorraine left 120 km2 of undermined
zones, including 20 km2 under urban zones.
The room and pillar mining method is usually employed in the mining fields under or close to cities where subsidence is not desired. Now, in Lorraine, there are a lot of abandoned extraction zones supported by pillars at different depths due to old exploitations; some of them are very close to the ground surface. In terms of risk analysis, these extraction zones are a hazard. Because, after a quite long time since the excavation, the pillars may no more withstand the weight of the overburden and fall to rupture, then a subsidence may appear on the ground surface and induce damages to surface buildings and infrastructures.
Since 1996, several subsidence accidents occurred in the iron basin in Lorraine. The subsidence, which happened in Auboué (1996), Moutiers (1997) and Roncourt (1999), has damaged more than five hundred buildings. Subsidence in a city does not have the same consequences to subsidence in a wild area because it might cause unexpected economical, environmental, social, and political chain reactions.
The development of cities located in old mining zones is highly dependent on the controls of the mining risks, particularly those regarding buildings. So, it is quite necessary to improve and extend the current subsidence calculation and risk assessment technologies. Therefore, the objective of this thesis is to improve and develop methods and tools of subsidence computation as well as of building damage evaluation.
To achieve the objective, this thesis is composed of four parts.
The first part introduces briefly the mining subsidence and the evaluation of building damage. Above all, some necessary concepts of subsidence, the historical subsidence issues in Lorraine, and the available methods of subsidence computation are presented. Then, the behavior of buildings affected by subsidence and the methods of building damage evaluation are introduced.
The second part is dedicated to an improvement of the original influence function method in order to take the surface topography into account in the calculation of vertical subsidence and horizontal displacement due to underground excavation. We make use of simplified numerical simulations to study the relationships between topography and subsidence. We then suggest not only parameter adjustments but also new influence functions, so that the influence function method can better simulate non-horizontal surface conditions.
The third part makes use of simplified plane framed structural models to study the mechanical behaviors of real 3D buildings influenced by mining subsidence. By using the matrix displacement method with some modifications, and applying the subsidence to the structure as support displacements, the internal forces and displacements over the structure can be computed and compared to criteria related to damage assessment.
2
The fourth part deals with a real case application in Joeuf city. Taking the topography and mining polygon data into account, we calculate the expected subsidence all over the city. Then, considering different building shapes, element properties, initial loads, and the computed subsidence, the internal forces and displaceme ts of the uildi gs’ odels a e obtained for all buildings of the city. The assessment of building damage caused by subsidence can then be obtained through the comparison between the computed internal forces and predefined damage grade criteria.
The general introduction of this thesis, the main achievements (two improved methods and corresponding developed codes), the brief solving processes of subsidence computation and building damage evaluation can be found in Figure 0.
3
Figure 0. Scheme of the general organization of this thesis
i
l
z.
"' 0 0 ~ Topography dataJ
Legend - - - Polygon4 - - - Polygon 5§
- - - Polygon 6 666000 666500 Transverse madel 867000(l
Subsidence comp utation (influence fun ct ion method)
[
a1 (x - 111)]
infv(x ) = sm1 G(x) erfc - J2a
1 [ a2 (x - 112) ] infh(x) = sm2 G'(x) er fe - J2az
(l
--Subsidence resu lts 867500Employing subsidence into structural models as support disp lacements
10 ·~·~.
Lo ngitud inal madel , g= ,~SNim,
' ' ---- l =:=-~~??-~!'! '
.
10 q = ~7 9N,f!1 ' ~-::_21??_t:-i!'!.
t ::-~~?~-~!'!.
' 10 10 15 20 Length (m) M ining data(G(x ) is PDF of a norma l d ist ribution;
erfc(x) is a complement ary error function;
Pa rameters are derived from simplified numerical simu lati ons)
D
Bu ilding damage evaluation (mat rix displacement method )
F = kil
4
Introduction générale
La F a e fut l’u e des p i ipales atio s i i es jus u’à la oiti du e si le. En Lorraine, le bassin ferrifère fut ainsi exploité intensivement à partir de la fin du 19e siècle et
la dernière exploitation a fermé en 1997. Elle a représenté 120 km2 de zones sous-cavées
parmi lesquelles 20 km2 so t u a is es. C’est la thode des ha es et pilie s
abandonnés qui est généralement utilisée dans les gisements se trouvant sous des zones ha it es afi d’ ite l’affaisse e t des te ai s. Aujou d’hui e Lo ai e, il e iste u t s g a d o e d’e a atio s i i es ai si a a do es à des p ofo deu s a ia les. E te es d’a al se de isque, ces excavations constituent un aléa car, longtemps après l’e ploitatio , les pilie s peu e t e plus siste au poids des te ai s sus-jacents et leur rupture peut alors entraîner un mouvement du sol qui lui-même peut entraîner des dommages aux bâtiments et infrastructures en surface.
Depuis, 1996, plusieurs affaissements miniers se sont produit en Lorraine. Ceux de Auboué (1996), Moutiers (1997) et Roncourt (1999) ont ainsi endommagé plus de 500 habitations. U délà des dommages aux habitations, de tels affaissements, quand ils se produisent en zone urbaine, peuvent également entraîner des conséquences économiques, environnementales, sociales et politiques.
Le d eloppe e t des illes situ es da s des zo es d’e ploitatio i i es d pe d beaucoup des moyens de contrôle des aléas miniers, en particulier ceux qui peuvent affecter les âti e ts. Ai si, il est tout à fait essai e d’a lio e les o e s a tuels de al ul p isio el des affaisse e ts et de leu s o s ue es. Ai si, l’o je tif de ette thèse est d’a lio e et de d eloppe les thodes et outils de al ul des u ettes d’affaisse e t ai si ue d’ aluatio des do ages au âti.
Pour atteindre cet objectif, le mémoire comprend 4 parties.
La première décrit brièvement les affaissements minie s et l’ aluatio des do ages au bâti. Les concepts et méthodes de calcul disponibles sont présentés, tant pour la cuvette d’affaisse e t ue pou l’ tude du o po te e t des âti e ts e zo e affaiss es et des dommages occasionnés sur eux.
La deuxième partie est consacrée à une amélioration de la méthode des fonctions d'influence afin de prendre en compte la topographie de surface dans le calcul de l'affaissement vertical et du déplacement horizontal induit par une excavation souterraine. Nous faisons usage de simulations numériques simplifiées pour étudier les relations entre la topographie et l’affaisse e t. Nous proposons alors non seulement le réglage de certains paramètres mais aussi de nouvelles fonctions d'influence, de sorte que la méthode introduite permet de mieux simuler les déplacements de la surface quand celle- i ’est pas horizontale.
La troisième partie fait usage de modèles structuraux simplifiés pour étudier le comportement mécanique de bâtiments réels influencés par un affaissement minier. En utilisant la méthode des déplacements avec certaines modifications, et en utilisant les
5
d pla e e ts al ul s pou l’affaissement comme sollicitation des fondations de ces modèles, les forces internes et les déplacements sur la structure peuvent être calculées et comparées à des critères d'évaluation des dommages.
La quatrième partie traite d'une application réelle au cas de la ville de Joeuf en Lorraine pour u e h poth se d’ te due de i e effo d e. Sur la base des données topographiques et de la géométrie du secteur minier effondré, nous calculons l'affaissement attendu partout dans la ville. Ensuite, compte tenu de différentes formes de construction, de leurs propriétés, des charges initiales, et de l’affaissement calculé en tout point, les forces internes et les déplacements des modèles des bâtiments sont obtenus pour tous les bâtiments de la ville. L'évaluation des dommages aux bâtiments peut alors être obtenue par la comparaison entre les forces internes calculées et les critères d’e do age e t prédéfinis.
6
Chapter 1: State of the art in mining subsidence and building
damage assessment
Chapit e : Etat de l’a t da s le al ul des affaisse e ts iniers et
des dommages induits aux bâtiments
7
Abstract of chapter 1
Mining subsidence and its induced building damage are the topics of this thesis, and introduced briefly in this chapter.
First, the mining subsidence trough on the ground surface, subsidence factors, including vertical subsidence, horizontal displacement, slope, horizontal strain, and curvature, and some subsidence parameters, such as maximum subsidence value and influence angle, are illustrated. Then, the historical subsidence phenomena caused by underground exploitations in Lorraine (France) using the room and pillar method are reviewed. Currently in Lorraine, there are a lot of abandoned extraction zones supported by pillars due to old exploitations, including 20 km2 under urban zones. Since 1996, several subsidence accidents that have
occurred in the cities have damaged more than five hundred buildings. There are many methods that have been used to predict the subsidence induced by underground mining, including empirical methods, profile function methods, influence function methods, analytical methods, physical model methods and numerical methods. The influence function method will be studied and improved in the following chapters to take topographic influence into account.
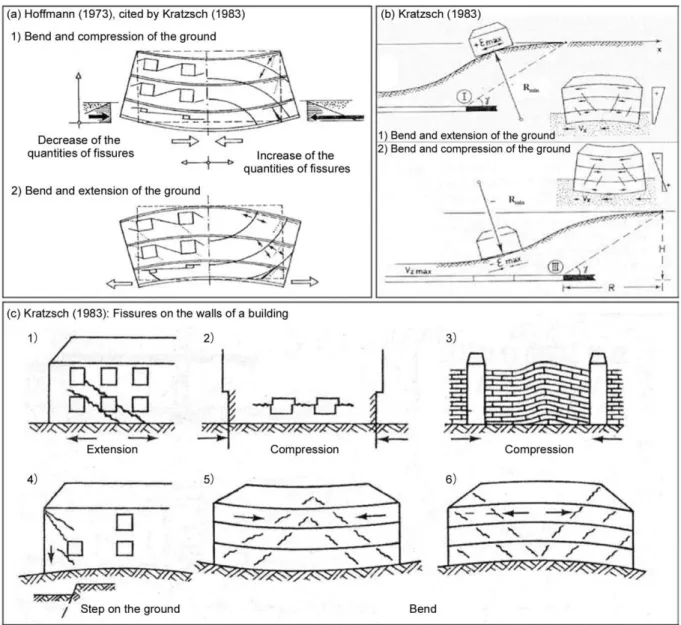
In practice, the horizontal strain and curvature, which are induced by non-uniform horizontal displacement and vertical subsidence, respectively, are critical factors that cause building damages in subsidence area. Their influences on a building are introduced. Empirical, analytical, and numerical methods can be used in the assessment of building damage in mining subsidence areas. The numerical method, specifically the finite element method (FEM), will be used and improved in the following chapters in order to evaluate the building damages at a large scale (a city for instance).
8
Résumé du chapitre 1
Les affaissements miniers et leurs dégâts sur les constructions sont l’o jet de cette thèse, et sont brièvement présentés dans ce chapitre.
Tout d'abord, ous p se to s et illust o s le o ept de u ette d’affaisse e t, les fa teu s qui la définissent tels l'affaissement vertical, le déplacement horizontal, la pente, la courbure, et certains paramètres qui la caractérisent comme la valeur de l'affaissement maximal et l'angle de l'influence. Puis, les affaissements historiques causés par les exploitations souterraines en Lorraine (France) en utilisant la méthode des chambres et piliers sont examinés. Ainsi, depuis 1996, plusieurs affaissements ont endommagé plus de cinq cents bâtiments. Enfin, nous présentons plusieurs méthodes utilisées pour prédire l'affaissement induit par une exploitation minière souterraine telles que des méthodes empiriques, la méthode des profils, la méthode des fonctions d'influence, la méthode des modèles physiques ou encore les méthodes numériques. La méthode des fonctions d'influence est p se t e plus e d tail et fe a l’o jet d’a lio atio da s les hapit es sui a ts afi de prendre en compte l'influence des variations topographiques.
Dans la pratique, la déformation horizontale et la courbure, qui sont respectivement induites par des déplacements horizontaux et verticaux non uniformes, sont des paramètres critiques responsables des dommages dans les constructions. Leurs influences sur un bâtiment sont présentées. Les méthodes empiriques, analytiques et numériques peuvent être utilisées dans l'évaluation des dommages aux bâtiments situ s e zo e d’affaisse e t. La méthode des éléments finis (FEM), sera utilisée dans un cadre particulier afin d'évaluer les dommages de construction à grande échelle (une ville par exemple).
9
1.1 Mining subsidence caused by underground excavation
Subsidence is the motion of a surface (usually, the ground surface) as it shifts downward relative to its initial position. In this research, the large-scale continuous ground surface subsidence, which is caused by the extraction of sub-surface ore bodies, is concerned. Discontinuous subsidence (due to existing faults for instance), sudden subsidence (landslides and sinkholes for instance), sub-su fa e o k la e s’ su side e, o su side e aused non-mining reasons are not under study in the present work.
Around the world, underground mineral resources, particularly carbon (coal) and iron, have been exploited in many countries, like England, France, Germany, Poland, Russia and Ukraine in Europe, and Australia, China, South Africa, United States, and Peru on other continents. The exploitation of these underground resources usually leads to mining subsidence.
1.1.1 Underground extraction zone and ground mining subsidence
Mining subsidence causes the appearance of a bowl-shape subsidence trough (also named subsidence basin) on the ground surface. The subsidence trough has a three-dimensional geometry that depends on many factors related to the mining method, the geometry of the extraction zone, the underground geology and its mechanical properties, the surface topography, and so on.
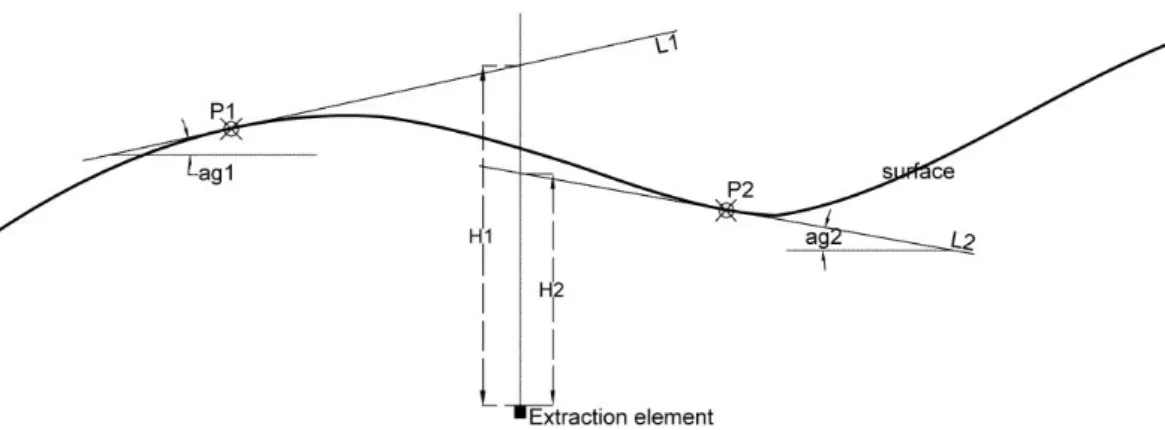
As in Figure 1, which illustrates half of a vertical section of the subsidence trough, several parameters of the mining zone are relevant in subsidence studies, including the depth, thickness, and length. With these parameters, the location and the shape of the extraction zone can be determined.
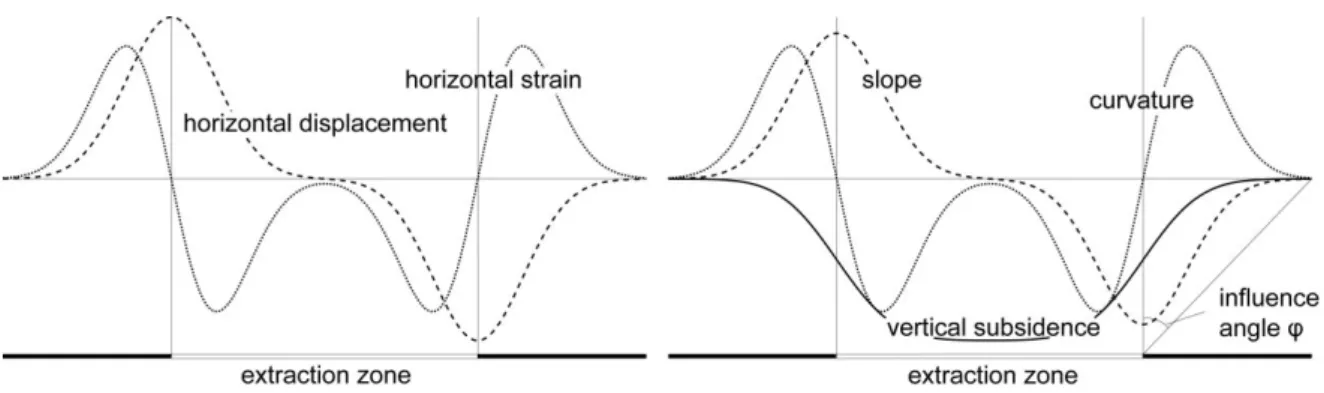
The curves of vertical subsidence (or vertical displacement), horizontal displacement, slope, horizontal strain, and curvature, which can be used to quantitatively represent the mining subsidence, are shown in Figure 1. For each surface point, the vertical subsidence and horizontal displacement can be considered as the movement distance from the original position to the position after subsidence in the vertical and horizontal directions, respectively. These quantities often can be obtained by in situ measurements. The slope is defined as the first derivative of the vertical subsidence, and the curvature is defined as the first derivative of the slope (i.e. the second derivative of the vertical subsidence). The horizontal strain is the first derivative of the horizontal displacement.
The maximum vertical subsidence (Sm), angle of influence (�), and angle of break ( ) are commonly concerned subsidence parameters as shown in Figure 1, and sometimes are known in a particular mining zone. In Lorraine, for instance, the maximum vertical subsidence value is about 20 – 40% of the mining thickness (Deck 2002). The influence angle is used to describe the edge of the subsidence trough, while the break angle is employed to depict the location of the maximum positive horizontal strain (in the tension area). Usually, the angles of influence and break are 10 – 40° and -10 – 20° (Deck 2010, Saeidi 2009, 2015), respectively.
10
Figure 1. The presentation of extraction zone and mining subsidence (Deck 2002)
To distinguish the mining extent, three terminologies are used, including critical area, subcritical area, and supercritical area (NCB 1975). Critical area refers to an area of working, which causes the complete subsidence (i.e. the maximum subsidence under a certain mining condition) of one point on the surface; subcritical area and supercritical area are the areas of working smaller and greater than a critical area. Subsidence caused by the critical, subcritical, and supercritical mining areas can be termed as critical, subcritical, and supercritical subsidence, respectively.
1.1.2 Mining subsidence in Lorraine
France was one of the major mining nations until the second half of the 20th century,
especially rich in coal and iron minerals. But the exploitations in France are totally stopped now.
In Lorraine, the iron basin was intensively exploited from the late 19th century. Until the
1960s, 63 million tons of minette, which consists of iron ore of sedimentary origin, were extracted, benefiting from an increase in industrial production. After that, the production fell due to international competition. The last exploitation was closed in 1997. In Lorraine, the excavated area was around 1300 km2, and more than 3 billion tons of iron ore were extracted
11 (DDE, 2005).
Two major mining technologies, both based on the room and pillar method, were employed: in the first, after excavating the rooms, the remaining pillars were also excavated starting at the farthest point from the stope access so that the overburden collapsed, usually leading to a surface subsidence but eliminating almost any residual risk; while in the second, the rooms and pillars were left in place to serve as a long-term ground support, especially under urban zones where any ground movement is not desired. With the second method, a sufficient number of pillars (with a sufficient size) must be left in order to ensure the stability of the extracted zones. In many cases, protective pillars were kept under urban areas to prevent any risk of subsidence (Geoderis, 2000).
As a result, now in Lorraine, there are a lot of abandoned extraction zones supported by pillars at different depths due to old exploitations; some of them being relatively very close to the surface (few meters). In terms of risk analysis, these extraction zones can be considered as hazard zones. As mentioned in many researches carried out by the GISOS1, it is
exactly the excavations with the method of abandoned rooms and pillars that cause subsidence problems today. The subsidence process is shown as in Figure 2: due to the fact that pillars can no longer withstand the weight of the overburden after a quite long time and fall to rupture, the overlying layers may gradually settle due to the instability of the remaining pillars, then the subsidence appears on the surface and the buildings (or other surface features) suffer destructions.
Figure 2. Subsidence due to the rupture of the pillars when using the room and pillar method: (a) excavation using the room and pillar method; (b) the rupture of the pillars, the collapse of the extraction zone, and the settlement of the overlying strata; 90% of the subsidence occurs in a few
hours or days; (c) the final subsidence trough becomes stable in a few months
Some photographs of subsidence examples in Lorraine are shown in Figure 3. In these
photographs, the securities and functions of farmlands, buildings, and roads are affected by subsidence.
1 Groupement de recherche sur l'Impact et la Sécurité des Ouvrages Souterrains (the Research Group for the
Impact and Safety of Underground Works), was created on 5 July 1999 by BRGM, INERIS, INPL and MINES ParisTech.
12
Figure 3. Subsidence phenomena in Lorraine: (a) farmland (source: INERIS); (b) building (source: GISOS); (c) road (source: INERIS)
The cases of subsidence led public authorities to carry out investigations over the entire mining field. In the year of 2000, an investigation about the mining subsidence risk was implemented in Lorraine, including 20 km2 of urban zones and 120 km2 of non-urban zones
(Petit, 2000). Figure 4 gives a brief description of the dimensions of the iron basin in Lorraine, and the locations of undermined urban areas where well-known subsidence has already happened: the sudden subsidence happened in Sainte Marie in 1932 and the gradual subsidence in the cities of Jarny in 1949, Auboué in 1972, and Crusnes in 1975. Recently, from 1996 to 1999, in the cities of Auboué, Moutiers and Roncourt, gradual subsidence has been found again. Table 1 summarizes the main characteristics of these recorded subsidence events that happened in the iron basin in Lorraine. Actually, about 70 past subsidence events have been identified.
13
Figure 4. Presentation of the subsidence issues in Lorraine (Geoderis 2000): (a) the iron basin in Lorraine; (b) the undermined urban zones
Table 1. Some mining subsidence events recorded in the iron basin in Lorraine (Deck 2002)
City & year
Mining parameter Subsidence parameter
Number of influenced buildings Depth (m) Thickness (m) Exploitation rate (%) Influence angle (°) Maximum subsidence (m) Diameter of subsidence basin (m)
Jarny 1949 200 5 53 Unknown 1.2 Unknown Unknown
Auboué 1972 170 6 60 Unknown Unknown Unknown Unknown
Crusnes 1975 180 3.8 50 Unknown 0.88 Unknown Unknown
Auboué (rue de Metz) 1996 150 - 162 6 45 Unknown 2.23 400 - 600 130 Auboué (cité Coinville) 1996 170 5 53 Unknown 1.23 200 - 400 100 Moutiers (Haut) 1997 120 4 55 Unknown 1.38 400 - 500 70 Moutiers (stade) 1997 140 2.5 55 - 60 Unknown > 0.55 150 - 300 60 Roncourt 1999 150 2.5 53 26 - 38 0.65 150 - 300 18