HAL Id: hal-02676856
https://hal.inrae.fr/hal-02676856
Submitted on 31 May 2020
HAL is a multi-disciplinary open access archive for the deposit and dissemination of sci-entific research documents, whether they are pub-lished or not. The documents may come from teaching and research institutions in France or abroad, or from public or private research centers.
L’archive ouverte pluridisciplinaire HAL, est destinée au dépôt et à la diffusion de documents scientifiques de niveau recherche, publiés ou non, émanant des établissements d’enseignement et de recherche français ou étrangers, des laboratoires publics ou privés.
Corticosterone-dependent metabolic and neuroendocrine
abnormalities in obese Zucker rats in relation to feeding
Martine Duclos, Elena Timofeeva, Chantal Michel, Denis Richard
To cite this version:
Martine Duclos, Elena Timofeeva, Chantal Michel, Denis Richard. Corticosterone-dependent metabolic and neuroendocrine abnormalities in obese Zucker rats in relation to feeding. AJP - Endocrinology and Metabolism, American Physiological Society, 2005, 288 (1), pp.E254-E266. �10.1152/ajpendo.00087.2004�. �hal-02676856�
doi:10.1152/ajpendo.00087.2004
288:254-266, 2005. First published Sep 21, 2004; Am J Physiol Endocrinol Metab
Martine Duclos, Elena Timofeeva, Chantal Michel and Denis Richard
You might find this additional information useful...
56 articles, 29 of which you can access free at: This article cites
http://ajpendo.physiology.org/cgi/content/full/288/1/E254#BIBL
1 other HighWire hosted article: This article has been cited by
[PDF] [Full Text] [Abstract] , September 1, 2007; 293 (3): E802-E810. Am J Physiol Endocrinol Metab
H. Muller, N. Schweitzer, O. Johren, P. Dominiak and W. Raasch Zucker rats, thereby influencing the glucose utilization
Angiotensin II stimulates the reactivity of the pituitary-adrenal axis in leptin-resistant
including high-resolution figures, can be found at: Updated information and services
http://ajpendo.physiology.org/cgi/content/full/288/1/E254
can be found at: AJP - Endocrinology and Metabolism
about Additional material and information
http://www.the-aps.org/publications/ajpendo
This information is current as of November 9, 2010 .
20814-3991. Copyright © 2005 by the American Physiological Society. ISSN: 0193-1849, ESSN: 1522-1555. Visit our website at organization. It is published 12 times a year (monthly) by the American Physiological Society, 9650 Rockville Pike, Bethesda MD publishes results of original studies about endocrine and metabolic systems on any level of
AJP - Endocrinology and Metabolism
on November 9, 2010
ajpendo.physiology.org
Corticosterone-dependent metabolic and neuroendocrine
abnormalities in obese Zucker rats in relation to feeding
Martine Duclos,2Elena Timofeeva,1Chantal Michel,1and Denis Richard1
1Centre de recherche de l’Hoˆpital Laval et Centre de recherche sur le me´tabolisme e´nerge´tique
de l’Universite´ Laval, Quebec, Canada;2Laboratoire Neuroge´ne´tique et Stress, Institut National
de la Sante´ et de la Recherche Me´dicale U471, Universite´ Bordeaux, Bordeaux, France
Submitted 22 February 2004; accepted in final form 9 September 2004
Duclos, Martine, Elena Timofeeva, Chantal Michel, and Denis Richard. Corticosterone-dependent metabolic and neuroendocrine
abnormalities in obese Zucker rats in relation to feeding. Am J Physiol
Endocrinol Metab 288: E254 –E266, 2005. First published September
21, 2004; doi:10.1152/ajpendo.00087.2004.—The obese Zucker (fa/fa) rat is characterized by hyperphagia, hyperinsulinemia, an increase in fat deposition, and a hyperactivity in the hypothalamic-pituitary-adrenal (HPA) axis. The HPA axis in fa/fa rats is hypersen-sitive to stressful experimental conditions. Food deprivation even leads to a stress reaction in obese fa/fa rats. The present study was conducted to investigate the role of corticosterone in obese rats on the basal, fasting, and postprandial metabolic rate as well as on the central expression of the thyrotropin-releasing hormone (TRH) in these conditions. In addition, the study was aimed at clarifying whether the high levels of corticosterone in obese rats are responsible for the induction of the stress reaction to food deprivation in these animals. The present results demonstrate that whole body fat oxidation and postprandial metabolic responses in obese Zucker rats were improved by adrenalectomy (ADX). At the level of the central nervous system, ADX reversed a decrease in TRH mRNA expression in the paraven-tricular hypothalamus (PVH) detected in fasting animals. Considering all feeding conditions, the obese rats demonstrated lower TRH mRNA levels compared with lean animals. ADX resulted in an enhanced postprandial activation of the parvocellular PVH. In contrast, the magnocellular part of the PVH was less responsive to refeeding in ADX animals. Finally, ADX failed to prevent the stress response of obese rats to food deprivation. The present results provide evidence that the removal of adrenals resolve some of the metabolic defects encountered in obese Zucker rats. They also demonstrate that not all the abnormalities of the obese Zucker rats are attributable to the hyperactivity of the HPA axis.
fa/fa rats; metabolic rate; sympathetic nervous system; food
depriva-tion; refeeding; thyrotropin-releasing hormone; tyrosine hydroxylase; corticotropin-releasing hormone
THE OBESE ZUCKER RAT(fa/fa) is a genetic model of obesity with impairment in the communication between peripheral energy stores and the central nervous system due to a dysfunction in leptin signaling. One point mutation in the fatty allele causes in
fa/fa rats an amino acid substitution in the extracellular domain
of the leptin receptor (8, 9, 32). The increase in fat deposition in obese rats arises from an enhanced energy intake and a decreased energy expenditure. Depressed energy expenditure in obese animals results mainly from the low thermogenic activity at the level of the brown adipose tissue (BAT) (48). Low thermogenesis in fa/fa rats is a consequence of a
de-creased sympathetic outflow to BAT and also probably of a mild functional hypothyroidism (1, 5, 23, 24, 42, 61).
The fa/fa rat is characterized by very high circulating levels of corticosterone due to the hyperactivity of the hypothalamic-pituitary-adrenal (HPA) axis (13). High levels of adrenocorti-cotropic hormone (ACTH) have been reported in the fa/fa rat, which also exhibits an increase in the clearance of corticoste-rone (59). In addition, the fa/fa rat has been reported to overexpress corticotropin-releasing hormone (CRH) when faced with stressful experimental conditions (13, 37, 57). Furthermore, we (52) have recently demonstrated that food deprivation induces a strong stress response in obese, but not in lean, Zucker rats. In fact, the hypophysiotropic CRH neurons in the parvocellular part of the paraventricular hypothalamic (PVH) nucleus are strongly activated during food deprivation in obese, but not in lean, rats (51). Besides the observed increase in hypophysiotropic CRH activity in obese animals, there is also evidence suggesting a reduction in CRH system activity (33, 35). The central administration of CRH, a neuro-peptide with well-established thermogenic and anorectic ef-fects, prevents weight gain in obese Zucker rats with few effects in lean animals (40). In obese rats, a decrease in the expression of the CRH type 2 receptor in the ventromedial hypothalamic nucleus and an increase in the expression of the CRH-binding protein in the hypothalamus and amygdala may contribute to a reduction of the activity of some components of the CRH system (37, 49).
The present study was designed to investigate, in an inte-grative approach, the role of the enhanced HPA axis activity in obese rats on the basal and postprandial metabolic rates. We also examined the involvement of corticosterone on the central expression of thyrotropin-releasing hormone (TRH), a neuro-peptide known to play a role in the regulation of energy balance through central and peripheral effects. Finally, we also intended to clarify whether high levels of corticosterone in obese rats were responsible for the induction of stress reaction to food deprivation in these animals.
MATERIAL AND METHODS
Animals and Treatments
Lean (Fa/?) and obese (fa/fa) male Zucker rats, aged 6 wk, were purchased from the Canadian Breeding Laboratories (St-Constant, QC, Canada). All rats were cared for and handled according to the
Canadian Guide for the Care and Use of Laboratory Animals, and the
present protocol was approved by our institutional animal care
com-Address for reprint requests and other correspondence: D. Richard, De´-partement d’Anatomie et de Physiologie, Faculte´ de Me´decine, Universite´ Laval, Quebec, Canada G1K 7P4 (E-mail: denis.richard@phs.ulaval.ca).
The costs of publication of this article were defrayed in part by the payment of page charges. The article must therefore be hereby marked “advertisement” in accordance with 18 U.S.C. Section 1734 solely to indicate this fact. Am J Physiol Endocrinol Metab 288: E254 –E266, 2005.
First published September 21, 2004; doi:10.1152/ajpendo.00087.2004.
0193-1849/05 $8.00 Copyright©2005 the American Physiological Society http://www.ajpendo.org E254
on November 9, 2010
ajpendo.physiology.org
mittee. The animals were housed individually in metabolic chambers (experiment 1) or in wire-bottom cages suspended above absorbent paper (experiment 2). They were, unless otherwise specified, fed ad libitum with a stock diet (Agway Prolab, Rat/Mouse/Hamster 1000 Formula). The rats were subjected to a 1400 –1000 (24-h clock) dark-light cycle (lights on between 0900 and 1900) and kept under an ambient temperature of 23 ⫾ 1°C. One week after their arrival, the rats were sham operated or adrenalectomized (ADX). Bilateral re-moval of the adrenals was achieved through two small lateral skin incisions made under isoflurane anesthesia. Sham-operated animals were treated in the same way as ADX animals except that the adrenals were not excised. The total surgery was completed within 15 min. After surgery, the rats were provided with drinking water supple-mented with NaCl (0.9%).
Experiment 1
Each rat was housed in a 4-liter Plexiglas metabolic chamber and allowed to adapt to the new environment for ⱖ48 h before the beginning of oxygen consumption (V˙O2) measurements. V˙O2
deter-minations were achieved using an open-circuit system (36). Ambient air was drawn through the chamber at a flow rate of 1,250 ml/min, and O2concentration was measured using an O2analyzer (Applied
Elec-trochemistry, model S3A1) coupled to a CO2sensor (Applied
Elec-trochemistry, model N22M). An automatic valve-driver interface allowed alternate sampling in eight metabolic chambers. Between the intermittent measurements, all chambers, except that from which air was sampled for gas analyses, were ventilated at an airflow rate equal to that passing through the sampling chamber. Values of V˙O2 and
V˙CO2were corrected to express the results per kilogram to the power
of 0.75 ml䡠min⫺1䡠kg⫺0.75, according to Refs. 17 and 34, to account for the differences in body weight. Respiratory quotient (RQ) values were calculated as the CO2production-to-O2consumption ratio. Lipid
oxidation was determined as a function of the V˙O2and V˙CO2
accord-ing to the equation reported by Livesey and Elia (26).
After ⱖ2 days of adaptation to the calorimeter and after baseline V˙O2 measurements, rats were either ADX or sham operated and
immediately after surgery returned into the metabolic rooms. Moni-toring of the metabolic state was undertaken in ad libitum-fed rats during 6 consecutive days. Afterward, all rats (4 – 6 animals per group) were food deprived for 12 h and refed for 1 h. During 6 days following adrenal surgery, rats were weighed daily (between 0900 and 0930). Food intake was determined twice daily, i.e., at the end of the dark period (between 0900 and 0930) and 10 h later at the end of the light period (between 1900 and 1930). Food intake was measured by subtracting the amount of food uneaten from the fixed amount pro-vided to the rat. Food spillage was carefully calculated and accounted for in the measurements.
The influence of the sympathetic nervous system (SNS) on the 1-h metabolic response to refeeding was also assessed. Some ADX and sham-operated lean and obese Zucker rats were intraperitoneally injected with propanolol (25 mg/kg) or saline 60 min before onset of refeeding. Each group included 4 – 6 rats.
Experiment 2
Lean and obese Zucker rats, housed individually in wire-bottom cages, were ADX or sham operated. One week after adrenal surgery, a first cohort of rats was killed after ad libitum overnight access to food, after a 12-h period of overnight food deprivation, or after 1 h of ad libitum refeeding following the 12-h fast. Each group comprised six rats. The time of death was adjusted so that all rats were killed at the beginning of the light period to allow comparison of groups at the same period of the circadian glucocorticoid rhythm. A second cohort of ADX and sham-operated lean and obese rats (4 animals per group) was killed 1 wk after adrenal surgery when fed ad libitum and used for carcass determination.
Carcass Determination
Energy, protein, and fat contents of the rats were determined as previously described (38). On the day the rats were killed, they were exsanguinated by decapitation between 1030 and 1200. Carcasses were autoclaved at 125 kPa for 15 min. This procedure, which has been reported not to affect energy yield (27), was used to soften hard tissues. Once autoclaved, carcasses were homogenized in a volume of water corresponding to two times their weight. The homogenized carcasses were then freeze-dried pending the determination of their energy and nitrogen contents. Carcass energy content was determined by adiabatic bomb calorimetry, whereas carcass nitrogen was deter-mined in 250- to 300-mg samples of dehydrated carcasses by use of the Kjeldahl procedure. Carcass protein content was computed by multiplying the carcass nitrogen content by 6.25. The energy as protein was subtracted from total carcass energy to determine energy as nonprotein matter. Because carbohydrate represents a negligible part of carcass total energy, energy from nonprotein matter was assumed to be essentially that of fat. Such an assumption has been confirmed by studies in which energy, fat, and protein were directly determined (2). Values of 23.5 and 39.3 kJ/g were used for the calculation of the energy content of protein and fat, respectively (58). The body weight densities in energy (kJ energy/g body wt), protein (g protein/g body wt), and fat (g fat/g body wt) were then computed and averaged.
Plasma Determination
Plasma glucose was determined by the glucose oxidase method using a glucose analyzer (Beckman, Palo Alto, CA). Serum cortico-sterone was determined by a competitive protein-binding assay (sen-sitivity, 0.05 nmol/l; interassay coefficient of variation, 9.0%) using plasma from a dexamethasone-treated female rhesus monkey as a source of transcortin (30). Insulin was determined by RIA with a reagent kit from Linco Research (St. Charles, MO) using rat insulin as a standard.
Brain Preparation
Rats were anesthetized with 1.5 ml of a mixture containing 20 mg/ml ketamine and 2.5 mg/ml xylazine. Without delay, they were perfused intracardially with 200 ml of ice-cold isotonic saline fol-lowed by 500 ml of a paraformaldehyde (4%) solution. Brains were removed at the end of perfusion and kept in paraformaldehyde for an additional period of 7 days. They were then transferred to a solution containing paraformaldehyde and sucrose (10%) before being cut 24 h later using a sliding microtome (Histoslide 2000; Reichert-Jung, Heidelberg, Germany). Brain sections were taken from the olfactory bulb to the brain stem. Thirty-micrometer-thick sections were col-lected and stored at⫺30°C in a cold, sterile cryoprotecting solution containing sodium phosphate buffer (50 mM), ethylene glycol (30%), and glycerol (20%).
In Situ Hybridization Histochemistry
In situ hybridization histochemistry was used to localize CRH mRNA, pro-TRH mRNA, and c-fos mRNA on tissue sections taken from the entire brain. The protocol used was largely adapted from the technique described by Simmons et al. (45). Briefly, one of every five brain sections was mounted onto poly-L-lysine-coated slides and
allowed to desiccate overnight under vacuum. The sections were then successively fixed for 20 min in paraformaldehyde (4%), digested for 30 min at 37°C with proteinase K (10 g/l in 100 mM Tris䡠HCl containing 50 mM EDTA, pH 8.0), acetylated with acetic anhydride (0.25% in 0.1 M trietholamine, pH 8.0), and dehydrated through graded concentrations (50, 70, 95, and 100%) of alcohol. After vacuum drying forⱖ2 h, 90 l of the hybridization mixture, which contained an antisense35S-labeled cRNA probe (107cpm/ml), were
spotted on each slide. The slides were sealed under a coverslip and
on November 9, 2010
ajpendo.physiology.org
incubated overnight at 60°C in a slide warmer. The next day, the coverslips were removed and the slides rinsed four times with 4⫻ SCC (0.6 M NaCl, 60 mM sodium citrate buffer, pH 7.0), digested for 30 min at 37°C with RNase-A (20g/ml in 10 mM Tris-500 mM NaCl containing 1 mM EDTA), washed in descending concentrations of SSC (2⫻, 10 min; 1⫻, 5 min; 0.1⫻, 30 min at 60°C), and dehydrated through graded concentrations of alcohol. After a 2-h period of vacuum drying, the slides were exposed on an X-ray film (Eastman Kodak, Rochester, NY) for periods varying between 12 and 24 h, depending on the nature of the probes used. Once removed from the autoradiography cassettes, the slides were exposed from 7 to 14 days before being developed in D19 developer (Eastman Kodak) for 3.5 min at 14 –15°C and fixed in rapid fixer (Eastman Kodak) for 5 min. Finally, tissues were rinsed in running distilled water for 1 or 2 h, counterstained with thionin (0.25%), dehydrated through graded con-centrations of alcohol, cleared in xylene, and coverslipped with DPX.
Combination of Immunocytochemistry with In Situ Hybridization
Immunocytochemical detection of Fos, the protein encoded by the oncogene c-fos, was combined with detection of CRH mRNA to determine whether CRH cells were activated during food deprivation or refeeding. Brain sections were first processed for immunochemical detection of Fos by means of a conventional avidin-biotin-immu-noperoxidase method. Briefly, brain slices were washed in sterile 0.05 M potassium phosphate-buffered saline (KPBS) that was treated with diethyl pyrocarbonate water. They were then incubated for 24 h at 4°C with a Fos antibody (rabbit polyclonal IgG; Oncogene Science, New York, NY). The Fos antibody was used at a 1:50,000 dilution in KPBS (50 mM) with heparin (0.25%), Triton X-100 (0.4%), and bovine serum albumin (2%). Twenty-four hours after incubation at 4°C with the first antibody, the brain slices were rinsed in sterile KPBS and incubated with a mixture of KPBS, Triton X-100, heparin, and biotinylated goat anti-rabbit IgG (1:1,500 dilution; Vector Laborato-ries, Burlingame, CA) for 90 min. Sections were then rinsed with KPBS and incubated at room temperature for 60 min with an avidin-biotin-peroxidase complex (Vectastain ABC Elite Kit; Vector Labo-ratories). After several rinses in sterile KPBS, the brain slices were allowed to react in a mixture containing sterile KPBS, the chromagen 3,3⬘-diaminobenzidine tetrachloride (0.05%), and 1% hydrogen
per-oxide. Thereafter, tissues were rinsed in sterile KPBS, mounted onto poly-L-lysine-coated slides, desiccated overnight under vacuum, fixed in paraformaldehyde (4%) for 30 min, and digested for 30 min at 37°C with proteinase K (10g/ml in 100 mM Tris䡠HCl containing 50 mM EDTA, pH 8.0). Prehybridization, hybridization, and posthybridiza-tion steps were performed as described above except for the dehydra-tion step, which was shortened to avoid decolorizadehydra-tion of Fos-immunoreactive (Fos-ir) cells. After being vacuum dried for 2 h, sections were exposed onto X-ray film, defatted in xylene, and dipped in NTB2 nuclear emulsion. Slides were exposed for 7 days, developed in D19 developer for 3.5 min at 15°C, and fixed in rapid fixer for 5 min. Thereafter, tissues were rinsed in running distilled water for 1 or 2 h, rapidly dehydrated through graded concentrations of alcohol, cleared in xylene, and coverslipped with DPX.
Antisense35S-Labeled cRNA Probes
The CRH cRNA probe was generated from the 1.2-kb EcoRI fragment of a rat CRH cDNA (Dr. K. Mayo, Northwestern University, Evanston, IL), subcloned into a pGEM4 vector (Stratagene, La Jolla, CA), and linearized with HindIII and EcoRI (Pharmacia Biotech Canada) for antisense and sense probes, respectively. The c-fos cRNA probe was generated from the EcoRI fragment of rat c-fos cDNA (Dr. I. Verma, The Salk Institute, La Jolla, CA), subcloned into pBluescript SK-1 plasmid (Stratagene), and linearized with SmaI and XhoI (Phar-macia Biotech Canada) for antisense and sense probes, respectively. The rat pro-TRH cRNA probe was generated from a 1.3-kb
EcoRI-PstI fragment of the rat proTRH cDNA (Dr. S. Lee, New England
Medical Center, Boston, MA), subcloned into a pSP64 plasmid (Stratagene), and linearized with BamHI and HindIII to generate antisense and sense probes, respectively. The specificity of each probe was confirmed by the absence of a positive signal in sections hybrid-ized with sense probes. Radioactive riboprobes were syntheshybrid-ized by incubation of 250-ng linearized plasmid in 10 mM NaCl, 10 mM dithiothreitol, 6 mM MgCl, 40 mM Tris (pH 7.9), 0.2 mM ATP-GTP-CTP,␣-35S-labeled UTP, 40 U of RNasin (Promega, Madison, WI)
and 20 U of SP 6, T7, or T3 RNA polymerase for CRH, c-fos, and pro-TRH antisense probes, respectively, for 60 min at 37°C. The DNA templates were treated with 100l of DNase solution (1 l DNase, 5 l of 5 mg/ml tRNA, 94 l of 10 mM Tris-10 mM MgCl2). The
Fig. 1. Daily weight changes relative to presur-gery baseline weight of sham-operated and adre-nalectomized (ADX) lean (Fa/?) and obese (fa/fa) Zucker rats over a 6-day postoperative period. A 2⫻ 2 ⫻ 6 ANOVA was used to examine main and interaction effects of phenotype [lean (Fa/?) and obese (fa/fa)], surgery (sham, ADX), and time (6 consecutive days: D1–D6). Results are means⫾ SE. *Significantly different from lean group within the same surgery for the given post-operative day. #Significantly different from sham-operated group within the same phenotype for the given postoperative day.
E256 METABOLIC AND NEUROENDOCRINE DISORDERS IN OBESITY
AJP-Endocrinol Metab•VOL 288 • JANUARY 2005 •www.ajpendo.org
on November 9, 2010
ajpendo.physiology.org
preparation of the riboprobes was completed through phenol-chloro-form extraction and ammonium acetate precipitation.
Quantitative Analysis of Hybridization Signals
The hybridization signals revealed on NTB2-dipped nuclear emul-sion slides were analyzed and quantified under a light microscope (Olympus, BX50) equipped with a black-and-white video camera (Sony, XC-77) coupled to a Macintosh computer (Power PC 7100/66) using Image software (version 1.57 non-FPU; Wayne Rasband, Na-tional Institutes of Health, Bethesda, MD). The optical density (OD) of the hybridization signal was determined from coronal brain sec-tions under dark-field illumination at a magnification of ⫻25. The brain sections of the various rats were matched as closely as possible for rostrocaudal level. OD determination was performed on each side of the brain, and the two OD values obtained were averaged. This average was included in the statistical analyses as the individual score of a rat. When no hybridization signal was visible under dark-field illumination, the brain structures of interest were outlined under bright-field illumination and then subjected to densitometric analysis under dark-field illumination. The OD for each specific region was corrected for the average background signal, which was determined by sampling unlabeled areas outside of the areas of interest.
Statistical Analyses
In experiment 1, the effects of “time” (T, measurements taken on 6 consecutive days after surgery) and “daily cycle” (C, measurements taken during dark vs. light period) on body weight, food intake, and metabolic measurements and the effects of “treatment” (Tr, propano-lol vs. saline) on the V˙O2 measurements in the rats pretreated with
propanolol or saline before refeeding were assessed using ANOVA. Each group used included 4 – 6 animals.
A 2 ⫻ 2 ⫻ 3 ANOVA was used to detect significant main and interaction effects of “phenotype” [P, lean (Fa/?), obese (fa/fa)], “surgery” (S, sham, ADX), and “nutrition” (N, fed ad libitum, 12-h food deprivation, 1-h refeeding) on the various dependent variables measured in a first cohort of animals in experiment 2. The variables measured in a second cohort of rats in experiment 2 were analyzed by 2⫻ 2 ANOVA to detect significant main and interaction effects of P and S. A posteriori comparisons were performed using the Bonferroni-Dunn multiple comparison procedure.
RESULTS
Experiment 1
Body weight. Figure 1 illustrates changes in body weight of
lean and obese rats during 6 consecutive days following adre-nal surgery. ANOVA revealed a significant main effect of surgery and a significant interaction of surgery and phenotype on body weight, which suggests attenuation in body weight gain after surgery in both phenotypes but with a higher effect in obese than in lean rats. In addition, a significant interaction of time, phenotype, and surgery was accounted for by the fact that lean ADX rats gained weight at a higher rate than did obese ADX animals and that this difference increased over the 6 postoperative days.
Table 1. Average of diurnal food intake measured during
light and dark sessions over the period of 6 postoperative days in Fa/? and fa/fa sham-operated and ADX Zucker rats
Lean (Fa/?) Obese (fa/fa)
Significant Effects, P⬍ 0.05 24-h Food intake Sham 21.05⫾1.38 25.61⫾1.10* P, S ADX 14.93⫾0.59† 18.58⫾1.15*†
Light food intake
Sham 5.67⫾0.75‡ 11.44⫾0.74* P, S, C ADX 5.65⫾0.60‡ 7.41⫾0.57† P⫻ C Dark food intake
Sham 15.49⫾1.55 14.18⫾0.89 S⫻ C ADX 9.28⫾0.73† 10.16⫾0.53† P⫻ S ⫻ C Values represent means⫾ SE in grams for 8–12 animals per experimental condition. See RESULTS for more details on the statistical analyses. ADX, adrenalectomy; P, phenotype main effect; S, surgery main effect; C, daily cycle main effect; P⫻ C, phenotype ⫻ daily cycle interaction; S ⫻ C, surgery ⫻ daily cycle interaction; P ⫻ S ⫻ C, phenotype ⫻ surgery ⫻ daily cycle interaction. *Different from Fa/? within the same surgery and the same metabolic assessment, P ⬍ 0.05. †Different from sham-operated animals within the same phenotype and the same metabolic assessment, P⬍ 0.05. ‡Different from dark food intake within the same surgery and the same phenotype, P⬍ 0.05.
Table 2. Average of diurnal V˙O2, RQ, and lipid oxidation and average of V˙O2, RQ, and lipid oxidation measured during light and dark sessions over 6-day postoperative period in Fa/? and fa/fa sham-operated and ADX Zucker rats
Lean (Fa/?) Obese (fa/fa)
Significant Effects, P⬍ 0.05 24-h V˙O2, ml/min P, S, P⫻ S Sham 6.99⫾0.15 6.39⫾0.23 ADX 6.93⫾0.16 5.63⫾0.10*† Light V˙O2, ml/min Sham 6.84⫾0.17 6.57⫾0.35 ADX 6.74⫾0.20 5.70⫾0.13*† Dark V˙O2, ml/min Sham 7.14⫾0.26 6.22⫾0.32* ADX 7.15⫾0.25 5.55⫾0.16*† 24-h V˙O2, ml䡠min⫺1䡠kg⫺0.75 P, S Sham 22.75⫾0.40 15.69⫾0.46* ADX 21.05⫾0.51 13.73⫾0.20* Light V˙O2, ml䡠min⫺1䡠kg⫺0.75 Sham 22.30⫾0.51 16.12⫾0.71* ADX 20.08⫾0.64† 13.54⫾0.31*† Dark V˙O2, ml䡠min⫺1䡠kg⫺0.75 Sham 23.20⫾0.61 15.25⫾0.60* ADX 22.15⫾0.78 13.93⫾0.24* 24-h RQ P, S, C, P⫻ S, C⫻ S Sham 0.83⫾0.01 0.91⫾0.02* ADX 0.74⫾0.00† 0.75⫾0.01† Light RQ Sham 0.86⫾0.01 0.98⫾0.01* ADX 0.73⫾0.01† 0.75⫾0.01† Dark RQ Sham 0.81⫾0.02 0.86⫾0.03 ADX 0.75⫾0.01† 0.75⫾0.01† 24-h Lipid oxidation, kJ/min
P, S, C Sham 0.065⫾0.06 0.030⫾0.06*
ADX 0.103⫾0.06† 0.072⫾0.06*† Light lipid oxidation, kJ/min
Sham 0.057⫾0.06 0.019⫾0.08* ADX 0.097⫾0.09† 0.070⫾0.05*† Dark lipid oxidation, kJ/min
Sham 0.074⫾0.09 0.041⫾0.09* ADX 0.108⫾0.01† 0.073⫾0.04*†
Values represent means⫾ SE for 8–12 animals per experimental condition. SeeRESULTSfor more details on the statistical analyses. *Different from Fa/? within the same surgery and the same metabolic assessment, P ⬍ 0.05. †Different from sham-operated animals within the same phenotype and the same metabolic assessment, P⬍ 0.05. RQ, respiratory quotient; V˙O2, oxygen
consumption.
on November 9, 2010
ajpendo.physiology.org
Food intake. ANOVA applied to food intake measurements
taken during 6 postoperative days revealed that both phenotype and surgery were major determinants of diurnal food intake. Obese rats consumed more food than lean animals (phenotype effect, P⫽ 0.0001; Table 1). ADX rats ate less than did their sham-operated controls (surgery effect, P ⬍ 0.0001). No in-teraction of surgery and phenotype was detected. When food intake measurements were taken separately during light and dark periods, daily cycle also became a major determinant of food intake (P ⬍ 0.0001) with a significant interaction of the factors surgery, daily cycle, and phenotype (P ⫽ 0.005). During the dark period, food intake of obese animals was not significantly different from that of their lean littermates. In contrast, during the light period, obese sham-operated rats ate more than lean animals (P⫽ 0.003), and this difference was abolished by ADX. ADX resulted in a significant decrease in
food intake during the light phase only in obese animals (P⫽ 0.03), whereas in a dark period food intake was significantly decreased after ADX in both phenotypes (lean rats, P⫽ 0.001; obese rats, P⫽ 0.04). It is noteworthy that, during the hour of refeeding following 12 h of food deprivation, obese animals did not consume more food than lean rats (P⫽ 0.77).
Metabolic rate. Metabolic rate in ADX and sham-operated
lean and obese rats was expressed as the average of the diurnal (24 h) V˙O2as well as the light-V˙O2(average V˙O2 monitored
between 0900 and 1900) and the dark-V˙O2 (average V˙O2
monitored between 1900 and 0900) over the 6 days of the postoperative period (Table 2). Obese rats demonstrated re-duced levels of V˙O2, especially during the dark period. ADX
reduced V˙O2 in both phenotypes but with higher effects in
obese animals. However, when V˙O2values were corrected to
the mass exponent (ml䡠min⫺1䡠kg⫺0.75), the interaction of phe-Fig. 2. Oxygen consumption (V˙O2) in absolute values (ml/min)
and corrected to the mass component (ml䡠min⫺1䡠kg⫺0.75) mon-itored in ADX and sham-operated lean and obese rats that were overnight food deprived and refed for 1 h after saline (Refed⫹ Saline) or propanolol administrations (Refed⫹ Propanolol). A 2⫻ 2 ⫻ 2 ANOVA was used to examine main and interaction effects of phenotype [lean (Fa/?), obese (fa/fa)], surgery (sham, ADX), and treatment (saline, propanolol) followed by a poste-riori Bonferroni-Dunn multiple comparison procedure. Results are means ⫾ SE. *Significantly different from fasting group within the same surgery and same phenotype. #Significantly different from lean animals within the same surgery.
E258 METABOLIC AND NEUROENDOCRINE DISORDERS IN OBESITY
AJP-Endocrinol Metab•VOL 288 • JANUARY 2005 •www.ajpendo.org
on November 9, 2010
ajpendo.physiology.org
notype and surgery was no longer significant, suggesting that the higher decrease in V˙O2measured in obese ADX rats was
due to their greater weight loss (Table 2).
On the 7th day after adrenal surgery, rats were fasted overnight. Figure 2 represents values of V˙O2monitored during
food deprivation and through 1 h of refeeding following 12 h of fasting. Fasting V˙O2 levels were higher in lean rats
com-pared with obese animals, and this difference was also found in ADX rats. One hour of refeeding resulted in a substantial increase in V˙O2. Postprandial metabolic rate corrected for the
difference in body mass was lower in obese rats compared with lean animals (Fig. 2). Nevertheless, when the thermogenic response to food was expressed either in absolute values (V˙O2
in ml/min; Fig. 2) or as the percent (%) increase of metabolic rate, it was not significantly different between sham-operated lean and obese rats, which consumed ultimately the same amount of food during refeeding. A trend toward a diminution in the thermic effect of food was noticed after ADX that might only be a consequence of a significant (P ⬍ 0.0001) de-crease in the absolute amount of consumed food that occurs af-ter ADX.
There was no difference in postprandial V˙O2between
saline-and propanolol-treated lean rats. However, it is noteworthy that V˙O2in lean rats was significantly raised above fasting levels
only in animals receiving saline. The increase was not signif-icant in lean rats treated with propanolol. Propanolol adminis-tration therefore appeared to have quenched the postprandial increase in V˙O2 in lean rats. Propanolol was not effective in
obese sham-operated rats. In fact, the rise in postprandial V˙O2
above fasting levels was significant in both saline- and pro-panolol-treated obese sham-operated rats. ADX restored the ability of propanolol to block the postprandial V˙O2increase in
obese rats (Fig. 2). Compared with control saline rats, propano-lol had no effect on food intake in either phenotype (data not shown).
RQ. Whole body RQ in ADX and sham-operated lean and
obese rats was expressed as the average of diurnal (24-h) RQ
as well as the light-RQ (between 0900 and 1900) and dark-RQ (between 1900 and 0900) measured over the 6 postoperative days. Compared with lean operated animals, obese sham-operated rats demonstrated significantly higher levels of RQ that depend mostly on an increase in RQ levels in obese rats during the light period (Table 2). ADX resulted in a decrease in RQ in both phenotypes. ANOVA applied to RQ measure-ments revealed a significant phenotype⫻ surgery interaction, suggesting that the decrease in RQ levels after ADX was more pronounced in obese animals than in lean rats. Indeed, there was no more difference in RQ values between lean and obese rats after ADX (Table 2).
When substrate utilization was considered over 24 h, a twofold higher rate of lipid oxidation was found in lean sham-operated rats compared with their obese counterparts (phenotype effect, P ⬍ 0.0001; Table 2). ADX resulted in a twofold increase in the rate of lipid oxidation in both pheno-types (surgery effect, P ⬍ 0.0001), but ADX obese rats continued to oxidize significantly less lipid than lean ADX animals. When lipid oxidation measurements were corrected for the mass exponent (kg0.75), the same trends were observed
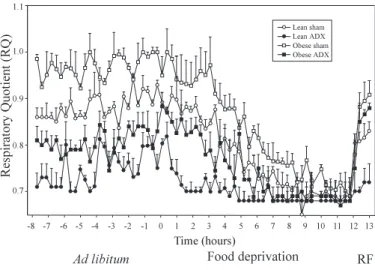
(phenotype effect, P⬍ 0.0001; surgery effect, P ⬍ 0.0001). Fig. 3. Changes in nonprotein respiratory quotient (RQ) in ad libitum-fed
animals during overnight food deprivation (12 h; point 0, beginning of food deprivation) and after 1 h of refeeding (RF) of sham-operated and ADX lean and obese Zucker rats. Results are means ⫾ SE. ANOVA with repeated measures: time (T), P⬍ 0.0001; phenotype (P), P ⬍ 0.0001; surgery (S), P ⬍ 0.001.
Fig. 4. Body carcass protein (top) and fat (bottom) in absolute values (g) (left) and %total carcass (right) in sham-operated and ADX lean (Fa/?) and obese (fa/fa) Zucker rats. A 2 ⫻ 2 ANOVA was used to examine main and interaction effects of phenotype [lean (Fa/?), obese (fa/fa)] and surgery (sham, ADX) followed by a posteriori Bonferroni-Dunn multiple comparison proce-dure. Results are means⫾ SE. *Significantly different from lean group within the same surgery. #Significantly different from sham-operated animals within the same phenotype.
on November 9, 2010
ajpendo.physiology.org
Twelve hours of fasting significantly reduced RQ levels in both lean and obese rats (ad libitum vs. fasting, P⬍ 0.001 for all groups; Fig. 3). However, lean and ADX obese rats de-creased their levels of RQ significantly faster than did obese sham-operated animals (phenotype effect, P⬍ 0.0001; surgery effect, P⬍ 0.001). Sham-operated lean rats reached an RQ of 0.7 after 7 h of food deprivation, whereas their obese counter-parts attained that value only at the end of 12 h of fasting. After ADX, obese rats decreased more rapidly their fasting RQ and as a result reached the value of RQ of food-deprived ADX lean rats as early as at the 5th h of fasting. An important increase in RQ levels following refeeding was detected in all groups except in lean ADX rats (lean ADX rats vs. other 3 groups,
P⬍ 0.001). Experiment 2
Body composition. Because of the dramatic differences in
body weight between lean and obese rats, the measurements of protein and lipid carcass composition were expressed in abso-lute values (in grams) and as the percentage of the total carcass weight (g/carcass weight⫻ 100; Fig. 4). Both analyses dem-onstrated that obese rats had reduced carcass protein compared with lean animals and that ADX did not affect protein content. In contrast, obese rats had much higher levels of body fat than lean animals. ADX decreased lipid carcass content in both phenotypes (Fig. 4).
Corticosterone, glucose, and insulin. Plasma corticosterone
levels were higher in obese rats compared with lean animals. Twelve hours of food deprivation increased corticosterone concentrations in both phenotypes, although the threshold for significance between phenotypes was not reached. One hour of refeeding resulted in a decrease in corticosterone levels that was stronger in lean rats compared with obese animals (Table 3). Obese rats were hyperinsulinemic compared with their lean counterparts. ADX promoted a decrease in insulin levels in both lean and obese rats, and the significant interaction of phenotype and surgery suggested that ADX was more effective in decreasing insulin values in obese rats than in lean animals. Food deprivation for 12 h induced a marked reduction in insulinemia in obese and lean rats, but insulin levels in obese rats remained higher than those of their lean counterparts. In lean rats, refeeding induced an approximately fivefold rise in plasma insulin levels within the 1st h vs. an approximately
threefold increase in obese animals, and even this increase was significantly blunted after ADX; insulin remained significantly higher in obese rats (Table 3). Glycemia was similar in ad libitum-fed lean and obese rats but was increased in obese rats during fasting and refeeding (P ⫽ 0.06). ADX resulted in a significant decrease in glucose plasma levels in both pheno-types (Table 3).
TRH mRNA expression in the brain. ANOVA revealed a
significant main effect of phenotype on the expression of the TRH mRNA in the parvocellular PVH in sham-operated and ADX lean and obese rats (Fig. 5). There was a stronger decline
Fig. 5. Optical densities (ODs) of the hybridization signal of pro-TRH mRNA in the parvocellular paraventricular hypothalamic nucleus (PVHp) of lean and obese sham-operated and ADX Zucker rats fed ad libitum, food deprived for 12 h, or refed for 1 h after 12 h of food deprivation. ODs were determined under microscope on 30-m coronal brain sections. A 2 ⫻ 3 ⫻ 2 ANOVA was used to examine main and interaction effects of phenotype (P, lean, obese), nutrition status (N, ad libitum, food-deprived, refed), and surgery (S, sham, ADX). A posteriori comparisons were performed using Bonferroni-Dunn multiple comparison procedure. Bars represent means⫾ SE. *Significantly different from ad libitum group within the same phenotype and same surgery. #Significantly different from lean group for a given feeding condition and surgery.
Table 3. Effects of food deprivation and refeeding on plasma glucose, insulin, and corticosterone levels
in sham-operated and ADX lean and obese Zucker rats
Lean (Fa/?) Obese (fa/fa) Significant
Effects,
P⬍ 0.05
Ad libitum Food deprived Refed Ad libitum Food deprived Refed
Glucose, mmol/l P, N, S, P⫻ S, P⫻ N ⫻ S Sham 9.28⫾1.36 7.68⫾0.31 7.97⫾0.61 11.04⫾0.96 11.58⫾0.94 13.74⫾2.12* ADX 6.35⫾0.13 4.27⫾0.17 8.71⫾0.47 7.54⫾0.25 5.85⫾0.58† 7.53⫾0.94† Insulin, nmol/l P, N, S, P⫻ N, P⫻ S Sham 0.18⫾0.02 0.06⫾0.01 0.41⫾0.13 1.45⫾0.09 0.47⫾0.04 1.55⫾0.19* ADX 0.06⫾0.05 0.01⫾0.00 0.07⫾0.01 0.67⫾0.25 0.12⫾0.00 0.61⫾0.20† Corticosterone, mmol/l P, S, P⫻ S Sham 0.23⫾0.06 0.38⫾0.08 0.16⫾0.08 0.44⫾0.12* 0.69⫾0.15 0.66⫾1.00* ADX ND ND ND ND ND 0.02⫾0.02
Values represent means⫾ SE for 4–8 animals per experimental condition. SeeRESULTSfor more details on the statistical analyses. ND, nondetectable. *Different from Fa/? within the same surgery and same nutrition condition, P⬍ 0.005. †Different from sham-operated animals within the same phenotype and same nutrition condition, P⬍ 0.005.
E260 METABOLIC AND NEUROENDOCRINE DISORDERS IN OBESITY
AJP-Endocrinol Metab•VOL 288 • JANUARY 2005 •www.ajpendo.org
on November 9, 2010
ajpendo.physiology.org
in TRH mRNA expression during food deprivation in obese rats compared with lean animals. The decrease in TRH mRNA levels in response to food deprivation was blunted by ADX (Figs. 5 and 6). After refeeding, the expression of TRH in the PVH was restored at the ad libitum levels in all groups.
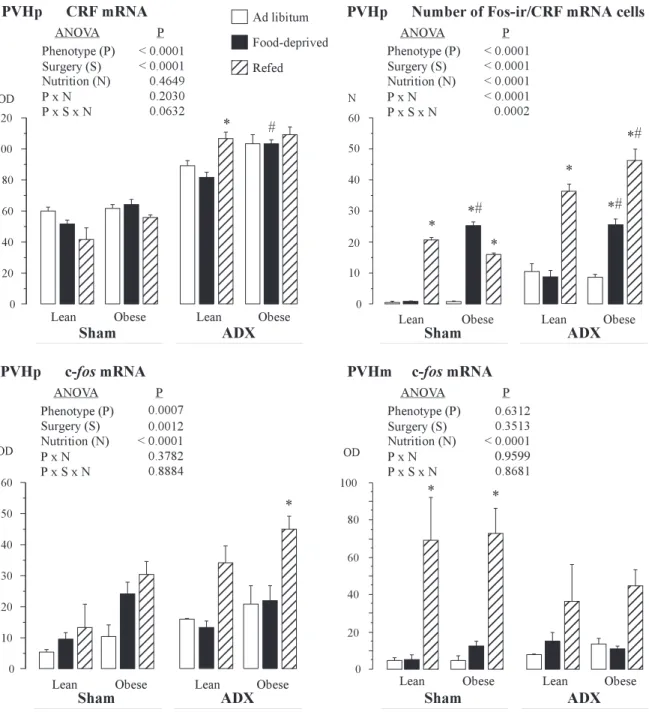
CRH mRNA expression in the brain. ANOVA applied to the
CRH mRNA measurements in the parvocellular PVH revealed significant phenotype and surgery main effects. ADX strongly increased CRH transcript levels in the parvocellular PVH in both phenotypes (Figs. 7 and 8). Expression of CRH was higher in obese than in lean rats. The phenotype difference in CRH expression, as revealed by a posteriori analysis, was more obvious in food-deprived groups. The CRH transcript levels were slightly decreased in lean and increased in obese sham-operated rats during food deprivation. This opposite alteration reached significance in ADX food-deprived animals. ADX significantly increased CRH expression in the PVH of refed lean rats compared with their ADX ad libitum-fed counter-parts, whereas in sham-operated lean rats the levels of CRH transcript were normally slightly decreased during refeeding (Fig. 7).
To specify the phenotype peculiarities of CRH expression, the activation of CRH neurons in the parvocellular PVH was estimated using the simultaneous detection of CRH mRNA and Fos protein, which is considered a marker for neuronal activa-tion (29, 44). In ad libitum-fed sham-operated rats, Fos protein was barely detectable. Food deprivation significantly increased Fos expression in obese, but not in lean, rats. ADX did not blunt this increase. During refeeding, the increase in Fos/CRH cell number was detected in both sham-operated and ADX rats,
although this elevation was higher in ADX animals. Redistri-bution of Fos-positive neurons in the PVH due to ADX was observed in refed animals. Whereas sham-operated rats during refeeding had a moderate number of Fos neurons in the parvocellular PVH and a high amount of Fos-positive cells in the magnocellular PVH, ADX led to an increase in Fos-ir in the parvocellular part, and a noticeable reduction of Fos-positive neurons in the magnocellular part, of the PVH (Figs. 7 and 9). To study this phenomenon, the expression of c-fos mRNA in the PVH in lean and obese sham-operated and ADX rats was examined. ANOVA detected a significant main effect of phe-notype on the expression of c-fos mRNA in the parvocellular PVH. Obese rats expressed higher levels of Fos during food deprivation and refeeding. ADX led to an increase in Fos expression in response to refeeding in the parvocellular PVH. In contrast, in the magnocellular part of the PVH, ADX resulted in a decrease of c-fos mRNA transcript during refeed-ing (Fig. 7).
DISCUSSION
The present study, in agreement with earlier reports (6, 12), demonstrates the ability of ADX to induce a noticeable reduc-tion in the rate of body weight gain in both lean and obese rats. The reduction in body weight gain following ADX is largely accounted for by a reduction in the fat mass. It is noteworthy that the changes in body composition in this study were observed within a very short period of time after adrenal removal and were not restricted to the obese rats, even though they tended to be more pronounced in this mutant.
Fig. 6. Dark-field photomicrographs of coronal brain sections demonstrating pro-TRH mRNA expression in the PVHp. Brain sections (30-m thick) were obtained from lean and obese sham-operated (top and middle) and ADX (bottom) Zucker rats killed when fed ad libitum (AL, top) or food deprived for 12 h (FD, middle and bottom). Scale bar, 200m.
on November 9, 2010
ajpendo.physiology.org
The reducing effects of ADX on energy gain were largely attributable to the hypophagic effects of ADX. ADX lean and obese rats ate less than sham-operated animals, which is consonant with the view that the removal of adrenals causes hypophagia in laboratory rodents (6). There was no marked difference in the 24-h food ingestion between ADX lean and ADX obese rats. It is noteworthy that ADX-induced alterations in food intake took place during the nocturnal phase in lean rats whereas in obese animals ADX resulted in a decrease in food consumption during both dark and light diurnal phases. Genet-ically obese (fa/fa) Zucker rats are known to be hyperphagic
(6) and to have a characteristic diurnal feeding pattern with similar food intakes during the dark and light phases, whereas lean (Fa/?) rats exhibit a pattern of nocturnal eating (3).
One of the most appreciable changes found in obese and lean rats after ADX was an increase in whole body fat oxidation. In obese Zucker rats, which are characterized by a low fatty acid utilization (23), ADX normalized 24-h RQ by bringing the level down below that of sham-operated lean rats. ADX as well as food deprivation tended to abolish the difference in RQ between lean and obese rats. The reducing effect of ADX on RQ in obese rats was particularly apparent during the day (light
0.9599
Fig. 7. Effects of different feeding conditions (ad libitum, food deprivation for 12 h, or refeeding for 1 h) on expression of corticotropin-reducing hormone (CRH) mRNA, c-fos mRNA, and number of cells colocalizing Fos immunoreactivity and CRH mRNA in the PVHp or magnocellular PVH (PVHm) of lean and obese sham-operated and ADX Zucker rats. ODs and cell number were determined under microscope on 30-m coronal brain sections. A 2 ⫻ 3 ⫻ 2 ANOVA was used to examine main and interaction effects of P, N, and S. A posteriori comparisons were performed using Bonferroni-Dunn multiple comparison procedure. Bars represent means⫾ SE. *Significantly different from ad libitum group within the same phenotype and same surgery. #Significantly different from lean group for a given feeding condition and surgery.
E262 METABOLIC AND NEUROENDOCRINE DISORDERS IN OBESITY
AJP-Endocrinol Metab•VOL 288 • JANUARY 2005 •www.ajpendo.org
on November 9, 2010
ajpendo.physiology.org
phase). Indeed, during the light phase, ADX led to a 3.7-fold increase in fat oxidation in obese rats compared with a 1.7-fold increase in lean animals. This difference between lean and obese rats in the effects of ADX on fat oxidation was possibly attributable to the effects of ADX on food intake, which were also stronger in obese than in lean animals during the day. It is noteworthy that the difference in fat oxidation between lean and obese animals does not uniquely relate to phenotype difference in HPA axis activity, as a difference in fat oxidation still persists between lean and obese animals following ADX. The present results convincingly show that the metabolic rate was higher in lean rats than in obese animals regardless of whether the variable was expressed in absolute or relative terms. This finding is consistent with some reports (4, 31, 34), but contradicts others (10, 28). The discrepancy between the results can be ascribed to differences in housing conditions, daily time of assessment, presence or absence of food during measurements, and the V˙O2-monitoring procedure itself.
Fre-quently, V˙O2ensued from short (30 – 60 min) and single
peri-ods of measurement, which are often associated with stress-induced changes in V˙O2. The present results were obtained
with an approach allowing for a 24-h continuous measurement
of V˙O2over several days, with ad libitum access to food and
water. In these conditions, lean rats demonstrated higher ab-solute and relative metabolic rates compared with obese rats. The basal hypometabolism in obese animals cannot be entirely explained by the lower spontaneous activity of obese Zucker rats (46), because they also demonstrated a decrease in body temperature (28). Because the metabolic rate remained lower in ADX obese rats compared with ADX lean animals, our results suggest that HPA axis hyperactivity is probably not directly involved in the decreased resting metabolic rate of the obese Zucker rat.
The reduction in the metabolic rate following ADX was likely attributable to decreases in food intake and body weight associated with ADX. The compensatory drop in energy ex-penditure following ADX did not, however, prevent the reduc-tion in energy gain caused by the procedure. Given that ADX can stimulate BAT thermogenesis (22), one can reasonably argue that an increase in BAT thermogenesis potentially curbed the drop in metabolic rate associated to a deficit in energy intake.
Postprandial activation of the SNS in lean and obese Zucker rats was estimated in the present study. The acute rise in Fig. 8. Dark-field photomicrographs of coronal brain sections demonstrating CRH mRNA expression in the PVHp. Brain sections (30m thick) were obtained from lean and obese sham-operated or ADX Zucker rats killed when fed ad libitum (AL, top) or refed for 1 h after 12 h of food deprivation (RF, middle and bottom). Scale bar, 200m.
on November 9, 2010
ajpendo.physiology.org
metabolic rate after a meal is known to be a consequence of the energy costs of absorption and assimilation of nutrients and of an additional increase in energy expenditure, which is probably related to the activation of BAT thermogenesis (41, 43) and can be inhibited by-adrenergic blockade. The present results provide some evidence that the -adrenergic antagonist pro-panolol is less effective in blunting the postprandial V˙O2 in
obese than it is in lean rats. This finding is in agreement with the view that SNS-mediated BAT thermogenesis is impaired in obese rats (22, 24).
We observed higher pro-TRH mRNA levels in the PVH of lean rats compared with obese animals. Although in ad libitum-fed animals this difference did not reach a level of statistical significance, the consideration of all feeding statuses revealed significantly lower TRH contents in obese rats. Decrease in pro-TRH mRNA contents in the PVH has been reported in lean rats after 3 days of starvation (53). In obese rats, we found a significant reduction in the levels of pro-TRH transcript after only 12 h of food deprivation. ADX blunted the decrease in pro-TRH during food deprivation and even led to a slight increase in pro-TRH mRNA levels in lean, food-deprived rats. Corticosteroids are known to suppress the expression of hypo-thalamic pro-TRH mRNA (16). Van Haasteren et al. (53) have demonstrated that starvation-induced increase in corticosterone secretion is part of the mechanism responsible for the reduced pro-TRH mRNA, TSH mRNA, and plasma TSH synthesis
and release during starvation. Moreover, the presence of a glucocorticoid-responsive element in the promoter region of the pro-TRH gene (19) and the occurrence of glucocorticoid receptors in TRH-synthesizing cells in the paraventricular part of the PVH (7) argued strongly for a TRH expression regula-tion by glucocorticoids. Therefore, the hypercorticosteronemia of obese Zucker rats may be responsible, at least in part, for the reported functional hypothyroidism in these animals (1, 23, 42). A mechanism for TRH decrease in obesity and food deprivation is the apparent inhibition of the TRH neurons by neuropeptide Y (NPY) (14). Arcuate nucleus neurons produc-ing NPY, which is strongly increased in both obese and food-deprived animals (14), innervate the TRH neurons in the PVH (14). Arcuate nucleus ablation prevents fasting-induced suppression of pro-TRH (21), and the administration of leptin to fasting animals has been shown to restore pro-TRH levels (20). Lack of leptin signaling, which normally decreases NPY, may be a cause of TRH suppression in obese animals via leptin-NPY signaling. The contents of the thyroid hormones were not measured in the present study, which makes difficult any speculations about the activity of the entire hypothalamic-thyroid axis. The present observations on TRH mRNA levels in fasted and ADX animals are not contradictory to the hy-pothesis (5) that a centrally triggered mild hypothyroidism in obese animals may contribute to the decrease in the basal energy expenditure.
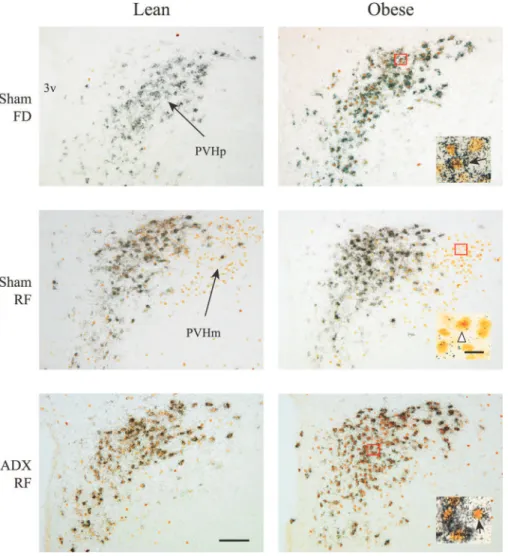
Fig. 9. Bright-field photomicrographs demonstrat-ing CRH mRNA expression (silver grains) and Fos immunoreactivity (brown staining) in the PVHp and PVHm in lean and obese sham-operated (top and middle) or ADX (bottom) Zucker rats. Animals were food deprived for 12 h (FD, top) or refed for 1 h after 12 h of food deprivation (RF, middle and bottom). Insets: examples of neurons in the PVHp and PVHm displaying colocalization of CRH mRNA and Fos-ir (black arrows) or Fos-ir only (white arrowhead). 3v, third ventricle; ir, immunoreactive. Scale bars: 100 m for large panels and 20 m for insets.
E264 METABOLIC AND NEUROENDOCRINE DISORDERS IN OBESITY
AJP-Endocrinol Metab•VOL 288 • JANUARY 2005 •www.ajpendo.org
on November 9, 2010
ajpendo.physiology.org
The hyperactivity of the HPA axis in obese Zucker rats results in very high levels of corticosterone in these animals (13). High levels of ACTH have also been observed in the obese Zucker rat, which also exhibits an increase in the clearance of corticosterone (59). In addition, the fa/fa rat has been reported to overexpress CRH when faced with stressful experimental conditions (13, 37, 57). Food deprivation results in a stress reaction with strong activation of the hypophysio-tropic CRH neurons in obese, but not in lean, rats (52). In this study, we aimed to clarify the implication of corticosterone in CRH expression and PVH activation in the stress-like response to fasting in obese rats, and in the postprandial response in both phenotypes. We have found that ADX did not abolish the activation of hypothysiotropic parvocellular CRH neurons in obese food-deprived rats. This may suggest that stress activa-tion of the central nervous system in obese rats in response to food deprivation is independent of the increased corticosterone levels in these animals and occurs via specific neural pathways, including sensory, anticipatory, and limbic system-linked emo-tional circuits. In this, our observations are consistent with those demonstrating that ADX did not alter the magnitude of the Fos response to swim stress (15, 25).
Recently, we reported a particular pattern of neuronal acti-vation in the PVH during refeeding (50). Postprandial response resulted in moderate activation of the hypophysiotropic CRH neurons in the parvocellular PVH, with higher Fos expression in the ventral and dorsal autonomic parvocellular PVH and very strong activation of the magnocellular PVH, including Fos expression in all arginine vasopressin (AVP) neurons. After ADX, we found a certain shift in activation from the magnocellular to the parvocellular part of the PVH. Fos ex-pression in the parvocellular PVH and within the CRH PVH neurons was significantly higher in ADX refed rats compared with sham-operated refed animals. This increase in the post-prandial expression of Fos in the parvocellular PVH after ADX was accompanied by an enhanced CRH expression that was mainly prominent in lean rats. Therefore, we may conclude that, although corticosterone levels are decreased during refeeding, the inherent content of circulating corticosterone is still important to negative feedback control of the postprandial activity of CRH hypophysiotropic neurons. The implication of the corticosterone in the regulation of postprandial activation of the magnocellular part of the PVH is less obvious, because corticosterone is known to decrease the expression of AVP in nonstressed as well as stressed animals (18, 47, 56). In contrast, we observed a decrease in activation in response to refeeding in magnocellular neurons after corticosterone elimination by ADX. The shift in sodium homeostasis seems rather to be responsible for a decrease in activation of magnocellular neu-rons after ADX. The ADX animals, even when maintained on saline drinking, are hyponatremic (60). The hyponatremic animals fail to respond to ether exposure and osmotic and volemic stimuli with increased secretion of AVP (11, 54, 55), and the synthesis rate of this peptide in magnocellular neurons is also reduced (39).
In conclusion, the present study demonstrates a decrease in body fat and food intake in obese and lean Zucker rats after ADX. At the level of the central nervous system, ADX re-versed a decrease in TRH mRNA expression in the PVH detected in fasting animals. ADX resulted in enhanced post-prandial activation of the parvocellular PVH. In contrast, the
magnocellular part of the PVH was less responsive to refeeding in ADX animals. Finally, ADX failed to prevent the stress response of obese rats to food deprivation, suggesting that the high corticosterone levels in obese rats is not responsible for the fasting-induced stress reaction in these animals. The present results provide evidence that the removal of adrenals resolves some of the metabolic defects encountered in the obese Zucker rats. They also demonstrate that not all the abnormalities of the obese Zucker rats are attributable to the hyperactivity of the HPA axis.
REFERENCES
1. Autissier N, Dumas P, Loireau A, and Michel R. Thyroid status and effects of 3,5,3⬘ triiodothyroacetic acid and fenproporex in genetically lean and obese female rats. Biochem Pharmacol 29: 1612–1615, 1980. 2. Barr HG and Mckracken KJ. High efficiency of energy utilization in
“cafeteria”- and force-fed rats kept at 29°. Br J Nutr 51: 379 –387, 1984. 3. Becker E and Grinker J. Meal patterns in the genetically obese Zucker
rat. Physiol Behav 18: 685– 692, 1977.
4. Bertin R, Razanamaniraka I, De Marco F, and Portet R. Effects of cold acclimation on the feeding pattern and energetic metabolism of genetically obese Zucker rats. Comp Biochem Physiol 74: 855– 860, 1983. 5. Bray GA and York DA. Thyroid function of genetically obese rats.
Endocrinology 88: 1095–1099, 1971.
6. Castonguay TW, Dallman MF, and Stern JS. Some metabolic and behavioral effects of adrenalectomy on obese Zucker rats. Am J Physiol 25l: R923–R933, 1986.
7. Ceccatelli S, Cintra A, Hokfelt T, Fuxe K, Wikstrom AC, and
Gustafs-son JA. Coexistence of glucocorticoid receptor-like immunoreactivity
with neuropeptides in the hypothalamic paraventricular nucleus. Exp Brain Res 78: 33– 42, 1989.
8. Chua SC, Chung WK, Wupeng XS, Zhang YY, Liu SM, Tartaglia L,
and Leibel RL. Phenotypes of mouse diabetes and rat fatty due to
mutations in the OB (leptin) receptor. Science 271: 994 –996, 1996. 9. Chua SC Jr, White DW, Wu-Peng XS, Liu SM, Okada N, Kershaw
EE, Chung WK, Power-Kehoe L, Chua M, Tartaglia LA, and Leibel RL. Phenotype of fatty due to Gln269Pro mutation in the leptin receptor
(Lepr). Diabetes 45: 1141–1143, 1996.
10. Demes GL, Buskirk ER, Alpert SS, and Loomis JL. Energy turnover and heat exchange in mature lean and obese Zucker rats acutely exposed to three environmental temperatures for 24 hours. Int J Obes 15: 375–385, 1991.
11. Dohanics J, Hoffman GE, and Verbalis JG. Hyponatremia-induced inhibition of magnocellular neurons causes stressor-selective impairment of stimulated adrenocorticotropin secretion in rats. Endocrinology 128: 331–340, 1991.
12. Freedman MR, Horwitz BA, and Stern JS. Effect of adrenalectomy and glucocorticoid replacement on development of obesity. Am J Physiol Regul Integr Comp Physiol 250: R595–R607, 1986.
13. Guillaume-Gentil C, Rohner-Jeanrenaud F, Abramo F, Bestetti GE,
Rossi GL, and Jeanrenaud B. Abnormal regulation of the
hypothalamo-pituitary-adrenal axis in the genetically obese fa/fa rat. Endocrinology 126: 1873–1879, 1990.
14. Harfstrand A, Eneroth P, Agnati L, and Fuxe K. Further studies on the effects of central administration of neuropeptide Y on neuroendocrine function in the male rat: relationship to hypothalamic catecholamines. Regul Pept 17: 167–179, 1987.
15. Helmreich DL, Cullinan WE, and Watson SJ. The effect of adrenalec-tomy on stress-induced c-fos mRNA expression in the rat brain. Brain Res 706: 137–144, 1996.
16. Kakucska I, Qi YP, and Lechan RM. Changes in adrenal status affect hypothalamic thyrotropin-releasing hormone gene expression in parallel with corticotropin-releasing hormone. Endocrinology 136: 2795–2802, 1995.
17. Kayser C and Heusner A. Etude comparative du me´tabolism e´nerge´tique dans la se´rie animale. J Physiol (Paris) 56: 489 –524, 1964.
18. Kovacs KJ, Foldes A, and Sawchenko PE. Glucocorticoid negative feedback selectively targets vasopressin transcription in parvocellular neurosecretory neurons. J Neurosci 20: 3843–52, 2000.
19. Lee SL, Stewart K, and Goodman RH. Structure of the gene encoding rat thyrotropin releasing hormone. J Biol Chem 263: 16604 –16609, 1988.
on November 9, 2010
ajpendo.physiology.org
20. Legradi G, Emerson CH, Ahima RS, Flier JS, and Lechan RM. Leptin prevents fasting-induced suppression of prothyrotropin-releasing hormone messenger ribonucleic acid in neurons of the hypothalamic paraventricular nucleus. Endocrinology 138: 2569 –2576, 1997.
21. Legradi G, Emerson CH, Ahima RS, Rand WM, Flier JS, and Lechan
RM. Arcuate nucleus ablation prevents fasting-induced suppression of
ProTRH mRNA in the hypothalamic paraventricular nucleus. Neuroendo-crinology 68: 89 –97, 1998.
22. Levin BE, Triscari J, and Sullivan AC. Defective catecholamine me-tabolism in peripheral organs of genetically obese Zucker rats. Brain Res 224: 353– 66, 1981.
23. Levin BE, Triscari J, and Sullivan AC. Sympathetic activity in thyroid-treated Zucker rats. Am J Physiol Regul Integr Comp Physiol 243: R170 –R178, 1982.
24. Levin BE, Triscari J, and Sullivan AC. Studies of origins of abnormal sympathetic function in obese Zucker rats. Am J Physiol Endocrinol Metab 245: E87–E93, 1983.
25. Li HY and Sawchenko PE. Hypothalamic effector neurons and extended circuitries activated in “neurogenic” stress: a comparison of footshock effects exerted acutely, chronically, and in animals with controlled glu-cocorticoid levels. J Comp Neurol 393: 244 –266, 1998.
26. Livesey G and Elia M. Estimation of energy expenditure, net carbohy-drate utilization, and net fat oxidation and synthesis by indirect calorim-etry: evaluation of errors with special reference to the detailed composition of fuels. Am J Clin Nutr 47: 608 –28, 1988.
27. Lofti M, MacDonald IA, and Stock MJ. Energy losses associated with oven-drying and the preparation of rat carcasses for analysis. Br J Nutr 36: 305–309, 1976.
28. Maskrey M, Megirian D, and Farkas GA. Effect of changing body temperature on the ventilatory and metabolic responses of lean and obese Zucker rats. Am J Physiol Regul Integr Comp Physiol 275: R531–R540, 1998.
29. Morgan JI and Curran T. Stimulus-transcription coupling in the nervous system: involvement of the inducible proto-oncogenes fos and jun. Annu Rev Neurosci 14: 421– 451, 1991.
30. Murphy BEP. Some studies of the protein-binding of steroids and their application to the routine micro and ultramicro measurement of various steroids in body fluids by competitive protein-binding radioassays. J Clin Endocrinol Metab 27: 973–990, 1967.
31. Overton JM, Williams TD, Chambers JB, and Rashotte ME. Cardio-vascular and metabolic responses to fasting and thermoneutrality are conserved in obese Zucker rats. Am J Physiol Regul Integr Comp Physiol 280: R1007–R1015, 2001.
32. Phillips MS, Liu QY, Hammond HA, Dugan V, Hey PJ, Caskey CT,
and Hess JF. Leptin receptor missense mutation in the fatty Zucker rat.
Nat Genet 13: 18 –19, 1996.
33. Plotsky PM, Thrivikraman KV, Watts AG, and Hauger RL. Hypo-thalamic-pituitary-adrenal axis function in the Zucker obese rat. Endocri-nology 130: 1931–1941, 1992.
34. Refinetti R. Computation of the effective body mass for metabolic studies of lean and obese rats. Metabolism 38: 763–766, 1989.
35. Richard D. The role of corticotropin-releasing hormone in the regulation of energy balance. Curr Opin Endocrinol Diabetes 6: 10 –18, 1999. 36. Richard D, Boily P, Dufresne MC, and Lecompte M. Energy balance
and facultative diet-induced thermogenesis in mice fed a high-fat diet. Can J Physiol Pharmacol 66: 1297–1302, 1988.
37. Richard D, Rivest R, Naı¨mi N, Timofeeva E, and Rivest S. Expression of corticotropin-releasing factor and its receptors in the brain of lean and obese Zucker rats. Endocrinology 137: 4786 – 4795, 1996.
38. Richard D and Trayhurn P. Energetic efficiency during pregnancy in mice fed ad libitum or pair-fed to the normal energy intake of unmated animals. J Nutr 115: 593– 600, 1985.
39. Robinson AG, Roberts MM, Evron WA, Verbalis JG, and Sherman
TG. Hyponatremia in rats induces downregulation of vasopressin
synthe-sis. J Clin Invest 86: 1023–1029, 1990.
40. Rohner-Jeanrenaud F, Walker CD, Greco-Perotto R, and Jeanrenaud
B. Central corticotropin-releasing factor administration prevents the
ex-cessive body weight gain of genetically obese (fa/fa) rats. Endocrinology 124: 733–739, 1989.
41. Rothwell N and Stock MJ. Regulation of energy balance in two models of reversible obesity in the rat. J Comp Psychol 93: 1024 –1034, 1979.
42. Rothwell NJ, Saville ME, and Stock MJ. Metabolic responses to fasting and refeeding in lean and genetically obese rats. Am J Physiol Regul Integr Comp Physiol 244: R615–R620, 1983.
43. Sakaguchi T, Arase K, Fisler JS, and Bray GA. Effect of starvation and food intake on sympathetic activity. Am J Physiol Regul Integr Comp Physiol 255: R284 –R288, 1988.
44. Sawchenko PE, Brown ER, Chan RKW, Ericsson A, Li HY, Roland
BL, and Kovacs KJ. The paraventricular nucleus of the hypothalamus
and the functional neuroanatomy of visceromotor responses to stress. Prog Brain Res 107: 201–222, 1996.
45. Simmons DM, Arriza JL, and Swanson LW. A complete protocol for in situ hybridization of messenger RNAs in brain and other tissues with radiolabeled single-stranded RNA probes. J Histotechnol 12: 169 –181, 1989.
46. Stern JS and Johnson PR. Spontaneous activity and adipose cellularity in the genetically obese Zucker rat (fafa). Metabolism 26: 371–380, 1977. 47. Swanson LW and Simmons DM. Differential steroid hormone and neural influences on peptide mRNA levels in CRF cells on the paraven-tricular nucleus: a hybridization histochemical study in the rat. J Comp Neurol 285: 413– 435, 1989.
48. Thurlby PL and Trayhurn P. The role of thermoregulatory thermogen-esis in the development of obesity in genetically-obese (ob/ob) mice pair-fed with lean siblings. Br J Nutr 42: 377–385, 1979.
49. Timofeeva E, Deshaies Y, Picard F, and Richard D. Corticotropin-releasing hormone-binding protein in brain and pituitary of food-deprived obese (fa/fa) Zucker rats. Am J Physiol Regul Integr Comp Physiol 277: R1749 –R1759, 1999.
50. Timofeeva E, Picard F, Duclos M, Deshaies Y, and Richard D. Neuronal activation and corticotropin-releasing hormone expression in the brain of obese (fa/fa) and lean (fa/?) Zucker rats in response to refeeding. Eur J Neurosci 15: 1013–1029, 2002.
51. Timofeeva E and Richard D. Functional activation of CRH neurons and expression of the genes encoding CRH and its receptors in food-deprived lean (Fa/?) and obese (fa/fa) Zucker rats. Neuroendocrinology 66: 327– 340, 1997.
52. Timofeeva E and Richard D. Activation of the central nervous system in obese Zucker rats during food deprivation. J Comp Neurol 441: 71– 89, 2001.
53. Van Haasteren GAC, Linkels E, Klootwijk W, van Toor H, Rondeel
JMM, Themmen APN, de Jong FH, Valentijn K, Vaudry H, Bauer K, Visser TJ, and de Greef WJ. Starvation-induced changes in the
hypo-thalamic content of prothyrotrophin-releasing hormone (proTRH) mRNA and the hypothalamic release of proTRH-derived peptides: role of the adrenal gland. J Endocrinol 145: 143–153, 1995.
54. Verbalis JG, Baldwin EF, and Robinson AG. Osmotic regulation of plasma vasopressin and oxytocin after sustained hyponatremia. Am J Physiol Regul Integr Comp Physiol 250: R444 –R451, 1986.
55. Verbalis JG, Drutarosky MD, Ertel RJ, and Vollmer RR. Adaptive responses to sustained volume expansion in hyponatraemic rats. J Endo-crinol 122: 421– 431, 1989.
56. Viau V, Chu A, Soriano L, and Dallman MF. Independent and over-lapping effects of corticosterone and testosterone on corticotropin-releas-ing hormone and arginine vasopressin mRNA expression in the paraven-tricular nucleus of the hypothalamus and stress-induced adrenocortico-tropic hormone release. J Neurosci 19: 6684 – 6693, 1999.
57. Walker CD, Scribner KA, Stern JS, and Dallman MF. Obese Zucker (fa/fa) rats exhibit normal target sensitivity to corticosterone and increased drive to adrenocorticotropin during the diurnal trough. Endocrinology 131: 2629 –2637, 1992.
58. Webster AJF. Energetics of maintenance and growth. In: Mammalian Thermogenesis, edited by Girardier L and Stock M. London: Chapman and Hall, 1983, p. 178 –207.
59. White BD, Corll CB, and Porter JR. The metabolic clearance rate of corticosterone in lean and obese male Zucker rats. Metabolism 38: 530 – 536, 1989.
60. Will PC and Barnett ME. A sugar and electrolyte drinking solution for long-term maintenance of adrenalectomized rats. Lab Anim Sci 33: 172– 4, 1983.
61. York DA, Marchington D, Holt SJ, and Allars J. Regulation of sympathetic activity in lean and obese Zucker (fa/fa) rats. Am J Physiol Endocrinol Metab 249: E299 –E305, 1985.
E266 METABOLIC AND NEUROENDOCRINE DISORDERS IN OBESITY
AJP-Endocrinol Metab•VOL 288 • JANUARY 2005 •www.ajpendo.org
on November 9, 2010
ajpendo.physiology.org