HAL Id: hal-02924092
https://hal.inrae.fr/hal-02924092
Submitted on 18 Feb 2021HAL is a multi-disciplinary open access archive for the deposit and dissemination of sci-entific research documents, whether they are pub-lished or not. The documents may come from teaching and research institutions in France or abroad, or from public or private research centers.
L’archive ouverte pluridisciplinaire HAL, est destinée au dépôt et à la diffusion de documents scientifiques de niveau recherche, publiés ou non, émanant des établissements d’enseignement et de recherche français ou étrangers, des laboratoires publics ou privés.
Coastline and mudbank monitoring in French Guiana:
contributions of radar and optical satellite imagery
Nicolas Baghdadi, Nicolas Gratiot, Jean-Pierre Lefebvre, Carlos Oliveros,
Anne Bourguignon
To cite this version:
Nicolas Baghdadi, Nicolas Gratiot, Jean-Pierre Lefebvre, Carlos Oliveros, Anne Bourguignon. Coast-line and mudbank monitoring in French Guiana: contributions of radar and optical satellite imagery. Canadian Journal of Remote Sensing, Canadian Aeronautics, 2014, 30 (2), pp.109-122. �10.5589/m03-059�. �hal-02924092�
Coastline and mudbank monitoring in
French Guiana: contributions of radar and
optical satellite imagery
Nicolas Baghdadi, Nicolas Gratiot, Jean-Pierre Lefebvre, Carlos Oliveros, and
Anne Bourguignon
Abstract. The constant migration of mudbanks resulting from the sedimentary discharge of the Amazon River has an
enormous impact on the French Guianese economy. Consequently, there is great local interest in finding tools that can be used in mapping and monitoring the mudbank migration with an acceptable level of reliability and a high frequency of measurement. This involves the ability to detect submarine mudbanks that interfere with access to port channels and impede navigation. Radar and optical satellite images of French Guiana acquired between 1997 and 2001 have been analysed to assess their utility in detecting mudbanks and monitoring coastline change. In the present study, the information derived from radar and optical satellite imagery was analysed with respect to tidal height. The influence of the radar incidence angle was considered, as well as the advantages of having multidate sequences when mapping coastal zones undergoing significant change. A comparative study between radar (European Remote Sensing Satellite (ERS) and RADARSAT) and optical (advanced spaceborne thermal emission and reflection radiometer (ASTER)) images was also conducted. The results show that low-angle radar is more suitable for detecting mudbanks, whereas high-angle radar is more appropriate for monitoring coastline change. Emerged mudbanks and mudbanks under a shallow layer of water (a few tens of centimetres at the most) are easily detectable in radar images. For high tidal levels, the optical images provide more information on the mudbanks than the radar images. Conversely, for low tidal levels, the information on the mudbanks is more detailed with radar imagery.
Résumé. Le déplacement continu des bancs de vase en provenance de l’Amazone a un impact très important sur l’économie
guyanaise. La recherche d’outils permettant la cartographie des bancs et le suivi de leur migration dans des conditions acceptables de fiabilité et de rapidité présente donc un grand intérêt local. Ceci se traduit par la détection en mer des bancs de vase qui viennent perturber l’accès aux chenaux (ports) ce qui constitue un gêne pour la navigation. Des images satellitaires radar et optique, acquises sur la Guyane française entre 1997 et 2001, ont été analysées pour examiner leurs apports à la détection des bancs de vase, et au suivi de l’évolution du trait de côte. L’information issue de l’imagerie satellitaire radar et optique a été étudiée en fonction de la hauteur d’eau. Nous avons analysé l’influence de l’angle d’incidence radar et l’intérêt des séquences multi-dates pour cartographier les zones côtières soumises à des importantes modifications. Une étude comparative entre imagerie radar (ERS et RADARSAT) et optique (ASTER) a également été effectuée ainsi que la relation entre bathymétrie et information satellitaire. Les résultats montrent qu’une incidence radar faible est plus adaptée à la détection des bancs de vase tandis qu’une incidence radar forte est plus appropriée pour le suivi du trait de côte. Les bancs de vase émergés ou immergés sous une faible couche d’eau (quelques dizaines de centimètres au maximum) sont facilement détectables sur les images radar. Pour des hauteurs d’eau élevées, l’imagerie optique permet une meilleure caractérisation des bancs de vase comparativement à l’imagerie radar. Dans le cas d’une faible hauteur d’eau, les résultats montrent que les informations sur les bancs de vase sont plus détaillées avec l’imagerie radar.
122
Introduction
In view of its geographic location (Figure 1) to the northwest of the mouth of the Amazon River (Cape Orange), the coast of French Guiana is constantly affected by the migration of mudbanks under the influence of surface oceanic circulation (Augustinus, 1978). The Amazon drains an enormous quantity of fine-grained sediments, estimated at some 1.2 billion tonnes per year (Eisma et al., 1991). A large part of these sediments flows out into the Atlantic Ocean, although an estimated 15%– 20% is transported along the French Guiana coast carried by the Guianese Current (Wells and Coleman, 1981). The migration of mudbanks generates cyclic depositional and
erosional phases that considerably alter the morphology of the French Guiana and Surinam coasts (Augustinus, 1978). The mudbanks migrate from southeast to northwest, particularly
N. Baghdadi,1C. Oliveros, and A. Bourguignon. Bureau de
Recherches Géologiques et Minières (BRGM) (French Geological Survey), Service Aménagement et Risques Naturels, 3 avenue C. Guillemin, B.P. 6009, 45060 Orléans Cedex 2, France.
N. Gratiot and J.-P. Lefebvre. Institut de Recherche pour le
Développement (IRD), Laboratoire d’Ecologie Littorale, Route de Montabo, B.P. 165, 97323 Cayenne Cedex, France.
during the rainy season, at an annual rate of about 1 km per year, judging from the rate of movement of their intertidal zone (Froidefond et al., 1988). The region is subjected to a dominant wave regime generated by the trade winds from the northeast that persist throughout the majority of the year. Average wave heights along the Guiana coast range from 0.75 m in September to 1.6 m during the period of high winds (February to May). Wave height nevertheless varies locally towards the coastline depending on the nature of the seabed and progressively decreases with the interaction of water laden heavily with mud. Sediment mobilization is high when ocean forcing is strong (average wind speeds 6–8 m/s from February to May) and is reflected by an accumulation of fluid mud at the front of the mudbank, forming mud lakes. When ocean forcing decreases (June to January), the fluid mud consolidates and contributes to the progression of the mudbank. Tidal range along the Guiana coast indicates upper mesotidal conditions, with spring tide low- and high-water levels being 1.0 and 3.1 m, respectively, above chart datum (tide gauge station near Kourou; Service hydrographique et océanographique de la marine (SHOM)).
The mudbanks can extend alongshore for 20–35 km and offshore out to the 15 m isobath, i.e., about 20 km from the coast (Figure 2). They are linked to the coast by heterogeneous geomorphic units, including (i) the schorre (i.e., that part only submerged during the highest spring tides), (ii) the intertidal zone (above water at low level tide), and (iii) the subtidal zone (permanently submerged).
Four main coastal features can be described: (i) the coastline is defined as the boundary between the mature mangroves and the ocean fringe; (ii) the intertidal zone (or upper slikke), adjacent to the coast, is made up of an accumulation of plastic sediments that can be shaped into perennial features such as tidal dewatering channels and longshore bars (clinoforms) and is characterized by algal and plant colonies and remains static during mudbank migration; (iii) the outer fringe of the
intertidal zone (lower slikke) is composed of poorly consolidated bare mud that is still transportable; and (iv) the subtidal zone, as yet poorly understood, can be identified primarily by its damping effects on incident swell waves.
The interbank zones typically have a sawtooth shoreline pattern. Because of the absence of a mud substrate, there is less damping of swell and the waves reach the coast. The breaking surf contributes to shoreline regression with the creation of microcliffs. The trees growing in the erosional zone are uprooted and form a characteristic band of debris along the coast.
Two geomorphic units, which lie directly over an old consolidated clay seabed, can be observed in the interbank zone, namely “mudcapes” and mudflats. These units do not extend into the subtidal zone. The mudcapes are created by sediments trapped near the estuaries during transport. Owing to the direction of littoral drift on the French Guianese continental shelf, the mudcapes generally form on the right banks of the river mouths. The mudflats form when sediments are trapped by specific coastline features, such as coves and capes.
The presence of mudbanks brings about rapid changes in the coastal zone. On the one hand, changes in seabed depth in areas of accretion frequently hinder navigation. On the other hand, areas of erosion are related to shoreline regression of a few hundred metres per year (Allard, 1997). This retreat has a considerable effect on the coastal ecosystem, mainly because of the massive destruction of the mangroves (Singhroy, 1996). These rapid rates of change cause real problems in coastal management. Fisheries, ocean transport, and tourism must constantly adapt to these changes.
The French Guianese authorities, however, are most concerned about the impacts on port activities because of the great economic importance. Sedimentation in the access channels to the ports of Cayenne (the economic capital) and Kourou (the space centre) can seriously disrupt commercial shipping traffic. This makes daily dredging necessary, an ongoing and costly operation. Remaining informed on the sedimentation state of the navigation channels is a major concern, a need that is currently met through bathymetric monitoring by regular echo sounding. Dredging is a laborious task that would be easier to plan and carry out if a quick preliminary reconnaissance were feasible, even if only approximate (concentrating on the most important sites). The ability to monitor mudbank evolution and map mudbank location throughout the area can be crucial, especially during periods of high sedimentation and coastal erosion. Spaceborne remote sensing can provide data on the Earth’s surface in a way that is repetitive, programmable, and relatively inexpensive. A monitoring system using satellite images can facilitate planning and provide managers with an effective decision-making tool.
In view of the humid tropical climate prevalent in this region, the use of optical images for coastal environment mapping poses a problem owing to the frequent cloud cover. Radar sensors can overcome most of the weather constraints, thus providing a great advantage when observations need to be recorded all year round. In addition, radar images are highly
Figure 1. Location of the study site along the eastern part of the
French Guiana coast (latitude 4°30′–5°30′N, longitude 51°50′– 53°W).
sensitive to surface roughness and may be able to detect the presence of an underwater mudbank, providing that the following hypotheses are confirmed:
(1) An increase in surface roughness tends to increase the amount of radar backscatter (Baghdadi et al., 2002; Rakotoarivony et al., 1996). In shallow-water areas (mudbanks, for example), a change in wave motion occurs in a shoreward direction. The influence of the seabed increases directly with the shallowness of the water and the height of the waves and can cause the waves to break. Wave damping and breaking can be revealed by a change in the appearance of the sea surface, and in this way the associated mudbank can be detected in radar images.
(2) Wave damping, which commonly occurs on the nearshore mudbank, makes the water surface smoother. The high near-bed sediment load (fluid mud layer), commonly on
the top of the bank, tends to attenuate water ripples by changing capillary motion and can be reflected by lower backscatter.
(3) Conversely, waves breaking over a consolidated mud bed will increase the water surface roughness. Similarly, depending on wave conditions, a sudden rise in the seabed can cause breakers that show up in the images in the form of a lineation at the discontinuity (Vogelzang et al., 1997).
The main objective of the present study is to test the potential of European Remote Sensing Satellite (ERS) and RADARSAT images to detect and map mudbanks. Images obtained between 1997 and 2001 have been studied in the light of variable acquisition parameters and tidal conditions. The radar images are compared to optical images obtained from the advanced spaceborne thermal emission and reflection radiometer (ASTER) sensor.
The present study aimed to determine the capabilities of remote sensing tools, specifically in terms of mapping mudbanks and coastline monitoring. This article presents the data used, the interpretation of radar and optical images, and the results obtained.
Database description
Six RADARSAT images, two ERS images, and three ASTER images were studied. The radar images, obtained between February 1997 and May 2001, have incidence angles of 28°–47° for the RADARSAT images and about 23° for the ERS images. The ASTER images have 14 spectral bands, from the visible to the thermal infrared. Table 1 lists the specifications of the images used.
The radar images were radiometrically calibrated for the purpose of converting signal intensity to the backscattering coefficient σo (Laur, 1992; Shepherd, 1997). The radar and
optical images were then geometrically corrected based on ground-control points taken from the Institut Géographique National, Paris (IGN) topographic base maps at 1 : 25 000 scale (Universal Transverse Mercator (UTM), zone 22, International 1909). To improve the quality of the radar images without losing information, they were filtered using a 3 × 3 median filter. The radar images were processed to enhance the detection of geomorphic features. Referencing accuracy was about 20 m.
Data concerning tidal level, tidal phase, wind speed and direction, and rainfall were available for the dates that the satellite images were acquired (Table 1).
Tidal height was recorded using two tide gauges located at Kourou (5°10′N, 52°37′W) and Cayenne (4°57′N, 52°20′W), managed by the Direction departementale de l’équipement (DDE). Data were derived from digital tidal curves, giving a tidal amplitude accuracy of the order of 1 cm. For certain dates, when data were lacking for one or both of the stations, the relationship between the stations was analysed using tidal
predictions of SHOM. This analysis revealed an average difference between tidal heights measured at Kourou and Cayenne of approximately 0.11 m (Kourou = Cayenne – 0.11 m). For those dates where no tidal curves were available (7–04–2001 and 8–03–2001), the values derived from the tidal curves at Kourou and Cayenne were compared against those predicted by SHOM for certain dates; the average difference proved to be minor (+0.04 m for Kourou and +0.05 m for Cayenne). The variance between the tidal predictions and the tidal curves is nevertheless lower for Kourou than for Cayenne. Thus, to calculate tidal height at Kourou, we used the SHOM predictions for Kourou corrected for the average variance observed between the tidal curve for Kourou and the predicted value (+0.04 m). To calculate tidal height at Cayenne, we simply added 0.11 m to the value estimated for Kourou.
The tidal heights for the images vary between 1.05 and 2.88 m for the Kourou station and between 1.16 and 2.99 m for the Cayenne station (tidal height is the instantaneous altitude of the sea surface above low-water datum).
The meteorologic data were provided by Météo France. The wind data averaged over 3 h vary slightly depending on the station (maximum 20° for wind direction and 2 m/s for wind speed). The adopted values correspond to the average for the four available stations (3 at Kourou and 1 at Cayenne). The rainfall data, measured with a 6 min interval, reveal no rain for the dates when the images were acquired.
No wave observations or measurements were available for the Guianese shoreline and coastal zone. The waves that reach the shore are generated by wind conditions over the Atlantic; they are essentially derived from the northeast, where trade winds persist throughout the majority of the year.
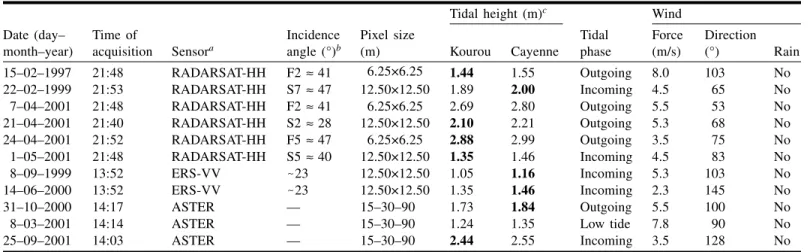
Tidal height (m)c Wind
Date (day– month–year) Time of acquisition Sensora Incidence angle (°)b Pixel size (m) Kourou Cayenne Tidal phase Force (m/s) Direction (°) Rain 15–02–1997 21:48 RADARSAT-HH F2≈41 6.25×6.25 1.44 1.55 Outgoing 8.0 103 No 22–02–1999 21:53 RADARSAT-HH S7≈47 12.50×12.50 1.89 2.00 Incoming 4.5 65 No 7–04–2001 21:48 RADARSAT-HH F2≈41 6.25×6.25 2.69 2.80 Outgoing 5.5 53 No 21–04–2001 21:40 RADARSAT-HH S2≈28 12.50×12.50 2.10 2.21 Outgoing 5.3 68 No 24–04–2001 21:52 RADARSAT-HH F5≈47 6.25×6.25 2.88 2.99 Outgoing 3.5 75 No 1–05–2001 21:48 RADARSAT-HH S5≈40 12.50×12.50 1.35 1.46 Incoming 4.5 83 No 8–09–1999 13:52 ERS-VV -23 12.50×12.50 1.05 1.16 Incoming 5.3 103 No 14–06–2000 13:52 ERS-VV -23 12.50×12.50 1.35 1.46 Incoming 2.3 145 No 31–10–2000 14:17 ASTER — 15–30–90 1.73 1.84 Outgoing 5.5 100 No
8–03–2001 14:14 ASTER — 15–30–90 1.24 1.35 Low tide 7.8 90 No
25–09–2001 14:03 ASTER — 15–30–90 2.44 2.55 Incoming 3.5 128 No
aHH, horizontal transmit, horizontal receive; VV, vertical transmit, vertical receive. bThe letters F and S represent fine mode and standard mode, respectively. cThe tidal heights in bold were derived from tidal curves.
Mudbank monitoring
The potential of radar imagery
Interpretation of radar images
The radar images were interpreted according to incidence angle and tidal height. The geomorphic features described previously were observable in the processed images from the ERS and RADARSAT scenes. The interaction between the radar wave and the mudbanks is affected mainly by surface roughness, and this is reflected in turn by the return signal. Two roughness states related to the geomorphic features were recognised: a smooth state corresponding to fluid mud layers, and a rough state corresponding to slikke compartments. Microcliffs and ridges provide typical high backscattering coefficients.
The image acquired on 15–02–1997 (Figure 3a) shows the location of the part of the mudbank that is either above water or under a shallow layer of water at low tide level (region labelled 1). Easily identifiable and corresponding to bare and smooth mud or flat calm water, this part of the bank yields a low radar response. It is easily recognised owing to the low tidal height (1.55 m) at the moment the image was taken. A slikke is detectable in the same image, mostly above water at the time of acquisition, and with a mangrove in its early stage of colonization (region 2). It is characterized by a high radar backscatter with a heterogeneous distribution. The mature mangrove is also characterized by a high backscatter response, but this time with a very homogeneous distribution. Inland from region 2, a few low-backscatter areas are noted, corresponding to flat calm water or to a network of mudflat streams. The appearance of a slikke in front of the mouth of the Kaw River was observed during a field survey in 1998 (Lefebvre et al.2). The present radar image indicates that the
slikke was already present in 1997.
In the RADARSAT image taken on 1–05–2001 (Figure 3b), a mudflat some 1500 m wide and extending 6 km into the mouth of the Mahury River is easily identified (region 3). Because of the low tidal height (1.46 m) at the moment the image was acquired, the mudflat is either emerged or under a shallow layer of water. Region 1 of the mudbank in the 15–02– 1997 ERS-1 image caused the coast to prograde in places over a period of 4 years (Figure 3b, region 4). By comparing the 15– 02–1997 image (Figure 3a, region 1) with the 1–05–2001 image (Figure 3b, region 3), we note a westward migration of the mudbanks and confirm a rate of migration of about 1 km per year (Froidefond et al., 1988).
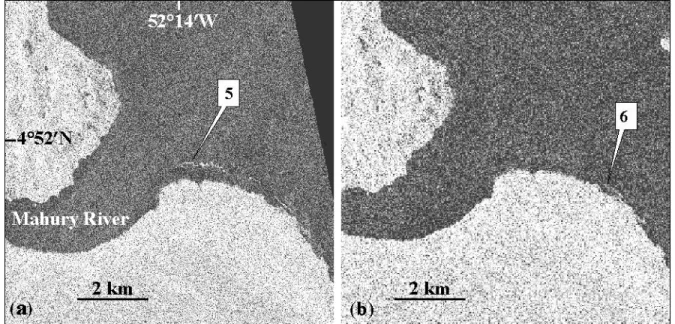
Tidal height for the RADARSAT image taken on 7–04–2001 (Figure 4a) was about 2.80 m, and only the edge of the mudcape is distinguishable by the presence of a high-backscatter lineation (region 5). The bright radar response observed at the lineation in region 5 represents a mudflat formed by accumulating sediments. The ground truthing carried out in 2002 in this area indicates that this signal feature is related to the existence of a microcliff some 0.30 m high. In the image taken on 24–04–2001 (Figure 4b), this lineation is barely visible over a small portion of the bank (region 6). This could be due to (i) tidal height, which was 19 cm higher at the time; (ii) the difference in incidence angle (40° on 7–04–2001 and 47° on 24–04–2001); or (iii) a difference in wave action.
In the ERS image taken on 8–09–1999 (Figure 5a) we can locate the slikke portion of the mudbank that extends 20 km from Kourou to Cayenne, with a maximum width of 4 km. Part of this slikke is above water, and part is under a shallow layer of water. The area generally shows low backscatter (smooth, wet mud or a shallow layer of calm water) interrupted locally by very high backscatter (ridges). The drainage networks are also visible in Figure 5a, which yield an intermediate radar response (region 7). In the image dated 14–06–2000 (Figure 5b)
Figure 3. The potential of radar imagery in detecting mudbanks (Mahury): (a) 15–02–1997 (H = 1.55 m,θ= 41°, RADARSAT-HH); (b) 1–05–2001 (H = 1.46 m,θ= 40°, RADARSAT-HH). The numbers are regions referred to in the text. Land–water boundary from the 1–05–2001 image in red and from the 7–05–2001 image in green.
2J.P. Lefebvre, F. Dolique, and N. Gratiot. Geomorphic evolution of coastal mudflat under oceanic influences: an example from the dynamic shoreline of French Guiana. Marine Geology. In preparation.
we note areas of ocean with a low radar response (region 8), possibly produced by atmospheric disturbance (Trebossen et al., 2001). The sedimentation at the mouth of the Mahury River is clearly depicted in the image taken on 8–09–1999 (Figure 6a, region 9), being major along the right bank and minor along the left bank.
Incidence angle and tidal height
Three factors seem to be important in controlling radar reflectance within our study area: (i) the effect of incidence angle θ, (ii) the relationship between radar signal and tidal
height H (relative to low-water datum) at the moment the image was taken, and (iii) the wave conditions. Owing to the lack of data, the effect of wave forcing was not quantified in this study. Although the various field investigations carried out during the Programme National d’Environnement Côtier (PNEC) national programme for coastal environments (2000–2004) helped during image interpretation, the opportunities for ground truthing coinciding with imagery were very limited. The following analysis thus remains subject to discussion and interpretation.
Figure 5. The potential of radar imagery in detecting mudbanks (Kourou): (a) 8–09–1999 (H = 1.05 m,θ= 23°, ERS-VV); (b) 14–06–2000 (H = 1.35 m,θ= 23°, ERS-VV). The numbers are regions referred to in the text.
Figure 4. The potential of radar imagery in detecting mudbanks (Mahury): (a) 7–04–2001 (H = 2.80 m,θ= 41°, RADARSAT-HH); (b) 24–04–2001 (H = 2.99 m,θ= 47°, RADARSAT-HH). The numbers are regions referred to in the text.
A comparison between images, presented in the following points, enables a better understanding of the effects of the angle of radar incidence and tidal height.
(1) The images taken on 1–05–2001 and 7–04–2001 have similar incidence angles (40° and 41°, respectively), and a time gap that is small enough to assume that no major geomorphic evolution occurred between the two (Figures 3b and 4a). Any differences between the images would thus be due to oceanic conditions (wave, tidal height (H), etc.). One area, which appears submerged on 7–04–2001, is above water on 1–05–2001 (Figure 3b, region 10). Tidal heights were 2.80 and 1.46 m, respectively, when the images were taken. Since the images were taken only 1 month apart, the emergence of this area in the 1–05–2001 image is attributed to this large difference in tidal height. The mudflat area extends 1 km offshore in places. The bright band labelled 5 in
Figure 4a may represent waves breaking at the
submerged seaward scarp margin of region 10 in
Figure 3b. This margin may correspond to a “bar-like”
mud feature, as reported by Allison et al. (1995) along the Cabo Orange at the border between French Guiana and Brazil. The authors reported a colonization of the bar-like feature in a few months, and a similar observation is also deduced from the optical image interpretation presented in the subsections to The potential of optical imagery. The variations observed between these two images are essentially due to the difference in tidal height (about 1.34 m). Such a large difference means that it is difficult to analyse the influence of the tidal phase, which was outgoing on 7–
04–2001 and incoming on 1–05–2001. The wind conditions were similar for the two dates (cf. Table 1). (2) The images taken on 7–04–2001 and 24–04–2001
(Figures 4a and 4b) represent a case of more
comparative tidal heights (2.80 and 2.99 m at Cayenne, respectively). The lineation observed in the 7–04–2001 image, representing an area of high backscatter (Figure 4a, region 5), is only partially visible in the 24– 04–2001 image (region 6). This could be because of the difference in incidence angle (41° on 7–04–2001 and 47° on 24–04–2001) and (or) the small difference in tidal height associated with a higher elevation of region 6 compared with region 5 (0.19 m). Between 7–04–2001 and 1–05–2001, the wind regime moved progressively from the northeast (50°) to the east (80°). The early April swell is derived from the northeast, whereas the late April swell is derived from the east. Thus, the wave incidence along the shoreline changes considerably in the two images. In addition, the swell from the east is not as strong as that from the northeast. The wave breaking in the 7–04–2001 image (region 5) is no longer observed in the 24–04–2001 image because of a higher tidal height and a lower amplitude swell at this time. The tidal phase was outgoing for both images and thus cannot explain any differences.
(3) For the images taken on 7–04–2001 and 21–04–2001 (Figures 4a and 6b), the difference in tidal height was 59 cm (2.80 and 2.21 m, respectively, at Cayenne). Wind conditions and tidal phase were similar during acquisition of the two images. The 14 days separating the two images is considered too short for any major geomorphic
Figure 6. The potential of radar imagery in detecting mudbanks (Mahury): (a) 8–09–1999 (H = 1.16 m,θ= 23°, ERS-VV); (b) 21–04–2001 (H = 2.21 m,θ= 28°, RADARSAT-HH). The numbers are regions referred to in the text. Land– water boundary from the 1–05–2001 image in red and from the 7–05–2001 image in green; mudflat boundary located at region 3 in the 1–05–2001 image in blue.
evolution. There is a large difference in incidence angleθ (41° on 7–04–2001 and 28° on 21–04–2001), which provides a good basis for image comparison. The mudbank marked by the high-backscatter lineation in the 7–04–2001 image (Figure 4a, region 5) is mostly above water in the 21–04–2001 image. This indicates that the mudbank was under a shallow layer of water (59 cm maximum) in the 7–04–2001 image. The part of the bank farthest from the coast (Figure 6b, region 11) is above water in the 1–05–2001 image (H = 1.46 m), but unidentifiable in the 21–04–2001 and 7–04–2001 images. It would have been under 0.75 and 1.34 m of water at the most on these two dates, respectively. Concerning the wave conditions prevailing during acquisition of the two images, the mudbank would no longer affect the water surface for a water depth greater than 0.75 m. Furthermore, mudflat area 3 (between the red and the blue lines in Figure 6b), which is emerged in the 1–05– 2001 image (H = 1.46 m andθ= 40°, Figure 3b), is no longer visible in the 21–04–2001 image (H = 2.21 m and
θ = 28°), except for a narrow band alongshore (Figure 6b, dark lineation labelled 12) represented by very low backscatter (smooth area). Considering the short time delay between the two images, it is almost impossible for the 3.2 km2 of mudflat to have
disappeared. The narrow band of mudflat along shore (region 12) is easily distinguished as compared to the grey level observed in Figure 3b. This is probably because of the low incidence angle. From the intercomparison of the 7–04–2001, 21–04–2001, and 24– 04–2001 images, it would seem that if the bank is under a shallow (a few tens of centimetres) layer of water, then it could alter the sea surface, and thus be detectable in the images. For a water depth of 0.7 m or more, however, it would no longer sufficiently alter the sea surface, and thus be undetectable in the images.
(4) In the image taken on 21–04–2001 (Figure 7b), a few thin linear elements of the shoreward margins are recognised (regions 13 and 14) that are not entirely visible, nor as clear, as in the 1–05–2001 image (Figure 7a), despite tidal height being some 0.75 m higher than in the 1–05–2001 image (H = 1.46 m). The images were acquired during different tidal phases, outgoing on 21–04–2001 and incoming on 1–05–2001. It is not possible to analyse the influence that this variable has on the ability to detect linear features. Wind strength and direction were similar during acquisition of the two images (cf. Table 1). This comparison seems to confirm the advantage of images with a low incidence angle for detecting linear features (θ= 28° for 21–04–2001 andθ= 40° for 1–05–2001).
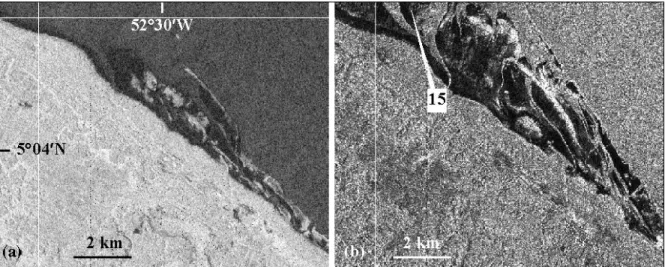
(5) The Kourou mudbank appears much wider in September 1999 than in February 1999 (Figures 8b and 8a, respectively). For example, part of the Kourou bank is above water in the 8–09–1999 image and submerged in the 22–02–1999 image (Figure 8b, region 15). This is due to the low tidal height in September (0.84 m difference in tidal height between the two images), probably accentuated by extension of the mudflat itself during the 7 months separating the two images. The offshore extension of some 3 km observed between the two images is related to a mean slope of 1/4000 m, which is significantly lower than the mean value for stable mudflats of 1/1600 m (Froidefond et al., 1988). Areas of bare mud are easily detectable in Figure 8b, which may again be due to the low incidence angle (47° for the image taken in February compared with 23° for the image taken in September).
(6) A larger area of the Kourou bank was emerged in June 2000 than in September 1999 (Figures 5b and 5a, respectively), despite a tidal height of 1.35 m in June
Figure 7. The potential of radar imagery in detecting mudbanks (Mahury–Cayenne): (a) 1–05–2001 (H = 1.46 m,θ= 40°, RADARSAT-HH); (b) 21–04–2001 (H = 2.21 m,θ= 28°, RADARSAT-HH). The numbers are regions referred to in the text.
2000 compared with 1.05 m in September 1999. Considering the 9 months separating these two images, this difference is simply due to the natural evolution of the mudbank (sedimentation). However, the land–water boundary has not changed. The major sedimentation that occurred between September 1999 and June 2000 is not surprising, as it corresponds to the most active period of winds and wave forcing (Nedeco, 1968).
The potential of optical imagery
Interpretation of optical images
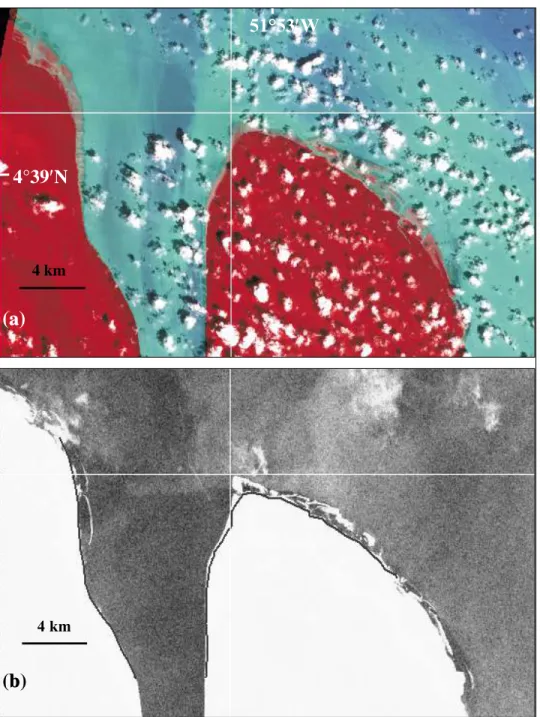
Cartography becomes more complex in humid tropical zones because of the poor representation by optical satellite imagery for climatic reasons. Not many optical images are available for French Guiana. Figure 9 is an ASTER false colour composite taken on 25–09–2001 using channels 4 (1.6–1.7 µm, short-wave infrared (SWIR)), 2 (0.63–0.69 µm, visible and near-infrared (VNIR)), and 1 (0.52–0.60µm, VNIR), corresponding to the red, green, and blue filters, respectively.
Figure 8. The potential of radar imagery in detecting mudbanks (Kourou): (a) 22–02–1999 (H = 1.89 m,θ= 47°, RADARSAT-HH); (b) 8–09–1999 (H = 1.05 m,θ= 23°, ERS-VV). The number is a region referred to in the text.
Figure 9. The potential of optical imagery in detecting mudbanks (Mahury): ASTER image
taken on 25–09–2001 (H = 2.55 m). The numbers are regions referred to in the text. Land–water boundary from the 1–05–2001 image in red, from the 7–04–2001 image in green, and from the 21–04–2001 image in white; mudflat boundary located at region 3 in the 1–05–2001 image in blue.
In the ASTER image, the various areas shown are represented by different spectral signatures. Onshore, the mature mangrove cover appears as a deep red colour. In the coastal areas, the emerged part of the mudbanks can be distinguished by their grey colour, with the red spots corresponding to patches of growing mangrove. Offshore, the colours range from light green and blue along the shore, shading to darker blue farther offshore. The colours represent sediment-laden coastal waters of relatively shallow depth, and then a deepening of the water column with less sediment load.
The clouds appear in white and may have a black outline representing the shadow they cast.
As for the mudflat labelled region 10 (Figure 9), spectral variations are noted in the ASTER image; red represents the emerged part of the mudbank covered by mangrove, darker colours represent the emerged parts of the bank without vegetation, and blue–green represents the submerged part of the bank.
Figure 10. The potential of optical imagery in detecting mudbanks compared to that of a
RADARSAT image (Approuague River to the east of Kaw): (a) ASTER image taken on 31–10– 2000 (H = 1.84 m); (b) RADARSAT image taken on 22–02–1999 (H = 2.00 m,θ= 47°). Land– water boundary from the 31–10–2000 image in green.
Comparison between optical and radar images
A comparison between the 31–10–2000 ASTER image (H = 1.84 m) and the 22–02–1999 radar image (H = 2.00 m) (Figures 10a and 10b), which have very similar tidal heights (0.16 m difference), reveals good consistency concerning the location of the land–water boundary and the mudcapes, despite a gap of 18 months between the two. The mudcape has not changed significantly in this part of the coast.
A comparison between the ASTER image taken on 25–09– 2001 (Figure 9) and the radar images highlights the topographic and textural situation of the right part of the Mahury River mouth. The following analysis is proposed, bearing in mind that a gap of 5 months exists between the acquisition of the radar images (April–May 2001) and acquisition of the ASTER image (September 2001). Considering the natural geomorphic evolution that may have taken place, the land–water boundary observed in the ASTER image is in good agreement with those of the 1–05–2001 and 21–04–2001 radar images (red and white lines). Furthermore, there is a satisfactory agreement between the limit of vegetation and the land–water boundary observed in the 7–04–2001 radar image (green line). Considering the tidal heights associated with the time of acquisition of these four images, region 10 is a mudcape that shows only a minor topographic variation, between H = 2.55 m and H = 2.80 m. Furthermore, the small patches of mangrove observed in region 10 are associated with a recent and sparse plant colonization. Consequently, the high-backscatter response of region 10 observed 5 months earlier in the 1–05–2001 and 21–04–2001 radar images (Figures 3b and
6b) is not due to a young mangrove, but to bare mud
undergoing the processes of consolidation. Hence, radar backscatter may be very high without any vegetation cover. The low-backscatter response of the soft fluid mud layer provides a drastic contrast and thus makes the radar system a useful tool for the interpretation of mudbank features.
Considering the natural morphodynamics that may have occurred, the land–water boundary observed in the ASTER image of 25–09–2001 is in good agreement with the radar image of 21–04–2001 (white line). By comparing the 25–09– 2001 ASTER image (H = 2.55 m) with the 7–04–2001 radar image (H = 2.80 m) (green line, Figure 9), we note that when tidal levels are high and similar and the time gap is small, then the optical image is preferable because it yields a better mapping of the mudbanks. For the same case, the radar image provides less information. In the 7–04–2001 image, the only visible signs are high-backscatter lineations corresponding to microcliffs (region 5, Figure 4a).
The soft mudflat detected in the 1–05–2001 radar image (region 3) is not visible (submerged) in the ASTER image. The blue–green colour observed in this coastal area does not seem indicative of a mudflat because it extends well beyond the outer edges of the mudflats detected in the radar image. The colour of the water in the image may in fact be related to both the sediment load in the water and the depth to the seabed (representative of turbidity). Region 3 is certainly subjected to active erosion and vertical mixing processes. Owing to the very
low settling velocity of cohesive sediments in this region (2 × 10⁻⁵– 2 × 10⁻⁴m/s; Gratiot and Lefebvre, 2002), the turbidity plumes associated with areas of erosion commonly extend over a long distance. This limits the potential of optical images in accurately locating the submerged parts of mudbanks. This drawback is also valid for radar images and, during this work,
Figure 11. Comparison between optical and radar imagery for
detecting mudbanks (Kourou): (a) ASTER image taken on 8–03– 2001 (H = 1.24 m); (b) ERS image taken on 14–06–2000 (H = 1.35 m,θ= 23°); (c) ERS image taken on 8–09–1999 (H = 1.05 m, θ= 23°).
no significant signature was identified for water depths exceeding a few tens of centimetres.
In the case of low and similar tidal heights, comparing the ASTER image taken on 8–03–2001 (H = 1.24 m) with the ERS images taken on 14–06–2000 (H = 1.35 m) and 8–09–1999 (H = 1.05 m) (Figures 11a, 11b, and 11c, respectively) reveals that the information concerning the mudbank is more detailed with radar imagery. This highlights the advantage of radar
images with a low incidence angle compared to optical images. Between June 2000 and March 2001, the mudbank migrated westwards, with mudflat retreat to the southeast and accretion to the northwest. This trend was confirmed by field observations carried out in 2001. Surprisingly, this cannot be seen in the ASTER image. This led us to conclude that the ASTER image does not provide sufficient data concerning the extension of the mudbank that, according to the image but in
Figure 12. The potential of radar imagery in monitoring coastline change (erosional and
depositional cycles): (a) composite radar image from 15–02–1997 in red (H = 1.55 m,θ= 41°), 14–06–2000 in green (H = 1.46 m,θ= 23°), and 1–05–2001 in blue (H = 1.46 m,θ= 40°); (b) the various directions of coastal movement are shown by superposing the land–water boundaries from the images taken on 14–06–2000 (blue) and 1–05–2001 (red) over the image taken on 15– 02–1997.
contradiction with field observations, had mostly disappeared. This remains to be confirmed on the basis of the radar and optical images acquired on similar dates.
Coastline change
Coastline mapping provides information that is important for both coastal management and coastal development. In view of the difficulties associated with coastal access, the use of radar data can make the task of mapping easier and faster because, unlike optical data, radar data are available regardless of the cloud cover. Thus, by using multidate ERS and RADARSAT image sequences, we can monitor coastline change.
A composite image is shown in Figure 12a to illustrate coastline change over time. We selected images with similar tidal heights and reasonably large time gaps between them (15– 02–1997 with H = 1.55 m, 14–06–2000 with H = 1.46 m, 1–05– 2001 with H = 1.46 m). This figure shows that radar imagery is well suited for mapping and updating coastline change in many areas. Significant changes are observed locally (between 500 and 1000 m over 3 or 4 years). Similar results have been obtained using RADARSAT images on the Guiana coastline (Singhroy, 1996; Allard, 1997). Figure 12b illustrates the various directions of coastal movement by superposing the land–water boundary from the 1999 and 2001 images over the image taken on 15–02–1997. This is an efficient way of observing where marked erosion and deposition occur.
The land–water boundary is much clearer in the images with high incidence angles (15–02–1997, 7–04–2001, 24–04–2001, and 1–05–2001;θ> 40°) and less visible in the image taken on 21–04–2001 (θ= 28°) and the images taken on 14–06–2000 and 8–09–1999 (θ= 23°). Therefore, a higherθvalue is preferable when mapping the coastline using radar images. The RADARSAT images yield a better definition of the coastline because of the high incidence angles that can be obtained.
Conclusions and outlook
The negative economic impacts that mudbank migration can have on the French Guiana coast in terms of tourism, fisheries, and harbour dredging demonstrate the need to find new detection methods capable of tracking these movements in near-real time. The ability to detect variations in sea surface roughness from radar images is advantageous in that these data are not affected by cloud cover. A change in roughness tends to be associated with either an increase due to microcliffs or mud roughness on slikkes, or a decrease due to fluid mud layers and soft mudflats. In this context, satellite images could provide a tool of choice for acquiring up-to-date, repetitive data that are capable of providing decision-makers with useful tracking information. With appropriate programming, the satellite images could be made into databases that could be essential in coastal management.
The purpose of this study was to define a methodology for monitoring change in the coastal environment in an equatorial
climatic zone, to help establish a process for rapid evaluation, and to propose a practical tool for locating the position of mudbanks. For better detection, the images should be acquired on dates when the tidal level is low. Low-angle radar is best suited to mapping the mudbanks (slikkes, mudflats, and fluid mud layers), whereas high-angle radar is better adapted to monitoring the coastline. The present work reveals that no clear signature can be related to mudbanks when water depth exceeds a few tens of centimetres. For high tidal levels, the optical images seem to provide more information on the mudbanks than the radar images. Conversely, for low tidal levels, the information on the mudbanks is more detailed with radar imagery. These two observations nevertheless merit confirmation through the analysis of radar and optical images acquired on similar dates. For a more accurate analysis of how radar and optical signal response vary with depth, shallow-water bathymetric readings will be needed in the future.
Conditions for radar-image acquisition must be chosen wisely to obtain the best analysis of the images. The theoretical advantages of radar images should be tested on a larger number of images, by planning depth soundings in mudbank areas on the same dates as radar acquisitions. Whenever possible in these cloudy areas, radar-image analysis should be complemented with optical data (Satellite pour l’observation de la terre (SPOT), LANDSAT, ASTER).
While using satellite imagery is indeed quick and relatively inexpensive compared to conventional field methods, it has also done away with certain limitations of the older sensors, the primary one being the difficulty of obtaining images in real time (it was impossible to program image acquisition on ERS, for example.) The new ENVISAT–ASAR radar sensor and sensors to be launched in the near future (RADARSAT-2, etc.) are multipolarizing, which will undoubtedly improve the characterization of our coastal environments.
Acknowledgments
This article was written as part of a study funded by the Research Division of Bureau de Recherches Géologiques et Minières (BRGM) and the Programme National de l’Environnement Côtier (PNEC). Thanks to Georges Delpont and Christine King for their cooperation and advice. The images were provided free of charge by RADARSAT International (RSI) as part of the ADRO-2 project. The tidal gauge data were supplied by the DDE-Guyane Hydrographic Department.
References
Allard, J.F. 1997. Cartographie de l’évolution du trait de côte en Guyane de
1950 à 1994. Rapport BRGM R-39506, Bureau de Recherches Géologiques et Minières, Orléans, France.
Allison, M.A., Nittrouer, C.A., and Kinike, G.C. 1995. Seasonal sediment storage on mudflats adjacent to the Amazon River. Marine Geology, Vol. 125, pp. 303–328.
Augustinus, P.G. 1978. The changing shoreline of Surinam (South America). Ph.D. thesis, University of Utrecht, Utrecht, The Netherlands. 232 pp. Baghdadi, N., King, C., Bourguignon, A., and Remond, A. 2002. Potential of
ERS and RADARSAT data for surface roughness monitoring over bare agricultural fields. International Journal of Remote Sensing, Vol. 23, No. 17, pp. 3427–3442.
Eisma, D., Augustinus, P., and Alexander, C. 1991. Recent and sub-recent changes in the dispersal of Amazon mud. Netherlands Journal of Sea
Research, Vol. 28, pp. 181–192.
Froidefond, J.M., Pujos, M., and Andre, X. 1988. Migration of mud-banks and changing coastline in French Guiana. Marine Geology, Vol. 84, pp. 19–30. Gratiot, N., and Lefebvre, J.P. 2002. Dynamic of mud banks in French Guiana:
an experimental investigation of sediment settling processes. In
Proceedings of the 27th General Assembly of the European Geophysical Society, 21–26 April 2002, Nice, France [CD-ROM]. European Geophysical Society (now European Geosciences Union), Katlenburg-Lindau, Germany.
Laur, H. 1992. Derivation of backscattering coefficient sigma-0 in ERS-1 SAR
PRI products. European Space Agency, Noordwiijk, The Netherlands. Nedeco. 1968. Surinam transportation study: report on hydraulic
investigation. Netherlands Engineering Consultants (Nedeco), The Hague, The Netherlands. 293 pp.
Rakotoarivony, L., Taconet, O., Vidal-Madjar, D., Bellemain, P., and Benallègue, M. 1996. Radar backscattering over agricultural bare soils.
Journal of Electromagnetic Waves and Applications, Vol. 10, No. 2, pp. 187–209.
Shepherd, N. 1997. Extraction of beta nought and sigma nought from
RADARSAT CDPF products. Report AS97-5001, Canadian Space Agency, Ottawa, Ont.
Singhroy, V. 1996. Interpretation of SAR images for coastal zone mapping in Guyana. Canadian Journal of Remote Sensing, Vol. 22, No. 3, pp. 317–328. Trebossen, H., Rudant, J.P., and Classeau, T. 2001. Contribution of radar SAR imagery for mapping coastal’s areas: examples of sedimentational and erosional zones in French Guiana and Mauritania. In Proceedings of the 6th
International Conference on Remote Sensing for Marine and Coastal Environments, 1–3 May 2000, Charleston, S.C. Veridian ERIM International, Ann Arbor, Mich. Vol. 2, pp. 398–405.
Vogelzang, J., Ruddick, K.G., and Moens, J.B. 1997. On the signatures of river outflow fronts in radar imagery. International Journal of Remote Sensing, Vol. 18, No. 16, pp. 3479–3505.
Wells, J.T., and Coleman, J.M. 1981. Physical processes and fine-grained sediment dynamics, coast of Surinam, South America. Journal of