HAL Id: hal-03111873
https://hal.archives-ouvertes.fr/hal-03111873
Submitted on 15 Jan 2021HAL is a multi-disciplinary open access archive for the deposit and dissemination of sci-entific research documents, whether they are pub-lished or not. The documents may come from teaching and research institutions in France or abroad, or from public or private research centers.
L’archive ouverte pluridisciplinaire HAL, est destinée au dépôt et à la diffusion de documents scientifiques de niveau recherche, publiés ou non, émanant des établissements d’enseignement et de recherche français ou étrangers, des laboratoires publics ou privés.
Spontaneous Emission of Vector Vortex Beams
Domitille Schanne, Stéphan Suffit, Pascal Filloux, Emmanuel Lhuillier, Aloyse
Degiron
To cite this version:
Domitille Schanne, Stéphan Suffit, Pascal Filloux, Emmanuel Lhuillier, Aloyse Degiron. Spontaneous Emission of Vector Vortex Beams. Physical Review Applied, American Physical Society, 2020, 14 (6), pp.064077. �10.1103/PhysRevApplied.14.064077�. �hal-03111873�
1
Spontaneous Emission of Vector Vortex Beams
Domitille Schanne1, Stéphan Suffit1, Pascal Filloux1, Emmanuel Lhuillier2, Aloyse Degiron1,*
1Université de Paris, CNRS, Laboratoire Matériaux et Phénomènes Quantiques, F-75205
Paris, France
2Sorbonne Université, CNRS, Institut des NanoSciences de Paris, INSP, F-75005 Paris,
France
ABSTRACT: Harnessing the spontaneous emission of incoherent quantum emitters is one of
the hallmarks of nano-optics. Yet, an enduring challenge remains—making them emit vector
beams, which are complex forms of light associated with fruitful developments in fluorescence
imaging, optical trapping and high-speed telecommunications. Vector beams are characterized
by spatially varying polarization states whose construction requires coherence properties that
are typically possessed by lasers—but not by photons produced by spontaneous emission. Here,
we show a route to weave the spontaneous emission of an ensemble of colloidal quantum dots
into vector beams. To this end, we use holographic nanostructures that impart the necessary
spatial coherence, polarization and topological properties to the light originating from the
emitters. We focus our demonstration on vector vortex beams, which are chiral vector beams
carrying non-zero orbital angular momentum, and argue that our approach can be extended to
other forms of vectorial light.
Published version © 2020 American Physical Society available at
2
I. INTRODUCTION
Vector beams are optical modes with a spatially inhomogeneous field structure. Cylindrical
vector beams, for example, are characterized by polarization singularities that can be produced
with birefringent crystals, polarizing prisms, or nanostructured media [1,2]. These elements are
either directly integrated within a laser cavity or used as external passive elements in free space.
Vector vortex beams [3–6], for their part, combine the polarization singularities of cylindrical
vector beams and the properties of scalar vortices [7,8], namely, a phase singularity caused by
chiral helical wavefronts and a non-zero orbital angular momentum. Vector vortex beams are
often generated by making a laser interact with cascading and/or interfering elements so as to
not only generate a non-trivial polarization state, but also impart a non-zero orbital angular
momentum to the mode. As for scalar vortices, this latter condition is usually fulfilled with
phase plates [8], q plates [3,9], phase holograms [10], or optical metasurfaces [4,11].
The many choices at hand to produce such forms of complex light are a consequence of two
basic properties of laser radiation. First, the polarization state of the laser provides a valuable
degree of liberty, as many of the aforementioned approaches only work for specific
polarizations (e.g. circularly polarized modes). Second, the high spatial coherence of lasers
allow them to interact with a variety of structures regardless of the length scales involved in the
formation of the beam.
When placed in a homogeneous environment, the emission of light by an excited atom,
molecule or quantum dot is random, unpolarized and incoherent. However, it was recognized
decades ago that the fluorescence of organic emitters could be rendered linearly polarized and
directional with surface plasmons [12–14], which are electromagnetic modes guided at the
surface of metals. Although not explained in such terms at the time, these results are related to
the coherence lengths of surface plasmons. Rather than emitting light in free space, the
3
exceed several wavelengths, allowing them to leak light into polarized narrow lobes if the
metallic structure is properly designed (e.g. using a Kretschmann-Reather configuration [12] or
by carving a diffraction grating [13,14] at the metal surface).
An impressive number of studies has since built on these pioneering results [15–23]. Problems
that were long deemed extremely challenging have been addressed one by one, including
shaping Planck’s blackbody radiation [15,21], beaming light from individual quantum
emitters [17,18], and, very recently, generating circularly polarized single photons [23]. These
developments have remained focused on the spontaneous emission of conventional scalar
modes into controlled directions of space, even if it is worth noting that the light thus produced
can be subsequently converted into more complex beams using far-field optical elements [24].
In this article, we go a step further and show how to make an assembly of colloidal quantum
dots spontaneously emit optical vector vortex beams.
II. RESULTS
We consider the situation depicted in the inset of Fig. 1(a): a compact layer of PbS colloidal
quantum dots (CQDs) coated on top of a structured Au plane. The CQDs have an average
diameter of 5-6 nm, they are capped by oleic acid and emit in the near-infrared range [Fig. 1(b)].
At the basis of our design strategy is the hypothesis that the CQDs are not quenched by the
presence of the metal. Furthermore, we posit that their photoluminescence predominantly
excites the plasmon modes of the system (these assumptions will be justified later). When the
sample is pumped by a laser focused on the surface, the area of excited dots can be considered
in a first approximation as a point source of plasmons that propagate radially in all directions
4
To convert these plasmons into light, we decorate the Au surface with a grating to make them
diffract into free space. Different from the periodic patterns usually chosen to accomplish this
function [13,14], we imprint a holographic topological defect into the grating to generate a
vector vortex beam with a mth order phase singularity at its center, m being the topological
charge of the mode [Eq. (2) of the Appendix]. The resulting pattern is an m-arm Archimedean
spiral, which is a variant of the celebrated fork hologram used to generate optical vortices with
free-space Gaussian laser beams [10]. To predict the intensity and phase distribution of the
beam resulting from the radiative decoupling of the surface plasmons, we calculate the far-field
diffraction pattern of the leaked radiation in the scalar Fraunhofer approximation [Eq. (3) of the
Appendix].
Figure 1(a) shows a scanning electron micrograph of a structure designed to launch a vector
vortex beam with topological charge m=3. The total radius of the structure is 100 µm, the
spiraling grooves are 25 nm thick and the distance between two adjacent grooves (radial pitch)
is 1.095 µm. Although not visible at this magnification, the spiral is coated by a continuous
carpet of two to three monolayers of PbS CQDs. The sample is characterized with a custom
upright microscope. To excite the CQDs, a 633 nm HeNe laser is focused with a 50X objective
on the surface of the sample. The photoluminescence is collected through the same objective,
separated from the pump using a dichroic mirror, and sent on an imaging spectrograph coupled
to an InGaAs Camera. An additional Bertrand lens is inserted into the optical path to image the
back focal plane of the objective, thus revealing the transverse angular distribution (or,
equivalently, the in-plane wavevectors kx and ky) of the photons emitted by the sample [25].
We first perform a series of experiments in which the focused laser spot excites the CQDs at
the center of the m=3 spiral. Figure 1(c) shows the angular distribution of the
photoluminescence at three representative wavelengths λ, obtained by imaging the back focal
5
normalized units and the relative intensities will be discussed later. The experimental results
are in good agreement with the predictions of the model displayed in Fig. 1(d). For all
photoluminescence wavelengths, a well-defined beam against a weak isotropic background is
observed. Furthermore, the angular distribution of the beam evolves from a large ring at
1050 nm to a small spot at 1100 nm before becoming annular again and increasing in diameter
at larger wavelengths. This evolution reflects the dispersive nature of our design approach based
on the diffraction of surface plasmons, the in-plane wavevectors being fixed by the conservation
of momentum kx + ky = kSP - G, where kSP is the plasmon wavector and G the reciprocal vector
corresponding to the radial periodicity.
At 1100 nm, the calculations predict that the ring becomes very narrow and thus well
collimated; however, the latter does not merge into a spot contrarily to what is observed on the
experimental image. This small discrepancy arises because the model assumes a point source
of radial plasmons while the actual laser pump excites a finite area of CQDs. By refining the
model to take this finite extent into account [Eq. (4) of the Appendix], the calculations become
fully consistent with the experiments, as shown on Fig. S1 [26].
Figure 1(e) represents the calculated phase for the three wavelengths under investigation: in all
cases, the phase is singular at the center of the beam, which is the distinct signature of an optical
vortex with non-zero orbital angular momentum. To verify that the experimental phase is
consistent with these calculations, we take advantage of the fact that two interfering vortices
produce unique signatures that reveal their phase structure and topological charge [8]. Our next
experiment has thus been to fabricate and study a sample combining two spiraling gratings with
opposite windings, so as to simultaneously emit the same beam as before (m=3) together with
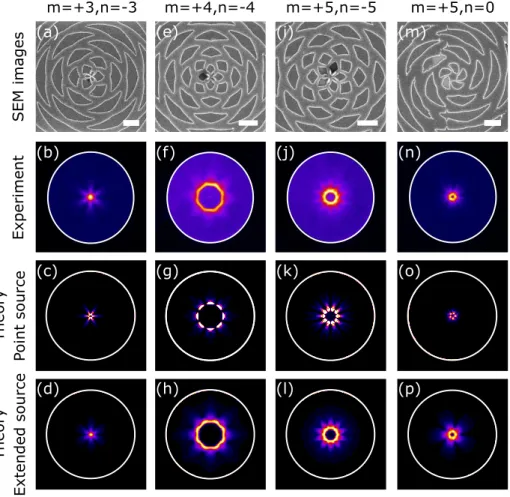
another vortex with opposite topological charge n=-3 [Fig. 2(a)]. The resulting emission
pattern, displayed in Fig. 2(b), features six star-shaped branches that are well reproduced by our
6
[Fig. 2(c)]. It is even possible to achieve a near-perfect agreement with the measurements by
taking into account the fact that the laser pump excites an area of CQDs that does not reduce to
a single point, as shown on Fig. 2(d) where we have evaluated and summed the diffraction
patterns at multiple locations in a region around the hologram center using Eq. (4) of the
Appendix.
The other panels of Fig. 2 suggest that these results can be generalized to arbitrary combinations
of vortices such as (m,n) = (4,-4), (5,-5), and (5,0). The experimental patterns always exhibit
|m-n| arms and are in very good agreement with the calculations, indicating that the beams have
the anticipated topological charges and phase singularities of genuine vortices.
We now examine the polarization state of the beams. In Fig. 3, we have repeated the
experiments shown in Fig. 1 with the same m=3 structure, but with a linear polarizer inserted
between the sample and the InGaAs camera. The different images depict the evolution of the
emission as the polarizer axis is rotated. In all cases, the recorded images feature two lobes
oriented perpendicular to the axis of the polarizer. In other words, the polarization is not
homogeneous in the plane transverse to the propagation but exhibits the characteristics of a
radial vector beam. We note, however, that the intensity of the beam does not strictly fall to
zero in the direction perpendicular to the maxima. Thus, the purity of the vector vortex beam is
good, but not perfect, a result consistent with the fact that the structure has been designed
assuming a single point-source at its center while we have seen previously that a finite area of
CQDs contributes to the emission. This being said, we can say with confidence that the emission
is not an equal mixture of vortices with topological charges ±|m| since we would have otherwise
observed the distinctive interferometric patterns evidenced in Fig. 2.
The results of Fig. 3, shown here only for a three-arm spiral at 1050 nm, hold true for all
wavelengths and all the m-arm spirals that we have tested. This observation can be understood
7
with the same azimuthal angle than their propagation direction. Since in our case, the plasmons
are propagating radially away from the center of the holograms, this radial distribution is also
present in the field structure of the emitted light [27,28].
We next study the emission properties of our structures without the bandpass filters that were
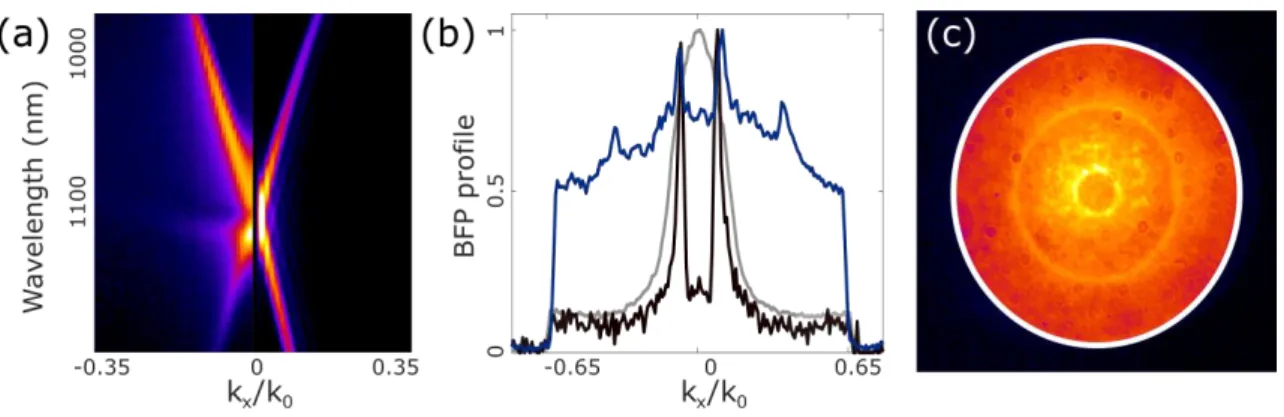
used so far to examine the beams at selected wavelengths. Figure 4(a) compares the
experimental and theoretical dispersion relations of the full polychromatic beam created by the
m=3 spiral. The dispersion of the vortex appears as bright branches that fade away as the beam
divergence increases. To assess this divergence, we have plotted on Fig. 4(b) a cross-section of
the back focal plane for the full polychromatic beam. The full width at half maximum of the
divergence is limited to kx/k0 = ± 0.14, or ± 8°, which is quite narrow considering the large
emission bandwidth of our CQDs [from less than 950 nm to more than 1250 nm, cf. Fig. 1(b)].
A closer look at the experimental dispersion of Fig. 4(a) reveals a small gap between theupper
and lower vortex branches as well as an asymmetric intensity distribution, the maximum of the
luminescence intensity being located on top of the low-energy branch. Such features are another
evidence of the role played by surface plasmons—they are typically observed in diffractive
plasmonic systems [29] and correspond to the formation of two standing waves with different
field symmetries at the center of the first Brillouin zone [30]. While otherwise very accurate,
our model does not capture this anticrossing because the calculations are based on a scalar
description of the surface plasmons. This approximation, which neglects the fact that plasmonic
electric fields have a longitudinal component in addition to a transverse one, is valid in most
cases—but not when field symmetries play a role, as is the case for the opening of a gap in a
dispersion relation [30]. The cost to pay for working with a scalar model is small since most
calculated back focal plane images shown in this study are in excellent agreement with the
8
III. DISCUSSION
Combined together, the results of Figs. 1-4(a) demonstrate that holographic structures, which
have been long used to convert lasing light into vector vortex beams, can be adapted to perform
the same function for the incoherent spontaneous emission of quantum emitters. Despite the
similarities with holograms designed to work with lasers, the operating principles of our
structures differ in several non-trivial ways. In fact, the metallic patterns play a triple role,
explaining the extreme compactness of the structures. First, they ensure that the
photoluminescence occurs under the form of radial surface plasmons with long
coherence/propagation lengths: from the width of the beams, it is possible to estimate this length
as λ/Δθ ≈ 30±4 µm. Second, they ensure that the plasmon diffraction to free-space radiation
modes is a vector beam with radial polarization. Last, their spiraling geometry imparts the
necessary phase singularity and determines the propagation direction and beam divergence.
It is worth noting that our design approach, based on a scalar description of the surface
plasmons, solely focus on this third and last aspect (phase singularity, propagation direction
and beam divergence). As explained above, the radial polarization can be understood without
modelling because it is inherited from the field structure of the radial plasmons involved in the
light emission (coupling of surface plasmons is made to TM radiation modes with respect to
the gratings). We note in passing that an interesting special case is the holographic pattern
obtained with m=0, corresponding to a bull’s eye structure rather than a spiral. In this limit, the
emitted light has no orbital angular momentum and no phase singularity, but it remains a radial
(cylindrical) vector beam with the same polarization behavior as the one evidenced in Fig. 3.
As for the efficient coupling between the emitting layer and the plasmons, we relied on the
recent discovery that a carpet of CQDs cannot be modelled as an ensemble of individual
emitters [31,32]. Rather, their mutual interactions lead to the formation of electron and holes
9
quantum dot LEDs [31] and in the Supplemental Material [26] for the vortex-emitting samples
investigated here. Under such conditions, the usual framework to describe the luminescence of
individual nanosources, based on the local density of optical states and the Purcell effect, does
not apply. In particular, the latter predicts that individual emitters in direct contact with a
metallic surface undergoes complete quenching [17], which is not the case here.
To account for the mutual interactions between the CQDs, a statistical treatment of the
photoluminescence is relevant. It leads to a local version of Kirchhoff law [32] which states
that tailoring the emission of the CQDs is equivalent to tune their absorption cross-section (at
the wavelength of emission). With this picture in mind, we can understand why the CQDs are
not quenched and why all the features evidenced in our experiments originate from the
diffracted plasmons—they are the main electromagnetic modes supported by the system and
their high local fields modify the absorption cross-section of the dots—or, equivalently, their
spontaneous emission. As a comparison, we show on Fig. 4(c) the angular distribution of the
spontaneous emission obtained with a hologram on a glass substrate (i.e., only the corrugations
are made of Au). The other parameters are the same as the image at λ=1200 nm on Fig. 1(c).
The differences are spectacular—not only do we observe two annular rings because the system
supports plasmons with different indices on the glass side and the CQD/air side, but the contrast
between these beams and the background drops at 17%. [see also the cross-sections plotted on
Fig. 4(b)]. This observation is consistent with the fact that for a hologram on glass, free-space
optical modes other than plasmons are allowed in the immediate vicinity of the CQDs, allowing
strong parasitic light to be emitted in addition to the beams of interest.
IV. CONCLUSION AND PERSPECTIVES
In conclusion, we have pushed the control of the spontaneous emission to a complexity usually
achieved with lasers. These results point to further developments in the future. For example,
10
holograms with more elaborated patterns, such as active metasurfaces exploiting the local
Kirchhoff law, as the latter makes it possible to tune the color, polarization state and brightness
of the luminescence at a subwavelength scale [33,34]. In addition, this study on vector vortex
beams shows a path forward to generate other complex beams out of quantum emitters. More
generally, these ideas are valid regardless of the way electrons and holes are generated,
promising also fruitful possibilities for electroluminescence and thermal emission.
ACKNOWLEDGMENTS
We acknowledge support from the European Research Council grant FORWARD (reference:
771688).
CORRESPONDING AUTHOR
11
APPENDIX: EXPERIMENTAL DETAILS AND THEORETICAL MODEL
Chemicals. Octadecene (ODE, Acros Organics, 90%), Lead oxide (PbO, Strem Chemicals,
99.999 %), Oleic acid (OA, Alfa Aesar 90%), Hexamethyldisilathiane (TMS2S, Sigma Aldrich,
synthesis grade), Ethanol (VWR, >99.9%), Toluene (Carlo Erba, >99.8%). Lead oleate
Pb(OA)2 0.1 M: 0.9 g of PbO are mixed in a three neck flask with 40 mL of oleic acid. The
flask is degassed under vacuum for one hour. The atmosphere is switched to Ar and the
temperature raised to 150 °C for two hours. The final solution is typically clear and yellowish.
CQD synthesis. The procedure is inspired from Hines et al. [35]. 12 mL of Pb(OA)2 (0.1 M)
are introduced in the round-bottomed flask. The mixture is stirred and degassed under vacuum
at 100 °C for 30 min. Then the atmosphere is switched to Ar and the temperature is set at 80
°C. Meanwhile, in the glove box a mixture of 400 µL of TMS2S and 20 mL ODE is prepared
in a 20 mL vial. 6 mL of this solution is introduced into a 10 mL syringe. At 80°C, the content
of the syringe is rapidly injected, the solution turns immediately dark. After 1.5 min, the heating
mantle is removed, and the flask is cooled down with fresh air flux. The reaction mixture is
split into two tubes and the particles are precipitated by adding 25 mL of EtOH in each tube.
The mixture is centrifuged at 5000 rpm for 5 min. All the solids are redispersed in 7.5 mL of
toluene and 1 drop of OA is added. The particles are precipitated by adding 10 mL of EtOH
and centrifuged at 5000 rpm. The pellet is dissolved in 10 mL of toluene. The solution is
centrifuged at 5000 rpm, and the formed pellet, containing the non-colloidally stable part is
discarded. We reprecipitate the nanoparticles by adding a tiny amount of ethanol in a weighted
plastic tube. This pellet is then dried in the antichamber of a glovebox, before getting
redispersed in toluene and filtered through a PTFE filter (0.22 µm).
Model. The CQDs excited by the focused laser pump can be considered as a localized source
12
throughout the study is to neglect the vectorial field structure of the plasmons and model their
electric field as a scalar cylindrical wave A:
𝐴(𝑥 − 𝑥𝑖, 𝑦 − 𝑦𝑗) ≈ exp[𝑖𝑛𝑒𝑓𝑓𝑘0√(𝑥 − 𝑥𝑖)2+ (𝑦 − 𝑦𝑗)2]/[(𝑥 − 𝑥𝑖)2+ (𝑦 − 𝑦𝑗)2] 1/4
, (1)
where (𝑥𝑖, 𝑦𝑗) are the coordinates of the origin of the radial wave in the (x,y) plane of the sample,
k0 is the free space wavevector and neff = 1.012+0.003i is the measured plasmon effective index
(see below). To design the structures, we calculate the hologram resulting from the interference
between a reference radial distribution centered at the origin and an exit wave carrying a mth
order phase singularity exp(imθ):
𝐻(𝑥, 𝑦, 𝜃) = |exp [𝑖𝑅𝑒 (𝑛𝑒𝑓𝑓2𝜋
𝜆𝑐√𝑥
2+ 𝑦2)] +exp[𝑖𝑚𝜃]|2, (2)
and convert this smoothly oscillating function of x and y and the polar angle θ into a binary
structure Hbin of finite size compatible with e-beam lithography. In this equation, λc is the
wavelength of the collimated vortex (i.e. the one whose angular distribution reduces to a point
in the back focal plane images). Finally, we predict the structure of the beam by calculating the
far-field diffraction pattern of the leaked radiation in the Fraunhofer approximation:
𝐼𝑃𝐿(𝑘𝑥, 𝑘𝑦) = |ℱ{𝐻𝑏𝑖𝑛(𝑥, 𝑦)𝐴(𝑥 − 𝑥𝑖, 𝑦 − 𝑦𝑗)}|2. (3)
In this expression, ℱ denotes a Fourier transform, while kx and ky are the projections of the
emitted wavevector along the plane of the sample. The total footprint of Hbin is a circular area
with a diameter of 100 µm.
For all figures except Figs. 2(d), 2(h), 2(l), 2(p) and S1, we assumed that the surface plasmons
originated from a single point source placed in the center of the hologram. In other words, the
calculations were performed by taking xi = yj = 0 in Eq. (3). For Figs. 2(d), 2(h), 2(l), 2(p) and
13
around the center of the hologram. To this end, we have evaluated Eq. (3) at multiple locations
over a 16 µm2 area at the center of the structure. Then, we have weighted each result with a
Gaussian approximation of the Airy pattern G(xi,yj) = exp[-2(xi2+yi2)/2σ2] formed by the laser
spot, so as to capture the variations of the pumping power across the section of the laser beam.
We chose σ = 3 µm, the red HeNe laser being slightly defocused due to the chromatic
aberrations of the microscope objective used to collect the infrared photoluminescence. Finally,
the images of Figs. 2(d), 2(h), 2(l), 2(p) and S1 are obtained by calculating the sum of all
patterns:
𝐼𝑃𝐿(𝑘𝑥, 𝑘𝑦) = ∑𝑥𝑖,𝑦𝑗𝐺(𝑥𝑖, 𝑦𝑗)|ℱ{𝐻𝑏𝑖𝑛(𝑥, 𝑦)𝐴(𝑥 − 𝑥𝑖, 𝑦 − 𝑦𝑗)}|2. (4)
We have summed the intensities and not the fields because the contribution of each CQD is
independent from the other.
Determination of the plasmon effective index. To determine the real part of neff, we have
compared the experimental data with the results of our model and adjusted Re(neff) until the
calculations match the measurements. The most effective way to proceed is to fit the dispersion
relations [such as the one displayed on Fig. 4(a)] and then verify that the value thus obtained
can be used to model all the other data. We found that Re(neff) = 1.012 is a good fit for all
wavelengths even if real plasmons are in fact slightly dispersive over the spectral range of
interest. This value is close but slightly above the analytical index of surface plasmons at an
ideal air/Au interface because of the presence of the thin layer of CQDs. To determine Im(neff),
we have used the experimental linewidths Δθ of the optical vortices and written that the plasmon
propagation length is LSP = 1/[2Im(neff)k0] = λ/Δθ. This calculation yields Im(neff) = 3×10⁻³,
which is slightly larger than for ideal surface plasmons propagating at an ideally flat Air/Au
14
Mask generation. The electronic beam lithography (EBL) masks are generated using the
Octave-compatible Raith_GDSII Toolbox. First, the analytical expressions of the spiral arms
are deduced from Eq. (2) by solving for the maxima of the interference pattern, yielding r = pλ/neff+mθ/k0neff, with 0 ≤ p ≤ m-1. Then an Octave script uses this equation to create a binary
mask of the spiral. In Figs. 1, 3 and 4, the duty cycle is equal to 50% except at the center of
spirals where the different arms are thinned down to avoid overexposure. The interferometric
structures of Fig. 2 have been obtained by merging two spiral masks with different topological
charges directly on the Raith Pioneer software that pilots our EBL system. The duty cycle of
these interferometric samples has been reduced to 30%.
Sample fabrication. First, a 200 nm thick Au layer is coated onto a Si substrate using a Plassys
MEB 550S electron beam evaporator. The binary holograms are then defined with a sequence
of EBL (with a layer of CSAR 62 positive resist from Allresist spin-coated at 3300 rpm onto
the sample and the 20kV beam of a PIONEER Two Raith system), Au deposition (25 nm) and
overnight lift-off in 2-butanone. Finally, the solution of CQDs is spin-coated onto the sample
so as to form a continuous conformal layer above the different holograms. The CQD thickness
is 2-3 monolayers according to scanning electron micrographs of cleaved samples. For the
sample on glass presented in Figs 4(b)-(c), the fabrication workflow is the same except that the
lithography step is directly performed on a borosilicate glass wafer (Plan Optik AG). In this
case, a conductive layer (Electra 92, from Allresist) is spun on top of the CSAR 62 resist to
evacuate the charges during electron-beam writing.
Measurements. Most of the experimental details appear in the text. The setup, shown in
Fig. S3 [26], is built around a customized Olympus BX51WI upright microscope equipped with
various ports to pump the CQDs and to analyze the resulting photoluminescence. The infrared
photoluminescence is separated from the visible pump with a Thorlabs DMLP950R dichroic
15
Instruments mounted on an Acton SP-2356 imaging spectrograph from the same manufacturer.
For most experiments, the spectrograph is used in imaging mode, with a planar mirror mounted
in its turret and an RG780 longpass filter from Melles Griot placed at its entrance to filter the
remaining light from the HeNe pump. The back focal plane experiments were realized with a
30 mm Bertrand lens and a 20 mm Telan lens to create an intermediate image in front of the
spectrograph. The bandpass filters used to investigate the beams at selected wavelengths are
from the Thorlabs “FB” line and have a full width at half maximum of 10 nm. For the dispersion
relation of Fig. 4(a), the mirror is replaced by a 85 groove/mm grating to disperse the image of
the back focal plane along one direction and a 100 µm slit was inserted at the entrance of the
spectrograph to improve the resolution. To obtain the images of Fig. 3, a linear polarizer has
been placed in front of the InGaAs camera and the different panels correspond to different
orientations of the polarization axis with respect to the sample. All the other experiments of the
study have been performed without this linear polarizer. Our samples are fabricated and
measured under ambient air. During the first few days, the luminescence spectrum of the dots
blue-shifts due to photo-oxidation processes. Although this shift has no influence on the
structure of the vortices, all the data presented here have been recorded after stabilization of the
16
REFERENCES
[1] Q. Zhan, Cylindrical Vector Beams: From Mathematical Concepts to Applications, Adv. Opt. Photonics 1, 1 (2009).
[2] J. Guan et al., Quantum Dot-Plasmon Lasing with Controlled Polarization Patterns, ACS Nano 14, 3426 (2020).
[3] F. Cardano, E. Karimi, S. Slussarenko, L. Marrucci, C. de Lisio, and E. Santamato, Polarization Pattern of Vector Vortex Beams Generated by Q-Plates with Different Topological Charges, Appl. Opt. 51, C1 (2012).
[4] X. Yi, X. Ling, Z. Zhang, Y. Li, X. Zhou, Y. Liu, S. Chen, H. Luo, and S. Wen, Generation of Cylindrical Vector Vortex Beams by Two Cascaded Metasurfaces, Opt. Express 22, 17207 (2014).
[5] Y. Chen, K.-Y. Xia, W.-G. Shen, J. Gao, Z.-Q. Yan, Z.-Q. Jiao, J.-P. Dou, H. Tang, Y.-Q. Lu, and X.-M. Jin, Vector Vortex Beam Emitter Embedded in a Photonic Chip, Phys. Rev. Lett. 124, 153601 (2020).
[6] J. Liu, X. Chen, Y. He, L. Lu, H. Ye, G. Chai, S. Chen, and D. Fan, Generation of Arbitrary Cylindrical Vector Vortex Beams with Cross-Polarized Modulation, Results Phys. 19, 103455 (2020).
[7] S. W. Hell, Far-Field Optical Nanoscopy, Science 316, 1153 (2007).
[8] A. M. Yao and M. J. Padgett, Orbital Angular Momentum: Origins, Behavior and Applications, Adv. Opt. Photonics 3, 161 (2011).
[9] L. Marrucci, E. Karimi, S. Slussarenko, B. Piccirillo, E. Santamato, E. Nagali, and F. Sciarrino, Spin-to-Orbital Conversion of the Angular Momentum of Light and Its Classical and Quantum Applications, J. Opt. 13, 064001 (2011).
[10] A. V. Carpentier, H. Michinel, J. R. Salgueiro, and D. Olivieri, Making Optical Vortices with Computer-Generated Holograms, Am. J. Phys. 76, 916 (2008).
[11] P. Genevet and F. Capasso, Holographic Optical Metasurfaces: A Review of Current Progress, Rep. Prog. Phys. 78, 024401 (2015).
[12] R. E. Benner, R. Dornhaus, and R. K. Chang, Angular Emission Profiles of Dye Molecules Excited by Surface Plasmon Waves at a Metal Surface, Opt. Commun. 30, 145 (1979).
[13] W. Knoll, M. R. Philpott, J. D. Swalen, and A. Girlando, Emission of Light from Ag Metal Gratings Coated with Dye Monolayer Assemblies, J. Chem. Phys. 75, 4795 (1981).
[14] J. M. Lupton, B. J. Matterson, I. D. W. Samuel, M. J. Jory, and W. L. Barnes, Bragg Scattering from Periodically Microstructured Light Emitting Diodes, Appl. Phys. Lett.
77, 3340 (2000).
[15] J.-J. Greffet, R. Carminati, K. Joulain, J.-P. Mulet, S. Mainguy, and Y. Chen, Coherent Emission of Light by Thermal Sources, Nature 416, 61 (2002).
[16] Y.-J. Hung, I. I. Smolyaninov, C. C. Davis, and H.-C. Wu, Fluorescence Enhancement by Surface Gratings, Opt. Express 14, 10825 (2006).
[17] P. Bharadwaj, B. Deutsch, and L. Novotny, Optical Antennas, Adv. Opt. Photonics 1, 438 (2009).
[18] A. G. Curto, G. Volpe, T. H. Taminiau, M. P. Kreuzer, R. Quidant, and N. F. van Hulst, Unidirectional Emission of a Quantum Dot Coupled to a Nanoantenna, Science 329, 930 (2010).
[19] S. R. K. Rodriguez, G. Lozano, M. A. Verschuuren, R. Gomes, K. Lambert, B. De Geyter, A. Hassinen, D. Van Thourhout, Z. Hens, and J. Gómez Rivas, Quantum Rod Emission Coupled to Plasmonic Lattice Resonances: A Collective Directional Source of Polarized Light, Appl. Phys. Lett. 100, 111103 (2012).
17
[20] M. Toma, K. Toma, P. Adam, J. Homola, W. Knoll, and J. Dostálek, Surface Plasmon-Coupled Emission on Plasmonic Bragg Gratings, Opt. Express 20, 14042 (2012). [21] J. H. Park, S. E. Han, P. Nagpal, and D. J. Norris, Observation of Thermal Beaming
from Tungsten and Molybdenum Bull’s Eyes, ACS Photonics 3, 494 (2016).
[22] F. Prins, D. K. Kim, J. Cui, E. De Leo, L. L. Spiegel, K. M. McPeak, and D. J. Norris, Direct Patterning of Colloidal Quantum-Dot Thin Films for Enhanced and Spectrally Selective Out-Coupling of Emission, Nano Lett. 17, 1319 (2017).
[23] Y. Kan, S. K. H. Andersen, F. Ding, S. Kumar, C. Zhao, and S. I. Bozhevolnyi, Metasurface‐Enabled Generation of Circularly Polarized Single Photons, Adv. Mater.
32, 1907832 (2020).
[24] D. Zhang, L. Zhu, J. Chen, R. Wang, P. Wang, H. Ming, R. Badugu, M. Rosenfeld, Q. Zhan, C. Kuang, X. Liu, and J. R. Lakowicz, Conversion of Isotropic Fluorescence into a Long-Range Non-Diverging Beam, Methods Appl. Fluoresc. 6, 024003 (2018).
[25] A. B. Vasista, D. K. Sharma, and G. V. P. Kumar, Fourier Plane Optical Microscopy and Spectroscopy, in Digital Encyclopedia of Applied Physics, edited by Wiley-VCH Verlag GmbH & Co. KGaA (Wiley-VCH Verlag GmbH & Co. KGaA, Weinheim, Germany, 2019), pp. 1–14.
[26] See supplemental material
http://link.aps.org/supplemental/10.1103/PhysRevApplied.14.064077 for elucidating the small discrepancy between experiments and calculations at 1100 nm [Fig. (S1)], for an experimental signature of the local Kirchhoff law [Fig. (S2)] and for a schematic of the experimental setup [Fig. (S3)].
[27] O. Mollet, G. Bachelier, C. Genet, S. Huant, and A. Drezet, Plasmonic Interferometry: Probing Launching Dipoles in Scanning-Probe Plasmonics, J. Appl. Phys. 115, 093105 (2014).
[28] S. Cao, E. Le Moal, E. Boer-Duchemin, G. Dujardin, A. Drezet, and S. Huant,
Cylindrical Vector Beams of Light from an Electrically Excited Plasmonic Lens, Appl. Phys. Lett. 105, 111103 (2014).
[29] H. F. Ghaemi, T. Thio, D. E. Grupp, T. W. Ebbesen, and H. J. Lezec, Surface Plasmons Enhance Optical Transmission through Subwavelength Holes, Phys. Rev. B 58, 6779 (1998).
[30] W. L. Barnes, T. W. Preist, S. C. Kitson, and J. R. Sambles, Physical Origin of Photonic Energy Gaps in the Propagation of Surface Plasmons on Gratings, Phys. Rev. B 54, 6227 (1996).
[31] H. Wang, A. Aassime, X. Le Roux, N. J. Schilder, J.-J. Greffet, and A. Degiron, Revisiting the Role of Metallic Antennas to Control Light Emission by Lead Salt Nanocrystal Assemblies, Phys. Rev. Appl. 10, 034042 (2018).
[32] J.-J. Greffet, P. Bouchon, G. Brucoli, and F. Marquier, Light Emission by Nonequilibrium Bodies: Local Kirchhoff Law, Phys. Rev. X 8, 021008 (2018). [33] Q. Le-Van, X. Le Roux, A. Aassime, and A. Degiron, Electrically Driven Optical
Metamaterials, Nat. Commun. 7, 12017 (2016).
[34] H. Wang, Q. Le-Van, A. Aassime, X. L. Roux, F. Charra, N. Chauvin, and A. Degiron, Electroluminescence of Colloidal Quantum Dots in Electrical Contact with Metallic Nanoparticles, Adv. Opt. Mater. 6, 1700658 (2018).
[35] M. A. Hines and G. D. Scholes, Colloidal PbS Nanocrystals with Size-Tunable Near-Infrared Emission: Observation of Post-Synthesis Self-Narrowing of the Particle Size Distribution, Adv. Mater. 15, 1844 (2003).
18
FIGURES
FIG. 1. (a) Scanning electron microscope (SEM) micrograph of an m=3 sample (dimensions
given in the text). The light (resp. dark) grey areas are the top (resp. bottom) of the grooves.
The vector vortex beam is emitted perpendicularly to this image. Scale bar: 1 μm. Inset:
Schematic cross-section of the sample consisting of PbS CQDs (white dots) coated on a Au
nanostructured surface. (b) Photoluminescence spectrum of the PbS CQDs. (c) Images in false
colors of the back focal plane when the CQDs are pumped with a 633 nm HeNe laser focused
at the center of the 3-arm spiral. Each panel corresponds to an observation of the beam profile
at a different wavelength, as indicated above the images. The beam propagation is perpendicular
to the images. (d) Theoretical predictions of the beam profile at the same wavelengths. (e)
Theoretical predictions of the phase. The white circle of all these plots has a radius k/k0 = 0.65,
19
FIG. 2. (a) SEM micrograph of a structure generating two interfering vortices with opposite
topological charges m=3 and n=-3 (dimensions given in the text). Scale bar: 1 µm. (b)
Experimental image of the back focal plane. (c) Theoretical predictions assuming a point source
emitter. (d) Theory when the finite size of the photoluminescence spot is taken into account.
(e)-(h) Results for two interfering beams with m=4 and n=-4. The geometry consists of two
4-arm spirals with radial pitch 1.095 µm and opposite windings. (i)-(l) Results for two interfering
beams with m=5 and n=-5. The radial pitch of the structure (two 5-arm spirals with opposite
windings) is 1 µm. (m)-(p) Results for two interfering beams with m=5 and n=0. Here, the
geometry is obtained by superimposing a bull’s eye structure with a 5-arm spiral, both structures
having a radial pitch of 1.045 µm. The white circle of all these plots has a radius k/k0 = 0.65.
The wavelength is 1100 nm for all panels. The color map is the same as in Figs. 1(c)-(d), except
that the colors for the point source calculations have been saturated by a few percent for a better
20
FIG. 3. Images of the back focal plane at 1050 nm for the m=3 structure already studied in
Fig. 1 (the same color code has been used). Here, a linear polarizer is inserted in front of the
InGaAs camera. The orientation of the polarization axis is indicated with the double arrows on
each panel.
FIG. 4. (a) Experimental (negative kx) and theoretical (positive kx) dispersion relation for the
m=3 spiral discussed throughout the text. (b) Normalized back focal plane (BFP) profile of the
m=3 beam. The grey curve is the profile of the full polychromatic beam while the black curve
is a cross-section of Fig. 1(c) showing the result at the wavelength λ=1200 nm. The blue curve
is a cross-section of Fig. 4(c) revealing the profile of the beam at λ=1200 nm produced by a
m=3 spiral fabricated on glass (i.e. only the corrugations are made in Au). (c) Same experiment
as in the rightmost panel of Fig. 1(c) (λ=1200 nm) for a spiral fabricated on glass. The same