HAL Id: hal-00301613
https://hal.archives-ouvertes.fr/hal-00301613
Submitted on 12 Jul 2005HAL is a multi-disciplinary open access
archive for the deposit and dissemination of sci-entific research documents, whether they are pub-lished or not. The documents may come from teaching and research institutions in France or abroad, or from public or private research centers.
L’archive ouverte pluridisciplinaire HAL, est destinée au dépôt et à la diffusion de documents scientifiques de niveau recherche, publiés ou non, émanant des établissements d’enseignement et de recherche français ou étrangers, des laboratoires publics ou privés.
UV radiation below an Arctic vortex with severe ozone
depletion
B. M. Knudsen, H. Jønch-Sørensen, P. Eriksen, B. J. Johnsen, G. E. Bodeker
To cite this version:
B. M. Knudsen, H. Jønch-Sørensen, P. Eriksen, B. J. Johnsen, G. E. Bodeker. UV radiation below an Arctic vortex with severe ozone depletion. Atmospheric Chemistry and Physics Discussions, European Geosciences Union, 2005, 5 (4), pp.4679-4700. �hal-00301613�
ACPD
5, 4679–4700, 2005 UV radiation below depleted Arctic vortices B. M. Knudsen et al. Title Page Abstract Introduction Conclusions References Tables Figures J I J I Back CloseFull Screen / Esc
Print Version Interactive Discussion
EGU
Atmos. Chem. Phys. Discuss., 5, 4679–4700, 2005 www.atmos-chem-phys.org/acpd/5/4679/
SRef-ID: 1680-7375/acpd/2005-5-4679 European Geosciences Union
Atmospheric Chemistry and Physics Discussions
UV radiation below an Arctic vortex with
severe ozone depletion
B. M. Knudsen1, H. Jønch-Sørensen1, P. Eriksen1, B. J. Johnsen2, and G. E. Bodeker3
1
Danish Meteorological Institute, Copenhagen, Denmark
2
Norwegian Radiation Protection Authority, Oslo, Norway
3
National Institute of Water and Atmospheric Research, Lauder, New Zealand Received: 11 April 2005 – Accepted: 12 May 2005 – Published: 12 July 2005 Correspondence to: B. M. Knudsen ([email protected])
ACPD
5, 4679–4700, 2005 UV radiation below depleted Arctic vortices B. M. Knudsen et al. Title Page Abstract Introduction Conclusions References Tables Figures J I J I Back CloseFull Screen / Esc
Print Version Interactive Discussion
EGU
Abstract
The erythemally weighted (UV) irradiance below the severely depleted Arctic vortices in spring 1996 and 1997 were substantially elevated. On average the UV increased 36 and 33% relative to the 1979–1981 mean assuming clear skies from day 80–100 in 1996 and 1997, respectively. On clear sky days large regions of the Arctic
expe-5
rienced maximum UV increases exceeding 70 and 60% on single days in 1996 and 1997, respectively. UV levels in the Arctic spring are comparable to summer levels on biologically relevant vertical surfaces at snow-covered sites. A minor fraction of these increases are not anthropogenic, but have a dynamical origin.
1. Introduction
10
Concentrations of ozone depleting substances are decreasing slowly, so we can ex-pect several years with current levels of ozone depletion (WMO, 2003; Knudsen et al., 2004). But exactly how bad is the current situation? The worst effect of ozone de-pletion is arguably to be below a severely depleted vortex during springtime, where substantially elevated levels of UV radiation are expected. This can happen in
Antarc-15
tica and southern parts of South America (Pazmi ˜no et al., 2004) and in the Northern Hemisphere (NH) north of about 50◦N. The NH is the focus of this paper. Taalas et al. (2000) calculated the UV increase expected in the future from general circulation model predictions, and found April mean UV increases in the period 2010–2020 ex-ceeding 90% of the 1979–1992 for the worst case scenario. We document here what
20
levels of UV we have already experienced and are likely to experience in the foresee-able future.
The importance of UV radiation levels in spring in the Arctic can be seen from Jokela et al. (1993), who found that on a vertical surface noon-time UV irradiances were higher at the end of April than at any other time of the year in northern Finland. The amount
25
ACPD
5, 4679–4700, 2005 UV radiation below depleted Arctic vortices B. M. Knudsen et al. Title Page Abstract Introduction Conclusions References Tables Figures J I J I Back CloseFull Screen / Esc
Print Version Interactive Discussion
EGU
the eye (ACIA, 2004) and for the skin of people standing up or sitting down.
2. UV calculation
The clear sky UV-fields are calculated using the widely employed radiative trans-fer model UVSPEC (Kylling, 1995) which is based on the discrete ordinate method DISORT (Stamnes, 1989) and has been thoroughly tested for stability. The
calcula-5
tions are performed with total ozone as the only temporally varying input parameter whereas climatological parameters are used for all other atmospheric input data as well as surface albedo.
We used the 360 nm albedo based on TOMS reflectivity data from 1979–1992 calcu-lated with a moving time-window technique (MTW) (Tanskanen, 2004). The UV albedo
10
is usually below 10%, but snow cover can increase the albedo up to 95%. During the March-April period studied here snow cover can vary a lot from year to year in certain regions, such as Scandinavia and adjacent parts of Russia. We therefore also tried to use the normal albedo calculated by the European Centre for Medium-Range Weather Forecasts (ECMWF), but only small differences were found in the vortex means
pre-15
sented below.
The total ozone data used are the National Institute of Water and Atmospheric Re-search (NIWA) assimilated total ozone data set, which uses Nimbus 7 and Earth Probe TOMS version 8 uncorrected and Meteor and Adeos TOMS and GOME normalized to the Dobson network (Bodeker et al., 2001, 20051). Compared to ground based Brewer
20
measurements in Kangerlussuaq (67◦N, 309◦E) TOMS version 8 is slightly too low in April (∼7 DU).
The UVSPEC programme has been used to make a lookup table with increments of 20 DU, 5◦, and 50% in total ozone, solar zenith angle, and albedo, respectively.
1
Bodeker, G. E., Shiona, H., and Eskes, H.: Indicators of Antarctic ozone depletion, submit-ted to Atmos. Chem. Phys. Discuss., 2005.
ACPD
5, 4679–4700, 2005 UV radiation below depleted Arctic vortices B. M. Knudsen et al. Title Page Abstract Introduction Conclusions References Tables Figures J I J I Back CloseFull Screen / Esc
Print Version Interactive Discussion
EGU
Linear interpolation in this table was found to be sufficiently accurate. The effect of aerosols are corrected for using the aerosol optical depth (AOD) at 300 nm found in the climatology from the Global Aerosol Data Set (GADS) (K ¨opke et al., 1997). We used the GADS summer data set, which a spatial resolution of 5◦×5◦ covering the globe. This is a coarse resolution in both space and time, however no other data are available
5
with a global coverage. A simple correction for the effect of aerosols is applied to the UV irradiances by multiplication with exp(–0.5 * AOD).
We have used the UV-index as a unit of measure of UV levels relevant to the effects on human skin. It is defined as the effective irradiance obtained by integrating the spectral irradiance weighted by the CIE (1987) reference action spectrum up to 400 nm
10
normalised to 1 at 297 nm. It is the equivalent of multiplying the time weighted average effective irradiance in Wm−2 by 40.
We have cut off the calculations at 75◦ solar zenith angle (SZA), to avoid biolog-ically harmless levels of UV. For a total ozone amount of 300 DU and an albedo of 95% we get a UV-index of 0.78 at 75◦SZA, which gives one minimum erythemal dose
15
(1 MED=200 Jm−2) during about 3 h.
3. Comparison to UV observations
In Fig. 1 the model results have been compared with measurements from the multi-channel moderate bandwidth filter radiometer GUV-541 in Tromsø (69.7◦N, 19.0◦E) that is part of the Norwegian UV monitoring network (Johnsen et al., 2002). The
20
calibrations are maintained with a travelling reference filter radiometer, calibrated by the Norwegian Radiation Protection Authority. The irradiance scale is traceable to the NOGIC2000 Nordic Intercomparison of UV and total ozone instruments that was ar-ranged in Halmstad in June 2002. The comparison in Fig. 1 is done for local noon and only smooth bell-shaped daily profiles are used to avoid cloud affected days. On
cer-25
tain days (marked by open symbols) the profiles were not totally smooth. The albedo used in the model was 36–44% for both the MTW albedo climatology and the ECMWF
ACPD
5, 4679–4700, 2005 UV radiation below depleted Arctic vortices B. M. Knudsen et al. Title Page Abstract Introduction Conclusions References Tables Figures J I J I Back CloseFull Screen / Esc
Print Version Interactive Discussion
EGU
albedo. The model results compare well with the observations. They are 6% higher on average, but this could be due both to modelling errors and observational biases. Small errors in the absolute UV levels are not too important in this study, where the emphasis is on relative UV increases. All clear-sky observations except one are made when the ECMWF cloud cover is small indicating the usefulness of this parameter.
5
4. Results
In spring 1996 and 1997 the vortex ozone depletion was substantial (e.g. Rex et al., 2004; Knudsen et al., 1998; Goutail et al., 2004; Harris et al., 2002; Tilmes et al., 2004) with the depletion maximising at around 100 DU. In both years the vortex lasted well into April. The same is true for spring 1995, but no TOMS or GOME ozone data are
10
available for this period. In spring 2000 and 2005 large ozone depletions also occurred, but a vortex break-up in mid-March prevented high UV levels beneath the vortex.
As an example of the effect of the depletion on the ozone column Figs. 2a and b show the column ozone for two selected days in April 1996 and 1997. The approximate position of the polar vortex is indicated by black contours of 36 PVU (10−6Km2s−1kg−1)
15
of the 475 K PV (potential vorticity). It is evident that very low ozone values occur inside the vortex. The ECMWF analysed total cloud cover is indicated by the grey dots. The grey dots occupy 70% of each pixel in both meridional and zonal direction, i.e. 49% of the area of the pixel for totally overcast conditions, whereas for smaller cloud fractions the dots are reduced proportionally. No dots are drawn for a cloud cover below 2 octas
20
(25%).
High UV episodes in the Arctic in spring are dominated by the vortex low ozone episodes rather than the dynamically induced ozone mini-holes (ACIA, 2004). On one hand an ozone mini-hole is connected to a high-pressure system and usually cloud-free conditions, whereas it usually is more overcast beneath a vortex. On the other hand a
25
depleted vortex is much larger than and occurs much more frequently in the Arctic than ozone mini-holes. Please note that the ozone mini-hole climatology by James (1998)
ACPD
5, 4679–4700, 2005 UV radiation below depleted Arctic vortices B. M. Knudsen et al. Title Page Abstract Introduction Conclusions References Tables Figures J I J I Back CloseFull Screen / Esc
Print Version Interactive Discussion
EGU
includes episodes of low ozone inside the vortex. Ozone mini-holes are of course also affected by the general ozone depletion and have particularly low ozone columns in recent years.
Ozone mini-holes are caused primarily by transport of low ozone from lower latitudes (Koch et al., 2004). Such low-latitude air will retain its low PV for a long time and should
5
be detectable in ECMWF analysis for several days. In Fig. 2 the 6 PVU contour of the 350 K isentropic PV is therefore plotted as well, and it does seem to track the ozone mini-holes reasonably well.
To quantify dynamical influences on the vortex ozone columns we have looked at the 1981–1982 winter when the vortex lasted into April. Polar stratospheric clouds and
10
chlorine were very sparse so only little chemical ozone depletion is expected. The March averaged column ozone at Thule (76.5◦N, 68.8◦W) for days when the station was inside the vortex, was at its lowest during the period 1979–1988 in 1982 (An-dersen, 1999), indicating that 1982 will give us the approximate maximum dynamical influence on the vortex UV levels. Figure 2c shows the low ozone columns inside the
15
vortex on March 29, 1982.
Figure 3 shows the UV-index (the unit is 0.025 Wm−2) on 1 April 1996. Please note that altitude has not been taken into account in the UV calculations. In the remainder of the paper we focus on relative increases of UV, which more or less are independent of the altitude.
20
UV is calculated for each day in March-April 1979–1981 as a reference. This field is smoothed by averaging over 11 days for all 3 years. Figure 4 shows the UV increase relative to the 1979–1981 period for the three days shown in Fig. 2. This figure shows substantial increases in UV under the depleted vortices in 1996 and 1997. In 1982 there is a small increase in UV relative to the climatology.
25
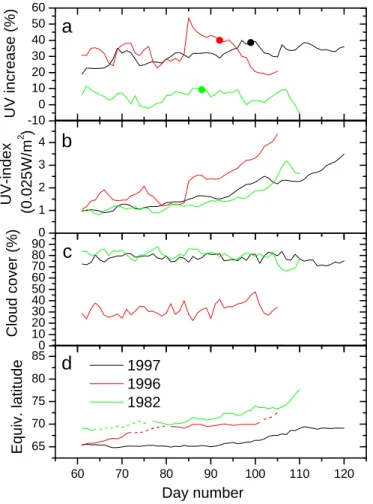
Figure 5 shows the vortex averaged UV increase, UV-index, cloud cover, and equiv-alent latitude of the edge of the vortex for each day in the 3 years studied. The curves stop when the vortex breaks up. Panel (d) shows that the vortex in 1982 and 1996 diminished its size substantially prior to actual break-up. It is necessary to be cautious
ACPD
5, 4679–4700, 2005 UV radiation below depleted Arctic vortices B. M. Knudsen et al. Title Page Abstract Introduction Conclusions References Tables Figures J I J I Back CloseFull Screen / Esc
Print Version Interactive Discussion
EGU
about results obtained during this period because the vortex can be flushed with out-side air and split up. Periods of vortex splitting are indicated by dashed lines in this panel. In panel a circles mark the days used in Figs. 2–4. The days with maximum UV increase in 1996 occur during ozone mini-hole episodes affecting the vortex. The average increase from day 80–100 was 6.7, 35.9, and 33.0% in 1982, 1996, and 1997,
5
respectively. The UV-indices in panel (b) are influenced by how far off the pole the vortex is displaced. Particularly during vortex split-up parts of the vortex can move quite far south. In 1996 the vortex moved far south and thus affected midlatitude sites (Seckmeyer et al., 1997). A surprisingly constant cloud cover in each year is revealed in Fig. 5, panel (c), although the interannual variability is large.
10
Figure 6 shows the maximum UV increase experienced underneath the vortex on a single day from 15 March to break-up. Only days when the cloud cover was below 2 octas are used. Both in spring 1996 and 1997 large parts of the Arctic experienced substantially elevated levels of UV radiation. For the maximum increase of 97% found in 1996, the time to get sunburnt almost halved, showing the importance of making
15
UV-forecasts.
Figure 7 shows the maximum UV increases found outside the vortex. These are on average much smaller than those inside the vortex. Most of the large UV increases are in fact connected to the vortex since they occur for 475 K PV values between 30– 36 PVU. This region should to some degree be isolated from the surf zone (zone of
20
approximately constant PV between the vortex and the tropics) due to substantial gra-dients in PV. Inspection of 475 K PV and temperature maps reveals that in the winter 1995/96 temperatures low enough for polar stratospheric clouds to exist were unusu-ally often found outside the polar vortex. Chemical ozone depletion could thus help explain the low ozone values found in this region, but the fact that the actual edge of
25
ACPD
5, 4679–4700, 2005 UV radiation below depleted Arctic vortices B. M. Knudsen et al. Title Page Abstract Introduction Conclusions References Tables Figures J I J I Back CloseFull Screen / Esc
Print Version Interactive Discussion
EGU
5. Conclusions
Our calculations show that high UV levels do occur below severely depleted Arctic vortices and this situation is likely to continue for many years to come. The vortex ozone depletions will eventually spread out to midlatitudes during spring and lead to increased UV there (Knudsen and Andersen, 2001).
5
Acknowledgements. A. Kylling and B. Meyer are gratefully acknowledged for making the UVSPEC radiative transfer programme freely available. Thanks to A. Tanskanen for providing the UV albedos. The Norwegian State Pollution Control Authority and the Norwegian Institute for Air Research are thanked for the Tromsø UV measurements. We are also indebted to both the TOMS and GOME teams for column ozone and other data. ECMWF is acknowledged for
10
the provision of their meteorological analyses.
References
ACIA: Impacts of a Warming Arctic: Arctic Climate Impact Assessment, Chapter 3, Cambridge University Press, 2004.
Bodeker, G. E., Scott, J. C., Kreher, K., and McKenzie, R. L.: Global ozone trends in potential
15
vorticity coordinates using TOMS and GOME intercompared against the Dobson Network: 1978–1998, J. Geophys. Res., 106, 23 029–23 042, 2001.
Andersen, S. B.: Spring ozone column values over Thule, Greenland in the period 1991–1998, Geophys. Res. Lett., 26, 193–196, 1999.
Goutail, F. , Pommereau, J. , Lef `evre, F. , Van Roozendael, M. , Andersen, S. , K ˚astad Høiskar,
20
B. , Dorokhov, V. , Kyr ¨o, E. , Chipperfield, M., and Feng, W.: Early unusual ozone loss during the Arctic winter 2002/2003 compared to other winters, Atmos. Chem. Phys., 6, 665–677, 2005.
Harris, N. R. P., Rex, M., Goutail, F., Knudsen, B. M., Manney, G. L., M ¨uller, R., and von der Gathen, P.: Comparison of Empirically Derived Ozone Losses in the Arctic Vortex, J.
25
Geophys. Res., 107, (D20), doi:10.1029/2001JD00482, 2002.
James, P. M.: An interhemispheric comparison of ozone mini-hole climatologies, Geophys. Res. Lett., 25, 301–304, 1998.
ACPD
5, 4679–4700, 2005 UV radiation below depleted Arctic vortices B. M. Knudsen et al. Title Page Abstract Introduction Conclusions References Tables Figures J I J I Back CloseFull Screen / Esc
Print Version Interactive Discussion
EGU
Johnsen B. J., Mikkelborg, O., Hannevik, M., Nilsen, L. T., Saxebøl, G., and Blaasaas, K. G.: The Norwegian UV monitoring program. Period 1995/96 to 2001, Str ˚alevernRapport 2002:4, Øster ˚as: Norwegian Radiation Protection Authority, 2002.
Jokela, K., Leszinsky, K., and Visuri, R.: Effects of Arctic ozone depletion and snow on UV exposure in Finland, Photochem. Photobiol., 58, 559–566, 1993.
5
Knudsen, B.M., and Andersen, S. B.: Longitudinal variation in springtime ozone trends, Nature, 413, 699–700, 2001.
Knudsen, B. M., Larsen, N., Mikkelsen, I. S., et al.: Ozone depletion in and below the arctic vortex for 1997, Geophys. Res. Lett., 25, 627–630, 1998.
Knudsen, B. M., Harris, N. R. P., Andersen, S. B., Christiansen, B., Larsen, N., Rex, M., and
10
Naujokat, B.: Extrapolating future Arctic ozone losses, Atmos. Chem. Phys. 4, 1849–1856, 2004.
Koch, G., Wernli, H., Schwierz, C., Staehelin, J., and Peter, T.: Ozone miniholes and minihighs over Switzerland, Proc. XX Quadr. Oz. Symp., Kos, Greece, 1–8 June, 2004.
Kylling, A., Stamnes, K., and Tsay, S.-C.: A reliable and efficient two-steam algorithm for
spher-15
ical radiative transfer: Documentation of accuracy in realistic layered media, J. Atm. Chem., 21, 115–150, 1995.
K ¨opke, P., Hess, M., Schult, I., and Shettle, E. P.: Global Aerosol Data Set. Report no. 243, Max-Planck-Institut fur Meteorologie, Hamburg, September 1997.
Pazmi ˜no, A., Godin-Beckman, S., Bekki, S., Ginzburg, M., and Quel, E.: Evolution of
20
stratospheric ozone over Argentinean stations during 1997–2003 and correlations with UV-radiation, Proc. XX Quadr. Oz. Symp., Kos, Greece, 1–8 June, 2004.
Rex, M., Salawitch, R. J., von der Gathen, P., Harris, N. R. P., Chipperfield, M. P., and Naujokat, B.: Arctic ozone loss and climate change, Geophys. Res. Lett., 31, L04116, doi:10.1029/2003GL018844, 2004.
25
Seckmeyer, G., Mayer, B., Bernhard, G., Erb, R., Albold, R., J ¨ager, H., and Stockwell, W. R.: New maximum UV irradiance levels observed in central Europe, Atm. Env., 31, 2971–2976, 1997.
Stamnes, K., Tsay, S., Wiscombe, W., and Jayaweera, K.: Numerically stable algorithm for discrete-ordinate-method radiative transfer in multiple scattering and emitting layered media,
30
App. Optics, 27, 2502–2509, 1988.
Taalas, P., Kaurola, J., Kylling, A., et al.: The impact of greenhouse gases and halogenated species on future solar UV radiation doses, Geophys. Res. Lett., 27, 1127–1130, 2000.
ACPD
5, 4679–4700, 2005 UV radiation below depleted Arctic vortices B. M. Knudsen et al. Title Page Abstract Introduction Conclusions References Tables Figures J I J I Back CloseFull Screen / Esc
Print Version Interactive Discussion
EGU
Tanskanen, A.: Lambertian Surface Albedo Climatology at 360 nm from TOMS Data Using Moving Time-Window Technique, Proc. XX Quadr. Oz. Symp., 1–8 June, Kos, Greece, 2004.
Tilmes, S. , M ¨uller, R. , Grooß, J., and Russel III, J. M.: Ozone loss and chlorine activation in the Arctic winters 1991–2003 derived with the tracer-tracer correlations, Atmos. Chem. Phys., 4,
5
2181–2213, 2004,
SRef-ID: 1680-7324/acp/2004-4-2181.
WMO: Scientific Assessment of ozone depletion: 2002, World Meteorological Organisation Global Ozone Research and Monitoring Project Report No. 47, 498, Geneva, 2003.
ACPD
5, 4679–4700, 2005 UV radiation below depleted Arctic vortices B. M. Knudsen et al. Title Page Abstract Introduction Conclusions References Tables Figures J I J I Back CloseFull Screen / Esc
Print Version Interactive Discussion EGU 60 70 80 90 100 110 120 0 1 2 3 inside vortex Tromsø UV-index (0.025 W /m 2 ) 1996 day number Calculated Observed 79-81 average 0 20 40 60 80 100 Cloud cover Cloud cover (%)
Fig. 1. Comparison of the calculated UV-index (solid, black line) to radiometer measurements
at Tromsø (filled squared for clear-sky measurements, open squares for measurements weakly
affected by clouds). The 1979–1981 mean UV-index is also shown (dashed). The period when
Tromsø was inside the vortex are marked at the bottom of the plot. The dotted, red line is the ECMWF cloud cover.
ACPD
5, 4679–4700, 2005 UV radiation below depleted Arctic vortices B. M. Knudsen et al. Title Page Abstract Introduction Conclusions References Tables Figures J I J I Back CloseFull Screen / Esc
Print Version Interactive Discussion
EGU
Fig. 2. (a) NIWA assimilated total ozone north of 40◦N on 9 April 1997. The thick black contour is 36 PVU of the 475 K PV, whereas the white contour is 6 PVU of the 350 K PV. Grey dots mark cloud cover (see text).
ACPD
5, 4679–4700, 2005 UV radiation below depleted Arctic vortices B. M. Knudsen et al. Title Page Abstract Introduction Conclusions References Tables Figures J I J I Back CloseFull Screen / Esc
Print Version Interactive Discussion
EGU
ACPD
5, 4679–4700, 2005 UV radiation below depleted Arctic vortices B. M. Knudsen et al. Title Page Abstract Introduction Conclusions References Tables Figures J I J I Back CloseFull Screen / Esc
Print Version Interactive Discussion
EGU
ACPD
5, 4679–4700, 2005 UV radiation below depleted Arctic vortices B. M. Knudsen et al. Title Page Abstract Introduction Conclusions References Tables Figures J I J I Back CloseFull Screen / Esc
Print Version Interactive Discussion
EGU
ACPD
5, 4679–4700, 2005 UV radiation below depleted Arctic vortices B. M. Knudsen et al. Title Page Abstract Introduction Conclusions References Tables Figures J I J I Back CloseFull Screen / Esc
Print Version Interactive Discussion
EGU
Fig. 4. (a) UV increase relative to 1979–1981 (%) for 9 April 1997. Black contour marks the
ACPD
5, 4679–4700, 2005 UV radiation below depleted Arctic vortices B. M. Knudsen et al. Title Page Abstract Introduction Conclusions References Tables Figures J I J I Back CloseFull Screen / Esc
Print Version Interactive Discussion
EGU
ACPD
5, 4679–4700, 2005 UV radiation below depleted Arctic vortices B. M. Knudsen et al. Title Page Abstract Introduction Conclusions References Tables Figures J I J I Back CloseFull Screen / Esc
Print Version Interactive Discussion
EGU
Fig. 4. (c) As Fig. 4a, but for 29 March 1982.
ACPD
5, 4679–4700, 2005 UV radiation below depleted Arctic vortices B. M. Knudsen et al. Title Page Abstract Introduction Conclusions References Tables Figures J I J I Back CloseFull Screen / Esc
Print Version Interactive Discussion EGU -10 0 10 20 30 40 50 60 0 1 2 3 4 0 10 20 30 40 50 60 70 80 90 60 70 80 90 100 110 120 65 70 75 80 85
a
UV increase (%)b
UV-index (0.025 W/m 2 )c
Cloud cover (%)d
Equiv. latitude Day number 1997 1996 1982Fig. 5. Vortex averaged UV increase (a), UV-index (b), cloud cover (c), and equivalent latitude
of the edge of the vortex(d). Periods of vortex splitting is indicated by dashed lines in panel (d).
ACPD
5, 4679–4700, 2005 UV radiation below depleted Arctic vortices B. M. Knudsen et al. Title Page Abstract Introduction Conclusions References Tables Figures J I J I Back CloseFull Screen / Esc
Print Version Interactive Discussion
EGU
Fig. 6. (b) Maximum UV increase inside the vortex since 1979–1981 (%) on clear sky days
ACPD
5, 4679–4700, 2005 UV radiation below depleted Arctic vortices B. M. Knudsen et al. Title Page Abstract Introduction Conclusions References Tables Figures J I J I Back CloseFull Screen / Esc
Print Version Interactive Discussion
EGU
ACPD
5, 4679–4700, 2005 UV radiation below depleted Arctic vortices B. M. Knudsen et al. Title Page Abstract Introduction Conclusions References Tables Figures J I J I Back CloseFull Screen / Esc
Print Version Interactive Discussion
EGU
Fig. 7. Maximum UV increase outside the vortex since 1979–1981 (%) on clear sky days from