HAL Id: hal-01971613
https://hal.umontpellier.fr/hal-01971613
Submitted on 7 Jan 2019
HAL is a multi-disciplinary open access
archive for the deposit and dissemination of
sci-entific research documents, whether they are
pub-lished or not. The documents may come from
teaching and research institutions in France or
abroad, or from public or private research centers.
L’archive ouverte pluridisciplinaire HAL, est
destinée au dépôt et à la diffusion de documents
scientifiques de niveau recherche, publiés ou non,
émanant des établissements d’enseignement et de
recherche français ou étrangers, des laboratoires
publics ou privés.
species in Benin and Burkina Faso
Abel Biguezoton, Safiou Adehan, Hassane Adakal, Sébastien Zoungrana,
Souaïbou Farougou, Christine Chevillon
To cite this version:
Abel Biguezoton, Safiou Adehan, Hassane Adakal, Sébastien Zoungrana, Souaïbou Farougou, et
al.. Community structure, seasonal variations and interactions between native and invasive cattle
tick species in Benin and Burkina Faso. Parasites and Vectors, BioMed Central, 2016, 9, pp.43.
�10.1186/s13071-016-1305-z�. �hal-01971613�
R E S E A R C H
Open Access
Community structure, seasonal variations
and interactions between native and
invasive cattle tick species in Benin and
Burkina Faso
Abel Biguezoton
1,2,3*, Safiou Adehan
1, Hassane Adakal
2,4, Sébastien Zoungrana
2, Souaïbou Farougou
1and Christine Chevillon
3,5Abstract
Background: The variation of tick abundance on ruminants had received little attention in West Africa before Rhipicephalus (Boophilus) microplus started to invade this region in the early 2000s. Ten years later, R. microplus was suspected to have replaced the native ticks. In addition to testing this hypothesis, this study investigated the interactions between native and invasive ticks and the relative role of climatic and geographical variables in the variations of tick community composition (beta diversity) on cattle herds.
Methods: A one-year-long survey was performed in Benin and Burkina Faso during which adult ticks were collected from 144 steers from 12 localities in four different areas once a month. Morphological features were used to assign the collected ticks to different species (A. variegatum, R. annulatus, R. decoloratus, R. microplus and R. geigyi). Beta diversity analyses and generalized linear models allowed characterizing the geographical variations in species assemblage and the effect of co-infestation patterns on the seasonal variations in the abundance and incidence rates of each taxon.
Results: About 68 % (22,491/32,148) of all the adult ticks collected in one year were R. microplus. The most heterogeneously distributed taxa were Hyalomma spp and R. microplus and the lowest specific diversity was found in Central Burkina Faso. Although climatic variables did not provide any additional information on the variation in species assemblages compared with the sampling geography, adult tick abundance tended to peak during the late (Boophilus subgenus) or early (other taxa) rainy season. In most taxon-per-locality analyses, the abundance and incidence rate of a given tick taxon significantly increased when the host was co-infested by other taxa. The comparison with previous estimates (when possible) did not support the hypothesis that R. microplus invasion led to a decrease in native tick species abundance.
Conclusions: The co-infestation patterns among native and invasive tick species are key factors for the determination of the community structure and the infestation dynamics of each tick taxon in West African cattle.
Keywords: Ixodidae, Biological invasion, Cattle health, Amblyomma variegatum, Rhipicephalus microplus, Community structure
* Correspondence:babels005@yahoo.fr
1Unité de Recherche en Biotechnologie de la Production et de la Santé
Animales (URBPSA), Laboratoire de Recherche en Biologie Appliquée, Ecole Polytechnique d’Abomey-Calavi, 01 BP 2009 Cotonou, Bénin
2
Unité de Recherche sur les bases biologiques de la Lutte Intégrée (URBIO), Centre International de Recherche-Développement sur l’Elevage en zone Subhumide (CIRDES), 559, 3-51 Avenue du Gouverneur Louveau, 01 B.P. 454 Bobo-Dioulasso 01, Burkina Faso
Full list of author information is available at the end of the article
© 2016 Biguezoton et al. Open Access This article is distributed under the terms of the Creative Commons Attribution 4.0 International License (http://creativecommons.org/licenses/by/4.0/), which permits unrestricted use, distribution, and reproduction in any medium, provided you give appropriate credit to the original author(s) and the source, provide a link to the Creative Commons license, and indicate if changes were made. The Creative Commons Public Domain Dedication waiver (http://creativecommons.org/publicdomain/zero/1.0/) applies to the data made available in this article, unless otherwise stated.
Background
In Benin and Burkina Faso, livestock production repre-sents the second contribution after crops to the gross domestic product, without leading to self-sufficiency in animal protein production [1, 2]. In both countries, semi-intensive farming systems and the use of exotic breeds remain exceptional and 95 % of the livestock in-dustry relies on extensive and low-input systems. In Benin, half of the livestock production is concentrated in the north-east where herd rotation among communal pastures, post-harvested crops, savannahs and wood-lands optimizes the use of the rare grazing resources [3, 4]. In Burkina Faso, extensive and low-input sys-tems include the transhumant system where part or whole cattle herds move to the south in the dry season and come back to the north in mid-May when the rainy season starts [5]. Traditional farming systems in Burkina Faso also include sedentary systems where cat-tle, sheep and goats forage together on communal pas-tures. In such low-input systems, herders cannot afford expensive tick control strategies [6]. As a result, ticks and tick-borne pathogens hamper the development of livestock production in these areas.
The variations in tick biodiversity and abundance on domestic ruminants have been poorly studied in West Africa, with the exception of few surveys performed in Benin or Burkina Faso [7–11]. These studies showed that Amblyomma variegatum, a three-host tick that in-fests cattle and small ruminants, was the native species responsible for the highest economic costs. This species impairs animal growth [12], decreases milk yield [13, 14] and is the vector of Ehrlichia ruminantium, a virulent pathogen for sheep and goats that was detected in 10 % of A. variegatum adults in several Beninese regions [11]. Three native species of the Boophilus subgenus (R. annulatus, R. decoloratus and R. geigyi) transmit Babesia
bigemina (the agent of African redwater) and
Ana-plasma marginale in this region[15, 16]. Seven other na-tive species, of little veterinary health concern, were also recorded in these studies: three Hyalomma species (H. impressum, H. marginatum rufipes and H. truncatum) and four other Rhipicephalus species (R. muhsamae, R. sanguineus, R. senegalensisand R. sulcatus) [7–9]. These surveys also highlighted geographical variations in the predominant species: A. variegatum and H. marginatum rufipes were the only species found on cattle in Central Burkina Faso [7], while A. variegatum and R. geigyi rep-resented between 70 and 99 % of the ticks infesting cat-tle in North Benin [8, 9].
To the best of our knowledge, it is not known whether and how co-infestation patterns influence the abundance of each native tick species. Moreover, the recent invasion of West Africa by the Asian cattle tick Rhipicephalus (Boophilus) microplus could have modified these tick
communities and consequently also the threats to the health of domestic ruminants. R. microplus is associated with the highest economic losses where it occurs be-cause of its direct deleterious effects on cattle health and its vector competence for Babesia bigemina, B. bovis and A. marginale [17]. R. microplus was introduced in Ivory Coast [18, 19] and Benin [20] in the early 2000s and within a decade it has spread to Togo, Mali, Burkina Faso and along the north-eastern border between Nigeria and Cameroon [21–25]. A nationwide survey performed in Benin found that R. microplus was the pre-dominant Boophilus species in the southern half of the country in late 2011 [25]. As a consequence, this inva-sive species was suspected to have outcompeted and re-placed its native competitors [19, 25], as it did in South Africa (see [26, 27]). This hypothesis remains neverthe-less to be tested. Indeed, as the data from the Beninese survey were expressed in percentages of invasive and na-tive species among the collected ticks, it was not pos-sible to determine whether R. microplus invasion has actually decreased the native competitor burden [25]. This was carried out to update the information on tick infestation in domestic ruminants in Benin and Burkina Faso, West Africa, as well as to compare the current abundances of native ticks with those observed before the arrival of R. microplus. In addition, the effect of geo-graphical changes on species abundance and tick species assemblages was investigated. To this end, the variations in the composition of tick communities (beta diversity), the contribution of each species and/or each site to the beta diversity and the relative contribution of geograph-ical and climatic variables (mean monthly rainfall and temperature) to the spatio-temporal variations in beta diversity were quantified.
Methods
Sampling areas
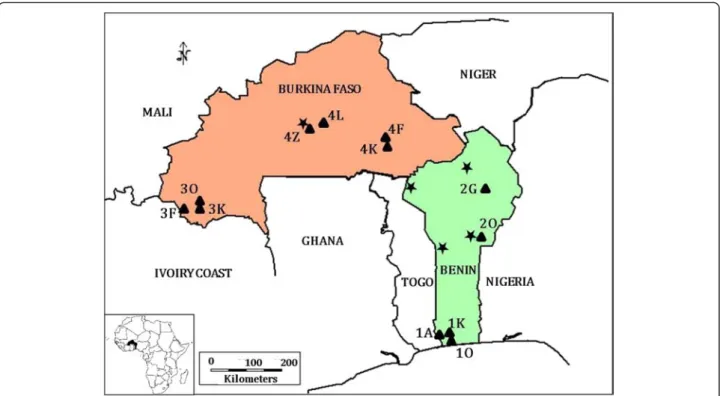
Four areas with different climate were considered (Fig. 1). South Benin has a Guinean climate characterized by a long rainy season from April to July, a short dry season in August, a short rainy season between September and November and a long dry season from December to March. North Benin included two sites where a rainy season (May to October) is followed by a dry season (November to April). Overall, the amount of annual rainfall is 1400 mm in South Benin and 1300 mm in North. In South-West Burkina Faso and Central Burkina Faso the rainy season lasts from June to September and the dry season from October to May. Overall, the amount of maximum rainfall is higher in North Benin (i.e., 1300 mm) than in Burkina Faso (1200 mm) and the most arid area is Central Burkina Faso. These four areas also represent different steps in R. microplus invasion of West Africa. The state farm Kpinnou in South Benin
(site 1 K, Fig. 1) was the place where the invasive tick was introduced in 2004 [20]. R. microplus reached North Benin by 2008 [19, 20] and South-West Burkina Faso in late 2011 [24]. R. microplus has never been observed in Central Burkina Faso before the beginning of this study. Two to four herds were monitored in each of these four areas. Hereafter, each sampling site is designated by a number that identifies the geographical area (South Benin: area #1; North Benin: area #2; South-West Bur-kina Faso: area #3; Central BurBur-kina Faso: area #4) followed by the initial of the site name (e.g., site 1 K cor-responds to Kpinnou in South Benin) (Fig. 1).
Tick sampling
Twelve sentinel steers were randomly chosen within each monitored herd. Sampling started in February 2012 in areas #1 and #2, in April 2012 in area #3 and in May 2012 in area #4. At each of the monthly tick collection events, each sentinel steer was kept with one flank on the ground for 15 min to allow the collection of all the ticks attached on the other half of the body. Ticks were stored in 70 % ethanol. Sampling date, host ID number and attachment site on the host (i.e., head, legs, flank,
perineum or tail) were recorded as well as information on the mean monthly rainfall and temperature obtained from ASECNA (Benin) and the “Direction Générale de la Météorologie” (Burkina Faso).
Tick identification
Although immature ticks were also collected, the ana-lysis focused only on the adult stage to minimize the risks of counting errors [28] and of misidentification within the Boophilus sub-genus [16]. Tick identification was performed in two steps: i) identification of
Amblyomma variegatum ticks and discrimination
be-tween the Hyalomma genus (hereafter referred to as Hyalomma spp), the Boophilus subgenus (Boophilus spp) and the other Rhipicephalus species (Rhipicephalus spp), using a stereoscopic microscope at x60 magnification; ii) discrimination of the four Boophilus species (i.e., the in-vasive R. microplus species and the three native species R. annulatus, R. decoloratus and R. geigyi) at x100 mag-nification for more precision, since Boophilus species are morphologically very similar. The differentiation criteria were classically based on the number of teeth rows on the hypostome, the form of the male ventral plates as
Fig. 1 Sampling geography. Sampling sites are represented by triangles and identified by the number of the area followed by the first letter of the locality name. Thus, in area #1 (South Benin), ticks were collected in Athiémé (1A; N 6.5864; E 1.6653), Kpinnou (1 K; N 6.5681; E 1.781) and Ouidah (1O; N 6.3336; E 2.0064). In North Benin (area #2), sampling sites were in Okpara (2O; N 9.305; E 2.7314) and Gogounou (2G; N 10.7383; E 2.9233). In South-West Burkina Faso (area #3), samples were collected in Farnifaso (3 F; N 10.07338; W 4.94975), Kimini (3 K; N 10.07162; W 4.808) and Ouangolodougou (3O; N 10.0858; W 4.77828). In Central Burkina Faso (area #4), sample collection took place in Fada N’gourma (4 F; N 12.05; E 0.35), Kikideni (4 K; N 11.9167; E 0.3833), Loumbila (4 L; N 12.5167; W 1.35) and Zagtouli (4Z; N 12.3167; W 1.6333). Stars indicate the localities where tick abundance on cattle was studied before the arrival of R. microplus (one locality from area #4 in 1996 [7]; two localities in the east of area #2 between 2003 and 2004 [9] and two localities in the west of area #2 between 2004 and 2005 [8])
well as the presence (absence) of setae on the internal protuberance of the first segment of palps, of external spur on coxa II and III and of a caudal appendage [16].
Analysis of the tick community structure and its spatio-temporal variations
The species x locality matrix was computed after Hellin-ger transformation of the abundance data [29] to esti-mate the beta diversity (BD), as described in [30]. Such estimate varies between 0 (no geographical variation in species assemblage) and 1 (each surveyed locality hosts a distinct species assemblage). BD was then partitioned into Local Contributions to Beta Diversity (LCBD) or Species Contributions to Beta Diversity (SCBD) [30]. Null LCBD estimates define the null hypothesis of a ran-dom distribution of species among localities (i.e., a state where the community occupying any given locality is formed independently from the species assemblages en-countered elsewhere) [30]. Significant LCBD deviations from zero were tested by performing 999 random per-mutations (nperm = 999) of the matrix columns [30]. The largest SCBD estimates are associated with the most heterogeneously distributed taxa, and sites where com-munities are dominated by species associated with large SCBD estimates tend to display significantly non-null LCBD [30]. The spatio-temporal variations in the com-munity structure and the relative contribution of cli-matic variables and sampling sites to LCBD variations were investigated as previously described [31]. The cor-relations between species richness and LCBD estimates were computed to accurately interpret non-null LCBD estimates. A negative correlation is expected when sig-nificantly non-null estimates indicate species-poor sam-pling events [31].
Tick abundance dynamics
The temporal variations in the abundance of each taxon were analyzed using generalized linear models with a negative binomial structure (i.e., using the glm.nb function from the MASS package in R; http://cran.r-project.org/ web/packages/MASS/index.html). In model comparisons, preference was given to models that minimized the Akaike information criterion (AIC), while maximizing the per-centage of explained variance. The first step of simplifica-tion focused on the seasonal variasimplifica-tions in abundance: the months associated with not significantly different (P > 0.05) estimates were merged into the same level of the ‘seasonal’ factor sx [32]. The second step tested whether
the tick co-infection pattern interacted with sx to
deter-mine the abundance dynamics of a given taxon X. H, A, R, Rm, Ra, Rd and Rg were defined as categorical variables with a value of 1 or 0 to describe the presence or absence of Hyalomma spp, Amblyomma variegatum, Rhipicepha-lus spp, R. micropRhipicepha-lus, R. annulatus, R. decoloratus and R.
geigyi, respectively. In R language, H*A*R*Rm*Ra*Rd*Rg included all additive and interactive effects among these explanatory variables. For simplicity, Πall-but-x defined
the term H*A*R*Rm*Ra*Rd*Rg from which the contri-bution of the taxon X was removed. In R language, the maximal model to explain the abundance variations of taxon X was sx * Πall-but-x. Model simplification was
achieved by removing the terms without significant ef-fect (P > 0.05) on the analyzed abundance.
Variations in the tick incidence rates
The mean values of the H, A, R, Rm, Ra, Rd and Rg vari-ables defined above correspond to the incidence rates per steer and per month of Hyalomma spp, Amblyomma variegatum, Rhipicephalus spp, R. microplus, R. annula-tus, R. decoloratus and R. geigyi, respectively [32]. Their variations among sites (factor SITE), seasons (factor sx)
and/or hosts with different co-infestation patterns (Π all-but-x) were analyzed using generalized linear models with
a binomial structure [33]. The maximal model was ~ SITE*sx+Πall-but-x. Model simplification was achieved by
removing the terms with no significant effect (P > 0.05). The possibility of over dispersion (and thus the necessity to perform a new analysis using a quasibinomial model structure) was checked a posteriori by computing the ra-tio of residual deviance onto the residual freedom degrees [31].
Analysis of tick attachment sites on the host body
Cattle tick species have evolved preferences concerning their attachment sites on the host body: Rhipicephalus sppprefers attaching on the head and legs, while A. var-iegatum, Hyalomma spp and Boophilus ticks favor at-tachments on trunk and perineum [8, 9, 16]. To investigate the relationships between co-infestation pat-terns and the distribution of a given tick taxon on the host body, R x C contingency tables were defined in which the C columns describe the distribution of a given tick species across the host body parts (C = 2, when con-sidering the ‘preferred’ vs’not preferred’ body part cat-egories; C = 5, when considering head, legs, flank, perineum and tail as different categories) and the R rows (R = 2) the presence/absence of a co-infesting tick spe-cies. Then, the independence between rows and columns was tested using the Fisher’s exact test. Finally, the possi-bility of a global tendency was tested by combining the obtained P-values for a given pair of tick species across sites. Given the low number of P-values to combine, the Stouffer’s combination method was preferred [32, 34], using the R process developed by Burns [35].
Ethics statement
Herders received full information on the study objectives and procedures before signing a written informed
consent. Sampling was systematically coupled with veter-inary inspection of the herd; in the case of infection, ani-mals received free treatment. All study procedures were reviewed and approved by the CSIRO Social Science Human Research Committee under approval number Ref 038/12.
Results
Predominance of the invasiveR. microplus species
Overall, 144 animals were monitored monthly for one year and 32,148 adult ticks were collected. They all could be identified (genus, subgenus or species), but for 120 specimens (0.37 %). Ticks belonging to the Amblyomma variegatum species (n = 2,806; 8.76 %), the Hyalomma species (n = 2,458; 7.67 %) and the Rhipice-phalus genus, excluding the Boophilus subgenus, (n = 2,436; 7.60 %) showed a comparable abundance. Ticks belonging to the Boophilus subgenus (n = 24,328) repre-sented 76 % of the whole collection. Even when taking into account the 842 Boophilus ticks that could not be assigned to a species, this subgenus was predominantly represented by the invasive species. Indeed, 22,491 of these ticks were identified as R. microplus, 510 as R. annulatus, 308 as R. decoloratus and 177 as R. geigyi.
Geographical variation in tick assemblages
The overall BD estimate was 0.37. It decreased to ~0.20 and ~0.05, when the data from the four different areas were used separately (Table 1). Area #4 was the only area associated with a significantly non-null LCBD esti-mate (P = 0.013; LCBD ~ 0.68 versus < 0.20 for the other areas). Considering the within-area BD distribution, a
significant non-null LCBD estimate was found only at site 4 L (P = 0.037, LCBD ~0.64 versus < 0.20 for the other sites). The correlations between species richness and LCBD were significantly negative for the whole dataset (r = -0.57, P < 10-6), area #2 (r = -0.44, P = 0.03) and area #4 (r = -0.35, P = 0.01).
Overall, R. microplus (SCBD = 0.49) and Hyalomma
spp (SCBD = 0.38) showed the highest distribution
heterogeneity, while the other taxa were more homoge-nously distributed (SCBD < 0.04, Table 1). In area #1, Rhipicephalus spp and A. variegatum (SCBD = 0.40 and 0.37) were the most heterogeneously distributed ticks, followed by R. microplus (SCBD = 0.19). In area #2, R. microplusand A. variegatum (SCBD = 0.38 and 0.32, re-spectively) showed the highest distribution heterogen-eity, followed by Hyalomma spp (SCBD = 0.16). In area #3, Rhipicephalus spp (SCBD = 0.35), R. microplus and
Hyalomma spp (SCBD = 0.23 and 0.22, respectively)
were the most heterogeneously distributed taxa. Area#4 was characterized by high heterogeneity in A.
variega-tum distribution (SCBD = 0.66) and the absence of
three taxa (Rhipicephalus spp, R. annulatus and R. microplus).
Tick assemblage dynamics
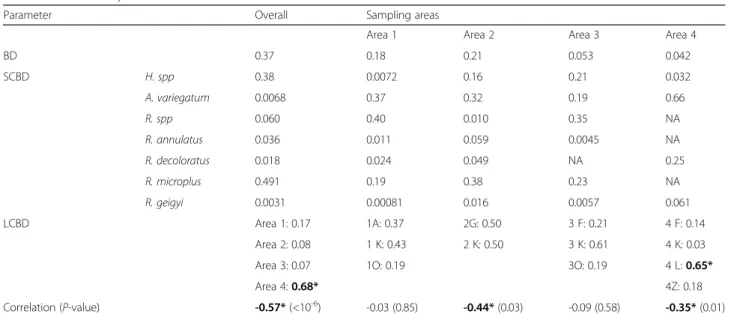
Within-area LCBD dynamics are detailed in Fig. 2. In area #1, the only significant increase in LCBD was ob-served at site 1O in September 2012. This sampling event was characterized by a one-off over-representation of A. variegatum ticks (48 % of all adults ticks collected in September 2012 compared to 5 % on average in this area). In area #2, significantly higher LCBD values were
Table 1 Beta diversity
Parameter Overall Sampling areas
Area 1 Area 2 Area 3 Area 4
BD 0.37 0.18 0.21 0.053 0.042 SCBD H. spp 0.38 0.0072 0.16 0.21 0.032 A. variegatum 0.0068 0.37 0.32 0.19 0.66 R. spp 0.060 0.40 0.010 0.35 NA R. annulatus 0.036 0.011 0.059 0.0045 NA R. decoloratus 0.018 0.024 0.049 NA 0.25 R. microplus 0.491 0.19 0.38 0.23 NA R. geigyi 0.0031 0.00081 0.016 0.0057 0.061 LCBD Area 1: 0.17 1A: 0.37 2G: 0.50 3 F: 0.21 4 F: 0.14 Area 2: 0.08 1 K: 0.43 2 K: 0.50 3 K: 0.61 4 K: 0.03 Area 3: 0.07 1O: 0.19 3O: 0.19 4 L: 0.65*
Area 4: 0.68* 4Z: 0.18
Correlation (P-value) -0.57* (<10-6) -0.03 (0.85) -0.44* (0.03) -0.09 (0.58) -0.35* (0.01)
BD, SCBD and LCBD refer to beta diversity, species-contribution to the beta diversity and local-contribution to the beta diversity.‘NA’ indicates areas where the taxon was absent. The correlation between species richness and LCBD was assessed using the Pearson’s correlation coefficient. Asterisks(*) and bold characters indicate significant(P<0.05) positive correlations
recorded twice at site 2G. Both were associated with over-representation of one taxon. Specifically, Hya-lomma spp represented 74 % of all ticks collected in April 2012 (versus 13 % on average in this area) and R. decoloratus represented 58 % of all ticks collected in January 2013 (versus 8 % on average). In area #3, a sig-nificant LCBD increase was recorded in April 2012 at site 3O. This sampling event was different from the others at site 3O because: (i) R. microplus, which was otherwise the most common species in area #3 (75 % of all ticks col-lected in this area), was absent and (ii) Hyalomma spp ticks represented up to 85 % of all sampled ticks (versus 10 % on average). The LCBD values in area #4 were smaller than those recorded in the other areas (Fig. 2). Nevertheless, a significant LCBD increase was observed at site 4Z in June 2012, when A. variegatum represented 100 % of all collected ticks (versus 16 % on average).
Variations in the mean rainfall and temperature ex-plained only 3 % of LCBD variations (R2adj-climate= 0.03),
while the sampling geography explained 54 % of LCBD variations (R2adj-sites= 0.54, R2adj-climate&sites joined= 0.54).
Seasonal tick abundance patterns
Models failed to converge, and thus to provide seasonal patterns, when all sites of a given area were considered together. Conversely, model convergence, and thus pat-terns of seasonal variation in abundance, was usually ob-tained when each site was considered individually. Generally, the abundance of adult ticks of a given
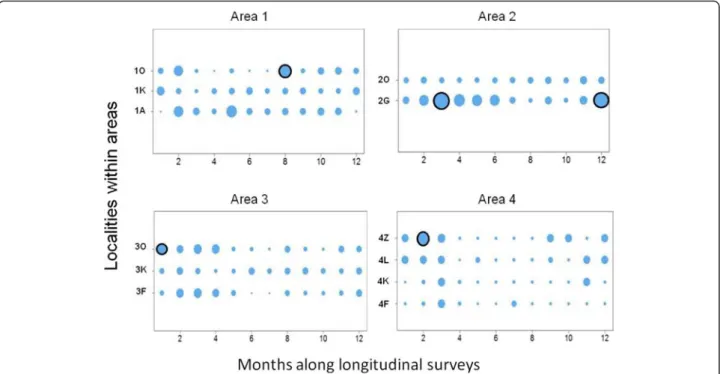
species at a given site could be described by a null esti-mate or at most by three non-null estiesti-mate levels (high, medium or low abundance) (Fig. 3 and Table 2). The ex-ception to this rule occurred when a taxon was sporadic-ally present at a site. Such sporadic distribution characterized the three native species of the Boophilus subgenus at most sites, but for area #2. Similarly, Hya-lomma spp was also sporadically present in the most southern sites (Fig. 3).
Analysis of the abundance patterns of Rhipicephalus spp and R. microplus showed that they were absent in area #4, whereas they were collected in the other three areas all year round (Fig. 3). Rhipicephalus spp showed either one long abundance peak or two-three short peaks between March and August (Fig. 3), with the high-est abundance level high-estimates in area #1 (site 1A: 18 ± 0.9 ticks/steer per month) (Table 2). R. microplus abun-dance showed several uncoordinated peaks in the herds from area #1, but peaked once per year in the other areas where it was observed (from September to December in area #2, and from July to January in area #3, Fig. 3). Its monthly abundance reached 98 ± 11 ticks/steer at site 3 K, but remained below 50 ticks/steer elsewhere (Table 2).
Hyalomma sppabundance peaked twice during the year (from February to June and from August to December), with adults collected all year around except in two of the four sites of area #4 (4 L and 4Z). During the high abundance season, abundance estimates were highest in
Fig. 2 Spatio-temporal LCBD dynamics. The circle size is proportional to the LCBD value. Black rims indicate a significant deviation from the homogeneous distribution (5 % risk; P < 0.05). The first sampling month was February 2012 in areas #1 and #2, April 2012 in area #3 and May 2012 in area #4
area #3 (site 3 F: 7.7 ± 1.0 ticks/steer per month) and lowest in area #4 (site 4 K: 4.3 ± 1.5 ticks/steer per month) (Table 2).
A. variegatum adults were generally collected every-where and all year round. Its abundance tended to peak once in the most arid sites and twice in area #1 (Fig. 3),
Fig. 3 Seasonal variations in abundance. Three panels are shown for each monitored herd/site with the tick taxa listed as follows: Hyalomma spp (H spp), A. variegatum (A v), Rhipicephalus spp (R spp), R. annulatus (R a), R. decoloratus (R d), R. microplus (R m) and R. geygyi (R g). The first panel illustrates the variation in abundance during the 12 months of the survey (one rectangle for each month; the first sampling month being February 2012 in areas #1 and #2, April 2012 in area #3 and May 2012 in area #4), color-coded as follows: white, absence (empty rectangle) or sporadic (rectangle with an“x”) distribution; light grey, low abundance; dark grey, medium abundance; and black, high abundance of the taxon (see Table 2). The second panel refers to the correlations computed between each possible pair of tick taxa (same ranking order of the taxa). The third panel shows the correlation between the temporal distribution of a taxon and the monthly rainfall (first column) or the monthly temperature (second column). Significant correlations are in green (positive) or in red (negative)
with the highest estimates in area #3 (site 3 F: 10.1 ± 2.0 ticks/steer per month) (Table 2).
Congruence in the seasonal variation patterns was observed between A. variegatum and Rhipicephalus spp and their burdens were significantly and positively cor-related at seven of the eight sites were they were both present (Fig. 3; combined P-value across herds: P = 8. 10-36). For these two species, abundance peaks were ob-served at the beginning of the rainy season (i.e., in April-May in area #1, May-June in area #2 and March-April in area #3) and their abundance dynamics were positively correlated with the rainfall variations (Fig. 3; A. variegatum: five significantly positive correlations; combined P-values across herds: P = 5. 10-11; Rhipice-phalus spp: three significantly positive correlations; combined P-value across herds: P = 3. 10-20). Similarly,
A. variegatumand Hyalomma spp abundance dynamics
were positively correlated (Fig. 3; three significantly positive correlations; combined P-value: P = 9. 10-13). Differently from these native ticks, R. microplus abun-dance peaked a few months after the beginning of the rainy season. This resulted in a significantly negative correlation between A. variegatum and R. microplus abundance dynamics in area #3 (Fig. 3; site 3 F). Con-versely, significantly positive correlations were detected between the abundance of the native Boophilus species and that of R. microplus in area #2 (Fig. 3; site 2O), al-though the small number of native ticks weakened the statistical power of the analysis.
Effect of co-infestation patterns on adult tick abundances and incidence rates
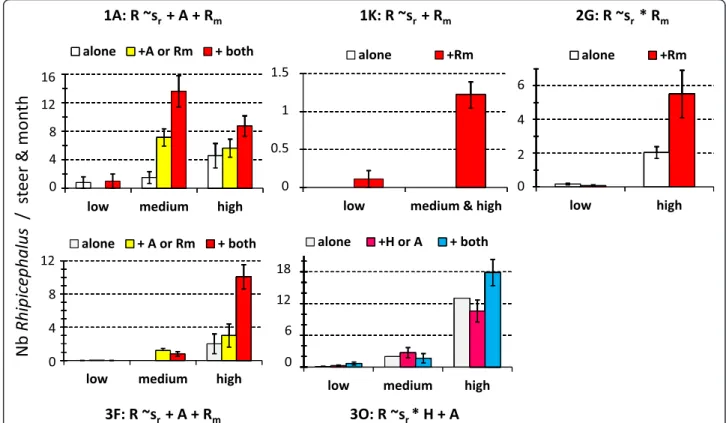
Besides seasonality, the host co-infestation pattern also significantly structured the within-site abundance varia-tions in 19 of the 33 (57 %) taxon-by-site combinavaria-tions defined by the four predominant taxa (Hyalomma spp, A. variegatum, Rhipicephalus spp and R. microplus).
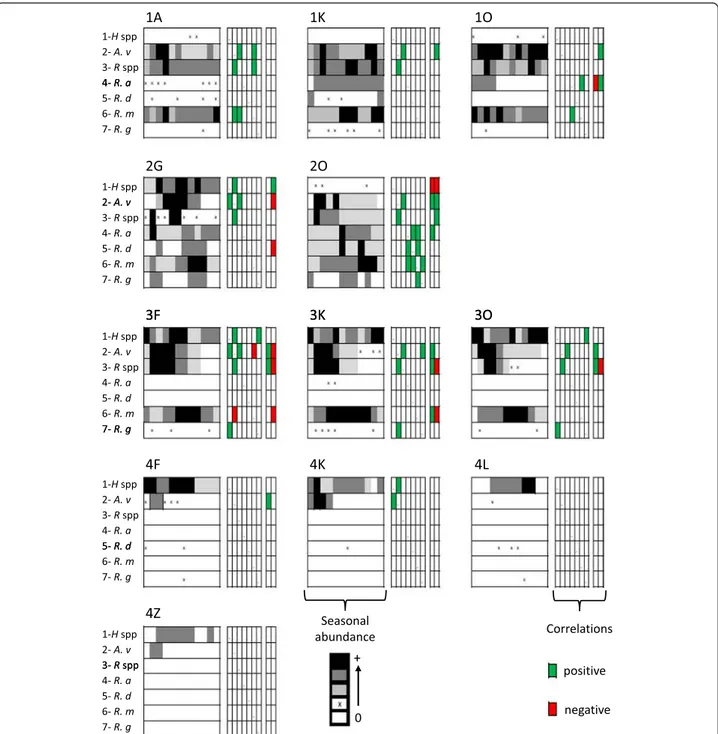
Significant effects of competitors were less frequently observed on Hyalomma spp abundance than on other tested taxa (two significant interactions out of seven tested sites; 28 % vs≥ 50 % for the other taxa). Specific-ally, Hyalomma spp abundance at site 2G during the medium and high abundance seasons was significantly (P < 0.05) higher in the case of co-infestation by A.
varie-gatum and R. microplus than in the absence of
co-infestation (Fig. 4). A similar, but more pronounced ef-fect of co-infestation by A. variegatum on Hyalomma
Table 2 Seasonal abundance estimates (number of ticks per host and per month)
Site Taxon Seasonal abundance estimates High Medium Low 1A A. variegatum 9.3 ± 1.9 2.6 ± 0.6 0.8 ± 0.2 Rhipicephalus spp 18 ± 1.0 6.2 ± 1.0 0.6 ± 0.4 R. microplus 16 ± 4.0 4.8 ± 0.7 0.5 ± 0.2 1 K A. variegatum 0.6 ± 0.2 0.2 ± 0.1 0.04 ± 0.02 Rhipicephalus spp 2.3 ± 0.4 0.7 ± 0.2 0.08 ± 0.08 R. annulatus 0.9 ± 0.2 R. decoloratus 0.8 ± 0.1 R. microplus 30 ± 5.5 18 ± 3.7 1O A. variegatum 4.0 ± 0.4 2.5 ± 0.6 0.3 ± 0.3 Rhipicephalus spp 1.4 ± 0.4 0.2 ± 0.07 R. annulatus 3.3 ± 0.2 R. microplus 15 ± 1.34 8 ± 1.0 1.5 ± 0.7 2G Hyalomma spp 2.9 ± 0.5 0.3 ± 0.2 0.07 ± 0.2 A. variegatum 8.3 ± 1.3 2.7 ± 0.5 0.5 ± 0.1 Rhipicephalus spp 2.6 ± 0.4 R. annulatus 6.2 ± 3.9 2.8 ± 0.5 0.2 ± 0.1 R. decoloratus 1.9 ± 0.6 R. microplus 9.2 ± 1.8 2.5 ± 1.0 0.4 ± 0.2 R. geigyi 1.0 ± 0.4 2O A. variegatum 1.5 ± 0.2 0.3 ± 0.1 Rhipicephalus spp 5.5 ± 1.0 1.2 ± 0.3 0.2 ± 0.1 R. annulatus 3.2 ± 1.6 1.3 ± 0.4 0.3 ± 0.1 R. decoloratus 2.3 ± 0.9 0.10 ± 0.05 R. microplus 39 ± 5.5 20 ± 2.5 4.9 ± 1.1 R. geigyi 0.5 ± 0.1 3 F Hyalomma spp 7.7 ± 1.0 4.6 ± 0.7 2.3 ± 0.8 A. variegatum 10 ± 2.0 2.8 ± 0.7 0.5 ± 0.1 Rhipicephalus spp 7.2 ± 1.2 0.9 ± 0.3 0.06 ± 0.02 R. microplus 34 ± 4.7 5.4 ± 0.8 1.2 ± 0.3 3 K Hyalomma spp 6.8 ± 0.8 3.0 ± 0.5 1.0 ± 0.2 A. variegatum 8.5 ± 1.4 0.5 ± 0.2 Rhipicephalus spp 4.2 ± 0.7 0.2 ± 0.03 R. microplus 98 ± 11 7.3 ± 1.2 1.5 ± 0.5 3O Hyalomma spp 3.5 ± 0.5 1.7 ± 0.2 0.5 ± 0.1 A. variegatum 6.3 ± 1.3 1.0 ± 0.4 0.3 ± 0.1 Rhipicephalus spp 15 ± 1.7 2.3 ± 0.6 1.2 ± 0.1 R. microplus 23 ± 4.2 4.4 ± 0.8 1.1 ± 0.2 4 F Hyalomma spp 3.0 ± 0.5 1.9 ± 0.4 0.7 ± 0.2 A. variegatum 3.0 ± 0.6 4 K Hyalomma spp 4.3 ± 1.5 1.5 ± 0.3 0.2 ± 0.1 A. variegatum 1.1 ± 0.4 0.1 ± 0.1
Table 2 Seasonal abundance estimates (number of ticks per host and per month) (Continued)
4 L Hyalomma spp 1.5 ± 0.3 0.3 ± 0.1 4Z Hyalomma spp 0.4 ± 0.1
spp abundance was observed at site 3O during the low and high abundance season (Fig. 4).
Similarly, A. variegatum abundance significantly in-creased on hosts that were co-infested by Hyalomma spp at sites 2G, 3 K and 3 F (Fig. 5). At site 3 F, this ef-fect was further increased when the host was
simultan-eously co-infected with Rhipicephalus spp and
Hyalomma spp(Fig. 5). At three other sites (1A, 1 K and 2O), host co-infestation by Rhipicephalus spp also had a season-dependent, positive effect on A. variegatum abundance (Fig. 5), with some exceptions. Specifically, Rhipicephalus spp co-infestation had no significant ef-fect at sites 1A and 2O in the medium abundance seasons (Fig. 5).
Fig. 4 Significant impacts of the host co-infestation pattern in Hyalomma spp abundance. The minimal models (i.e., involving factors with significant effects; P < 0.05) are indicated: shrefers to the seasonal abundance variations of Hyalomma spp while A and Rm describe the presence or
absence of co-infestation by A. variegatum and R. microplus, respectively. The histograms refer to the observed distributions. The indications‘alone’, ‘+X’ or‘+ both’ refer to the absence of competitors on the individual-host, or the presence of one or both co-infesting taxa, respectively
Fig. 5 Significant impacts of the host co-infestation pattern in A. variegatum abundance. The minimal models (i.e., involving factors with significant effects) are indicated: sarefers to the seasonal abundance variations of A. variegatum while H and R describe the presence or absence of co-infestation
Analysis of the co-infestation effect on Rhipicephalus sppabundance indicated that the presence of A. variega-tum and/or R. microplus increased Rhipicephalus spp abundance in five of the eight herds where it was found (sites 1A, 1 K, 2G, 3 F and 3O) (Fig. 6). Conversely, at 2G, the season-dependent effect of co-infestation by R. microplus resulted in a decrease of Rhipicephalus spp abundance in the low season (from 0.2 to 0.1 tick/steer per month) and in an increase in the high season (from 2 to 5.5 ticks/steer per month; Fig. 6).
Finally, R. microplus abundance significantly changed with co-infestation by native tick taxa in six out of eight sites (Fig. 7). Co-infestation by A. variegatum signifi-cantly increased R. microplus abundance at sites 1O and 2O in all seasons and at site 3 F in the medium abun-dance season (Fig. 7). Conversely, at site 3 K, A.
variega-tum co-infestation decreased R. microplus monthly
abundance from 62 to 5.1 ticks/steer in the low abun-dance season (Fig. 7). Three other native taxa signifi-cantly (P < 0.05) increased R. microplus abundance. At site 1A, co-infestation by Rhipicephalus spp increased R. microplus abundance in all abundance seasons (Fig. 7). At site 1 K, co-infestation by R. annulatus and/or R. decoloratusincreased R. microplus abundance during the low and high abundance seasons (Fig. 7).
The minimal models retained to explain the within-areas of the tick incidence rates involve the additive and/ or interactive significant effects of sites, seasonal pattern of abundance and co-infestation patterns. The minimal models retained for A. variegatum in area #4 and Hya-lommaspp in areas # 3 and 4 were not considered since they explained less than 10 % of the variation in the tick incidence rates. The ten others are presented with the observed variations in incidence rates in Figs. 8 and 9. In eight cases, the incidence rates of the studied taxon sig-nificantly increased with its seasonal abundance levels (Figs. 8 and 9). Besides seasonality, the incidence rate of
Hyalomma spp significantly increased upon
co-infestation by three other taxa in site 2G. Similarly, the incidence rate of A. variegatum significantly increased upon co-infestation by Rhipicephalus spp and R. micro-plus in area #1 and #2 and upon co-infestation by Hya-lomma spp in area #3 (Fig. 8) Co-infestation by A. variegatumand/or R. microplus increased Rhipicephalus sppincidence rate also in area #1 (sites 1A, 1 K and 1O) in the high abundance season, and in area #2 in all three abundance seasons (Fig. 9).
R. microplus incidence rates also significantly (P < 0.05) increased with co-infestation by Rhipicephalus spp in area #1, by R. decoloratus in area #2 and by both A.
Fig. 6 Significant impacts of the host co-infestation pattern in Rhipicephalus spp abundance. The minimal models (i.e., involving factors with significant effects) are indicated: sRrefers to the seasonal abundance variations of A. variegatum while A, H and Rm describe the presence or
absence of co-infestation by A. variegatum, Hyalomma spp and R. microplus, respectively. The histograms refer to the observed distributions (see Fig. 4 legend)
variegatumand Hyalomma spp in area #3 (Fig. 9). Such effect was particularly visible at site 2O, where R. micro-plus incidence rate reached 100 % among hosts already infested by R. decoloratus, irrespective of the season (Fig. 9). R. microplus incidence rates of 100 % (high abundance season) were also observed in the three sites of area #3 only in hosts co-infested by both A. variega-tumand Hyalomma spp (Fig. 9).
Impact of co-infestation patterns on tick distribution at attachment-sites
Analysis of the effect of co-infestation by the four pre-dominant taxa (Hyalomma spp, A. variegatum, Rhipice-phalus spp or R. microplus) indicated that the presence of competitors often affected the distribution of other ticks on the five host body parts considered (head, legs, flanks, perineum and tail) (see for details the distribution in P1-values in Additional file 1). Specifically, co-infestation by Hyalomma spp significantly affected the distribution of A. variegatum, R. microplus and R. geigyi microplus(in all cases, combined P-value across herds < 0.05). Co-infestation by A. variegatum significantly af-fected the distribution of Rhipicephalus spp, R. annula-tus, R. decoloratus and R. microplus (in all cases, combined P-value across herds < 0.05). Co-infestation by
Rhipicephalus spp significantly affected the distribution of all other taxa (in all cases, combined P-value across herds < 0.02) and co-infestation by R. microplus signifi-cantly affected the distribution of all other taxa (com-bined P-value across herds < 0.05), but for Rhipicephalus spp(combined P-value across herds P = 1).
However, such effects rarely influenced the probability of a taxon to reach its favorite attachment sites (see the distribution in P2-values in Additional file 1). Only R. microplusshowed a significant decrease in the probabil-ity of reaching its favorite attachment sites across the monitored herds upon host co-infestation by Hyalomma spp or A. variegatum (in both cases, combined P-value across herds < 0.05). Similarly, co-infestation by Rhipice-phalus sppdecreased the probability of R. microplus and R. geigyi to reach their favorite attachment sites (in both cases, combined P-value across herds P < 0.05), whereas co-infestation by R. microplus decreased the probability of R. annulatus to reach its favorite attachment sites (combined P-value across herds P < 0.05).
Discussion
This study investigated the determinants in the commu-nity structure of ticks infesting cattle in Benin and Bur-kina Faso. The tick community compositions varied
Fig. 7 Significant impacts of the host co-infestation pattern in R. microplus abundance. The minimal models (i.e., involving factors with significant effects) are indicated: sRmrefers to the seasonal abundance variations of A. variegatum while A, R, Ra and Rd describe the presence or absence of
co-infestation by A. variegatum, Rhipicephalus spp, R. annulatus and R. decoloratus, respectively. The histograms refer to the observed distributions (see Fig. 4 legend)
significantly both within and among areas and the lowest diversity was observed in Central Burkina Faso (area #4) (Table 1; Fig. 2). Climatic differences are likely to explain the between-areas variations but not the within-areas variations, given that the variations in the mean rainfall and temperature explained only 3 % of the spatio-temporal LCBD variation. The alternation of dry and rainy seasons represents nevertheless a factor structuring the significant increases in LCBD punctually observed since they occurred in the early rainy season in Benin and South-West Burkina Faso (April- June), in the late rainy season in South Benin (September) and during the early dry season (December) in North Benin (Fig. 2). Furthermore, tick abundance tended to peak during the rainy seasons, although some delay was observed for the Boophilusspecies relatively to the other taxa. Such delay is related to the life cycle specificity of this one-host tick species. Eggs and unfed larvae are the only stages of the Boophilusspecies living away from the host. Conversely, the other taxa are two- and three-host ticks and not only the eggs and freshly hatched larvae but also other stages can leave the host after complete blood-feeding, thus fa-cing the risk of desiccation in the local habitat [16]. Whatever their life cycle and status (native or invasive species), two infestation dynamic features were common to all tick taxa. First, their infestation dynamics were
determined not only by abiotic parameters (seasonal pat-terns, Table 1), but also by inter-species interactions among cattle ticks (Figs. 4, 5, 6 and 7). Second, positive relationships were observed between their local abun-dance and incidence rate (Figs. 8 and 9); in other words, the tick probability to infect a new host increases with its local mean abundance. This reminds the positive re-lationships between local mean abundance and preva-lence previously reported for fleas [36], nematodes [37] or monogeneans [38].
In Central Burkina Faso (area #4), A. variegatum and Hyalomma spp were the only adult ticks collected. Dif-ferently from what observed in other taxon-by-climatic area combinations, their seasonal abundance variation was not affected by the host co-infestation pattern in this area. In a previous survey performed in 1996 in three cattle herds from Central Burkina Faso, the monthly abundances of H. marginatum rufipes (the only
Hyalomma species observed) and A. variegatum were
estimated to be 7.21 and 7.50 adult ticks/steer (Table 3) [8]. Such estimates are higher than those of the present survey (1.22 and 0.73 adult ticks/steer per month) (Table 3), indicating a decrease in the abundance of na-tive ticks during the last decades in an area not colo-nized by R. microplus. Such a decrease might be the result of global warming in this Sahelian region located
Fig. 8 Within-area variations in incidence rates for A. variegatum and Hyalomma spp. The minimal models (i.e., involving factors with significant effects) are indicated. The histograms refer to the observed distribution in incidence rates among sites, seasons and/or co-infestation patterns
along the limit of the geographical distribution of these species [16]. Moreover, the recycling for tick control of the chemicals designed for agricultural pest control [6] might also have partly contributed to such a decrease.
Although absent from Central Burkina Faso (area #4), R. microplus represented 70 % of all the adult ticks col-lected in this survey. This confirms the invasion success of R. microplus in West Africa [17–25] and further sup-ports the hypothesis that the Sahelian climate is not suit-able to R. microplus [33], although this species was detected along the Cameroon-Nigeria border [22, 23]. Moreover, the high R. microplus abundance in North Benin (area #2) suggests that the presumed ecological niche of this species in West Africa [39] should be re-evaluated. The analysis of the tick attachment sites on the host indicated that R. microplus success to reach its favorite attachment sites significantly decreased upon co-infestation by Hyalomma spp and Rhipicephalus spp. Conversely, co-infestation by R. microplus did not affect the success of native tick species to attach on their fa-vorite sites (but for R. annulatus) (Additional file 1). As the favorite attachment sites are likely to be the result of
evolution, these results suggest that the native tick spe-cies impose higher competitive constraints on the inva-sive species than the invainva-sive species on the native ones. Experimental manipulation of host co-infestation and tick fertility monitoring would be required to settle this point. However, the competition exerted by R. microplus on native tick species can be assessed by comparing the present abundance estimates with those obtained before R. microplus arrival [7–9]. The surveys performed in North Benin in the early 2000s led to different estimates in the adult abundance of the native tick taxa than the present study (Table 3). Interestingly, R. decoloratus was not detected in these earlier studies, while our survey found that it was the predominant native species of the Boophilussub-genus. Moreover, the abundance of R. gei-gyi adults has decreased since the early 2000s, whereas the abundance of R. annulatus adults has increased (Table 3). Overall, the abundance of adult ticks from the native Boophilus species (R. decoloratus, R. geygyi and R. annulatus) has increased from 2003 to 2013 (Table 3). This does not support the hypothesis that R. microplus
is replacing the native sister-species. The same
Fig. 9 Structure of the within-area variations in incidence rates for Rhipicephalus spp and R. microplus. The minimal models (i.e., involving factors with significant effects) are indicated. The histograms refer to the observed distribution in incidence rates among sites, seasons and/or co-infestation patterns
conclusion is reached when considering all native tick taxa (Table 3). The composition of the tick communities has changed over the years; however these changes do not translate in an overall decrease in the abundance of native taxa. Therefore, rather than displacing the native tick taxa and the associated veterinary health concerns, the successful demographic increase of R. microplus in West Africa has added new tick-associated risks for cat-tle health.
Aggregated distributions of tick taxa among herds were recurrently observed in Benin and South-West Burkina Faso (areas #1 to 3) because the local abun-dances and/or incidence rates of each taxon increased with the co-infestation by other taxa. This is a character-istic shared by several mammalian ectoparasite commu-nities [39–43]. As genetic bases for this trait exist in cattle, this may open the road to the selection of breeds with lower susceptibility to tick infestation [17]. This feature may also facilitate the communication to local stakeholders regarding tick control. Indeed, the eco-nomic advantage of focusing tick control programs on animals that are infested above a threshold burden might counter-balance the average loss in animal growth and milk yield in places where cattle production rely mainly on low input systems and tick burden remains moderate, such as in West Africa. It remains to deter-mine whether the aggregated distribution of tick taxa also affects the distribution of the tick-borne pathogens circulating among West African cattle. Variable patterns have been previously reported. Competitive exclusion among tick-borne pathogens was observed in Algerian
cattle [44]. Conversely, aggregative distribution seems to be the rule in South Africa for tick-borne pathogens monitored in mammalian blood samples or in the tick salivary glands [45, 46].
Conclusion
This study is the first attempt to quantify the impact of co-infestation patterns among native and invasive tick species. It shows that these patterns are key factors in the determination of the infestation dynamics of each tick taxon in West African cattle. It also shows that the R. microplus-related risks for cattle health in West Africa are not replacing but are adding to those caused by na-tive tick taxa.
Additional file
Additional file 1: Effect of the co-infestation patterns on the distribution of tick attachment sites. (XLS 98 kb)
Competing interests
The authors declare that they have no competing interest. Authors’ contributions
AB, SA, SF, HA, CC designed the study. HA, AB, SA, SZ coordinated and participated to field sampling, and identified the collected ticks. AB and CC performed the data analysis and wrote the first draft. All authors read and approved the final version of the manuscript.
Acknowledgments
We thank the farmers for their kind cooperation to this survey. This research was funded by Australian Aid (AusAID, project WECATiC). AB benefited from a SCAC fellowship from the Embassy of France in Benin and complementary funding from IRD, a Cooperative Agreement between MIVEGEC and with
Table 3 Temporal changes in the abundance of native tick taxa
Year site Hyalomma spp A. variegatum Rhipicephalus spp R. annulatus R. decoloratus R. geigyi Boophilus spp All taxa North Benin (area #2)
2003–04 All sites 0.52 ± 0.08 1.19 ± 0.20 4.04 ± 0.12 0.31 ± 0.07 1.15 ± 0.17 1.46 ± 0.20 3.50 ± 0.47 2004–05 All sites 0.40 ± 0.14 4.13 ± 1.33 0.12 ± 0.03 0.19 ± 0.08 1.07 ± 0.17 1.26 ± 0.17 5.92 ± 1.50 Bassila 0.14 ± 0.04 4.59 ± 0.22 0.12 ± 0.04 0.12 ± 0.04 1.12 ± 0.18 1.28 ± 0.22 6.13 ± 1.49 Materi 0.67 ± 0.27 3.68 ± 0.16 0.34 ± 0.12 0.21 ± 0.06 1.02 ± 0.02 1.23 ± 0.17 5.71 ± 1.58 2012–13 All sites 0.79 ± 0.21 2.02 ± 0.81 0.83 ± 0.22 0.72 ± 0.28 1.12 ± 0.33 0.29 ± 0.11 2.13 ± 0.65 5.77 ± 0.92 2G 1.47 ± 0.40 3.33 ± 0.78 0.76 ± 0.35 0.93 ± 0.51 1.34 ± 0.55 0.35 ± 0.18 2.63 ± 0.78 8.18 ± 1.83 2O 0.24 ± 0.16 0.74 ± 0.50 0.91 ± 0.44 0.50 ± 0.28 0.85 ± 0.27 0.22 ± 0.09 1.58 ± 0.55 3.47 ± 0.47 Central Burkina Faso (area #4)
1996 All sites 7.21 ± 1.54 7.50 ± 4.14 7.35 ± 2.59 2012–13 All sites 1.22 ± 0.26 0.73 ± 0.17 0.97 ± 0.21 4 F 1.94 ± 0.50 0.53 ± 0.33 1.24 ± 0.34 4 K 1.26 ± 0.35 0.17 ± 0.14 0.72 ± 0.23 4 L 0.66 ± 0.28 0.007 ± 0.007 0.33 ± 0.14 4Z 0.23 ± 0.12 0.056 ± 0.037 0.14 ± 0.06
The mean monthly abundance of adult ticks/steer were computed from the data collected in 1996 [7], 2003–04 [9], 2004–05 [8] and 2012–13 (present study); the standard error of the mean refers to the variations observed during the 12 months of each survey. Boophilus spp includes the three native species of this subgenus (R. annulatus, R. decoloratus and R. geigyi)
ARS-USDA (Kerrville, Texas), the International Foundation for Science (www.ifs.se/) and the“International Laboratory of Vector-borne Diseases in West Africa (LMI LAMIVECT)” that groups together different laboratories working on vectors and vector-borne diseases in West Africa. We also thank M. Pascal YAKA (Direction Générale de la Météorologie du Burkina Faso) for his help in getting climatic data for Burkina Faso.
Author details
1Unité de Recherche en Biotechnologie de la Production et de la Santé
Animales (URBPSA), Laboratoire de Recherche en Biologie Appliquée, Ecole Polytechnique d’Abomey-Calavi, 01 BP 2009 Cotonou, Bénin.2Unité de
Recherche sur les bases biologiques de la Lutte Intégrée (URBIO), Centre International de Recherche-Développement sur l’Elevage en zone Subhumide (CIRDES), 559, 3-51 Avenue du Gouverneur Louveau, 01 B.P. 454 Bobo-Dioulasso 01, Burkina Faso.3IRD, UR 224‘Maladies Infectieuses et
Vecteurs: Ecologie, Génétique, Evolution et Contrôle (MIVEGEC), Montpellier, France.4Département des Sciences et Techniques de l’Elevage (DSTE/FASE),
Université Dan Dicko Dan Koulodo, BP 465 Maradi, Niger.5CNRS, Université
Montpellier, UMR 5290 MIVEGEC, Montpellier, France.
Received: 3 September 2015 Accepted: 14 January 2016
References
1. Anonymous. Enquête Nationale Sur Les Effectifs Du Cheptel. Ministère des Ressources Animales et Ministère de l’Economie et du Développement. Ouagadougou. Burkina Faso; 2004.
2. Country Stat pour l’Afrique Sub-Saharienne. Bénin- Premier rapport panorama. FAO;2009.
3. Djenontin JA. Dynamique des stratégies et des pratiques d’utilisation des parcours naturels pour l’alimentation des troupeaux bovins au Nord-Est du Bénin. Thèse de doctorat. Université d’Abomey-Calavi; 2010.
4. Djenontin JA, Madjidou O, Houinato MR, Mensah GA, Sinsin BA. Le calendrier pastoral en élevage extensif dans le Nord-Est du Bénin : un outil de gestion du cheptel bovin de l’exploitation. Sécheresse. 2012; 23:261–70.
5. Nianogo AJ, Somda J. Diversification et intégration inter-spécifique dans les élevages ruraux au Burkina Faso. Biotechnol Agron Soc Environ. 1999;3:133–9. 6. Adakal H, Stachurski F, Chevillon C. Tick control practices in Burkina Faso
and acaricide resistance survey in Rhipicephalus (Boophilus) geigyi (Acari: Ixodidae). Exp Appl Acarol. 2013;59:483–91.
7. Kaboré H, Salembere MS, Tamboura HH. Seasonal Variation of Ticks on Cattle in Burkina Faso. Ann N Y Acad Sci. 1998;849:398–401.
8. Farougou S, Kpodekon M, Tchabode DM, Youssao AKI, Boko C. Abondance saisonnière des tiques (Acari: Ixodidae) parasites des bovines dans la zone soudanienne du Bénin: cas des départements de l’Atacora et de la Donga. Ann Med Vet. 2006;150:145–52.
9. Farougou S, Kpodekon M, Tassou AWY. Abondance saisonnière des tiques (Acari : Ixodidae) parasites des bovins dans la zone soudanienne du Bénin : cas des départements du Borgou et de l’Alibori. Rev Afric Santé Prod Anim. 2007;5:61–7.
10. Grindatto A, Bayala I, Sidibé I, Kanwé A, Mattoni M, Tomassone L. Ticks and tick-borne pathogens in cattle from peri-urban area of Bobo-Dioulasso. Burkina Faso: Proceedings of the VI International Conference on Ticks and Tick-Borne Pathogens; 2008. p. 183.
11. Farougou S, Adakal H, Biguezoton AS, Boko C. Prévalence de l’infection d’Amblyomma variegatum par Ehrlichia ruminantium dans les élevages extensifs du Bénin. Rev Med Vet. 2012;163:261–6.
12. Stachurski F, Musonge EN, Achu-Kwi MD, Saliki JT. Impact of natural infestation of Amblyomma variegatum on the liveweight gain of male Gudali cattle in Adamawa (Cameroon). Vet Parasitol. 1993;49:299–311. 13. Norval RAI, Sutherst RW, Jorgensen OG, Kerr JD. The effects of the bont tick,
Amblyomma hebraeum, on milk production of Sanga and Sanga x Brahman cattle. Med Vet Entomol. 1997;11:143–7.
14. Stachurski F. Modalités de la rencontre entre la stase adulte de la tique Amblyomma variegatum (Acari, Ixodida) et les bovins : applications potentielles à la lutte contre ce parasite. PhD thesis, Université Montpellier II; 2000.
15. De Castro JJ. Sustainable tick and tick-borne disease control in livestock improvement in developing countries. Vet Parasitol. 1997;71:77–97.
16. Walker AR, Bouattour A, Camicas JL, Estrada-Peña A, Horak IG, Latif AA, et al. Ticks of domestic animals in Africa: A guide to identification of species. University of Edinburgh Scotland Press; 2003.
17. Frisch J. Towards a permanent solution for controlling cattle tick. Int J Parasitol. 1999;29:57–71.
18. Madder M, Thys E, Geysen D, Baudoux C, Horak I. Boophilus microplus ticks found in West Africa. Exp Appl Acarol. 2007;43:233–4.
19. Madder M, Thys E, Achi L, Toure A, De Deken R. Rhipicephalus (Boophilus) microplus: a most successful invasive tick species in West-Africa. Exp Appl Acarol. 2011;53:139–45.
20. Madder M, Adehan S, De Deken R, Adehan R, Lokossou R. New foci of Rhipicephalus microplus in West Africa. Exp Appl Acarol. 2012;56:385–90. 21. Toure A, Diaha CA, Sylla I, Kouakou K. Récente recomposition des
populations de tiques prévalentes en Côte d’Ivoire. Int J Biol Chem Sci. 2014;8:566–78.
22. Opara MN, Ezeh NO. Ixodid ticks of cattle in Borno and Yobe states of northeastern Nigeria: breed and coat colour preference. Anim Res Int. 2011; 8:1359–65.
23. Musa HI, Jajere SM, Adamu NB, Atsanda NN, Lawal JR, Adamu SG, et al. Prevalence of tick infestation in different breeds of cattle in Maiduguri, northeastern Nigeria. Bangl J Vet Med. 2014;12:161.
24. Adakal H, Biguezoton A, Zoungrana S, Courtin F, De Clercq EM, Madder M. Alarming spread of the Asian cattle tick Rhipicephalus microplus in West Africa—another three countries are affected: Burkina Faso. Mali and Togo Exp Appl Acarol. 2013;1:383–6.
25. De Clercq EM, Vanwambeke SO, Sungirai M, Adehan S, Lokossou R, Madder M. Geographic distribution of the invasive cattle tick Rhipicephalus microplus, a country-wide survey in Benin. Exp Appl Acarol. 2012;58:441–52. 26. Tønnesen MH, Penzhorn BL, Bryson NR, Stoltsz WH, Masibigiri T.
Displacement of Boophilus decoloratus by Boophilus microplus in the Soutpansberg region, Limpopo Province. South Africa Exp Appl Acarol. 2004;32:199–09.
27. Zeman P, Lynen G. Evaluation of four modelling techniques to predict the potential distribution of ticks using indigenous cattle infestations as calibration data. Exp Appl Acarol. 2006;39:163–76.
28. Lorusso V, Picozzi K, de Bronsvoort BM, Majekodunmi A, Dongkum C, Balak G, et al. Ixodid ticks of traditionally managed cattle in central Nigeria: where Rhipicephalus (Boophilus) microplus does not dare (yet?). Parasite Vector. 2013;7:166.
29. Anderson MJ, Crist TO, Chase JM, Vellend M, Inouye BD, Freestone AL, et al. Navigating the multiple meanings of beta diversity: a roadmap for the practicing ecologist. Ecol Lett. 2011;14:19.
30. Legendre P, De Caceres M. Beta diversity as the variance of community data: dissimilarity coefficients and partitioning. Ecol Lett. 2013;16:951–63. 31. Legendre P, Gauthier O. Statistical methods for temporal and space–time
analysis of community composition data. Proc Roy Soc Biol. 2014;281:1–9. 32. Crawley MJ. The R, Book. England: John Wiley & Sons Ltd; 2007.
33. Whitlock MC. Combining probability from independent tests: the weighted Z-method is superior to Fisher’s approach. J Evol Biol. 2005;18:1368–73. 34. De Meeûs T, Guégan J-F, Teriokhin AT. MultiTest V.1.2, a program to
binomially combine independent tests and performance comparison with other related methods on proportional data. BMC Bioinfo. 2009;10:1–8. 35. Burns P. Random portfolios for performance measurement. In:
Kontoghiorghes EJ, Gatu C, editors. Optimisation, econometric and financial analysis, Springer; 2007. p. 227-249.
36. Krashnov BR, Morand S, Khokhlova IS, Shenbrot GI, Hawlena H. Abundance and distribution of fleas on desert rodents: linking Taylor’s power law to ecological specialization and epidemiology. Parasitology. 2005;131:825–37.
37. Morand S, Guégan JF. Distribution and abundance of parasite nematodes: ecological specialization, phylogenetic constraints or simply epidemiology? Oikos. 2000;563–573.
38. Simkova A, Kadlec D, Gelnar M, Morand S. Abundance-prevalencerelationship of gill congeneric ectoparasites: testing the core satellite hypothesis and ecological specialization. Parasitol Res. 2002;88:682–6.
39. De Clercq EM, Estrada-Peña A, Adehan S, Madder M, Vanwambeke SO. An update on distribution models for Rhipicephalus microplus in West Africa. Geospat Health. 2013;8:301–8.
40. Lutermann H, Fagir DM, Bennett NC. Complex interactions within the ectoparasite community of the eastern rock sengi (Elephantulus myurus). Int J Parasitol Parasite Wildlife. 2015;4:148–8.
41. Matthee S, Krasnov BR. Searching for the generality in the patterns of parasite abundance and distribution: ectoparasites of a South African rodent, Rhabdomys pumilio. Int J Parasitol. 2009;39:781–8.
42. Krasnov BR, Schenbrot GL, Khoklova IS. Agregative structure is the rule in communities of fleas : null model analysis. Ecography. 2001;34:751–61. 43. Krasnov BR, Stanko M, Morand S. Competition, facilitation or mediation via
host? Patterns of infestation of small European mammals by two taxa of haematophagous arthropods. Ecol Entomol. 2010;35:37–4.
44. Dib L, Bitam I, Tahri M, Bousouilah M, de Meeûs T. Competitive exclusion between piroplasmosis and anaplasmosis agents within cattle. PLoS Path. 2008;4:7.
45. Berggoetz M, Schmid M, Ston D, Smith V, Chevillon C, Pretorius AM, et al. Tick-borne pathogens in the blood of wild and domestic ungulates in South Africa: Interplay of game and livestock. Ticks Tick-borne Dis. 2014;5: 166–75.
46. Berggoetz M, Schmid M, Ston D, Smith V, Chevillon C, Pretorius AM, et al. Protozoan and bacterial pathogens in tick salivary glands in wild and domestic animal environments in South Africa. Ticks Tick-borne Dis. 2014;5: 176–85.
• We accept pre-submission inquiries
• Our selector tool helps you to find the most relevant journal • We provide round the clock customer support
• Convenient online submission • Thorough peer review
• Inclusion in PubMed and all major indexing services • Maximum visibility for your research
Submit your manuscript at www.biomedcentral.com/submit