Artificial defects in CFRP composite structure for thermography and
shearography nondestructive inspection
P. Blain
a*, J-F. Vandenrijt
a, F. Languy
a, M. Kirkove
a, L.-D. Théroux
b, J. Lewandowski
b, M.
Georges
a.a
Centre Spatial de Liege, University of Liege, Liege Science Park, 4031 Angleur, Belgium;
b
Centre Technologique en Aérospatiale, Place de la Savane 5555, St-Hubert QC J3Y 8Y9, Canada
ABSTRACT
Locating defects in CFRP composite materials is a hot topic in nondestructive inspection (NDI). Beside classical NDI technique, such as ultrasound testing (UT), contactless techniques are actively studied. Generally manufacturers of CFRP structure incorporate artificial defects in the bulk, with different extents and depths, in order to study the performance of a specific NDI technique to detect the defect. One of the most common defects in CFRP is delamination between two layers. This is simulated by inserting teflon sheets which, like air, acts as ultrasound blocker in UT. When such reference part is used to assess NDI performance of thermography or shearography, we only observe respectively the thermal or mechanical response of teflon with respect to external loading used with these techniques. In this work, we assess other possibilities for artificial defects in CFRP matrix. For that a CFRP structure was developed and which incorporates teflon, flat-bottom holes and delamination obtained by the pull-out method. We experimentally studied the signals and we discuss the difference between the various artificial defects methods.
Keywords: Nondestructive inspection, shearography, thermography.
1. INTRODUCTION
For controlling the integrity of many industrial products of industry, nondestructive inspection (NDI) techniques are used in order to detect defects at different stages of the product life-cycle. In the field of aeronautic industry, composite materials made of layers of carbon fiber in resin epoxy (carbon fiber reinforce polymers, CFRP) are widely used. Therefore there is a huge effort in finding the best NDI techniques and strategies to locate and quantitatively assess defect parameters, to decide if the defect is critical or not. The effort in assessing performances of NDI techniques is based on reference sample parts made of CFRP with artificial defects which are certified under international norms. The state-of-art technique which is used to perform NDI nowadays is ultrasound test (UT) [1]. This range of technique generally works on a single point emitter/detector in direct contact with inspected parts, or through coupling medium (e.g. water tank) and requires scanning. Some alternative exist with multi-element UT probes. In the pulse-echo UT method, a pulsed ultrasound wave is generated at the surface of the inspected part, it travels inside the structure and is reflected either on the back side of the part, or on any feature inside the structure, like defects. When it returns at the surface, we detect the so-called echo. The echo can be compared to the initial pulse to determine both attenuation of the signal and time interval. Using both allows one to determine density variations, distance to defect, etc... In the case of CFRP materials, one of the important defects to detect is delamination that occurs between layers. This can appear during production or after an impact during life-cycle. The lateral extent and depth need to be assessed by NDI process. In the case of UT, such internal void will block the ultrasound wave, resulting in a well differentiated echo response compared to the surrounding sound area. In order to assess such type of defects, artificial defects have been developed and by aeronautical industries and which have the same behavior that true delamination with respect to UT. These artificial defects are generally made of teflon sheets inserted between layers of CFRP. In order to assess performances of NDI techniques, teflon inserts of various sizes, shapes are placed at different depths of the CFRP laminate. Other alternative artificial defects are also used to reproduce the effect of delamination in UT: the flat bottom holes and the pull-out. In the former method, a hole is drilled at different depths with respect to the back side of the sample. In the latter, a metallic sheet is inserted at the edge of the sample before the CFRP curing process. Once the laminate manufacturing process is completed, these metallic sheets are simply pulled out of the matrix.
When assessing NDI techniques different to UT, often such reference parts with those types of artificial defects are proposed. In our case we develop non-contact optical NDI techniques for composites, such as thermography [2][3] and holography[4]/shearography[5][6]. The latter are interesting compared to UT because they are full-field and contactless. They provide different types of information and are complementary in nondestructive testing [7]-[9]. Both these techniques are active: an external loading or stimulus is applied to the sample. The most common way is to heat the surface by an infrared lamp. A heat wave then travels through the material. In thermography, a sequence of images (thermograms) are recorded and show the thermal variations at the surface of the sample and which are perturbed by the presence of underneath defect. The visibility of defects signatures depends on many factors like the material, the nature of the defect, its extent and depth. When several defects are present at different depths, the shallow ones are visible just at the beginning of the observation sequence, whereas the deeper ones appear later. Therefore, it is of high interest to capture a sequence of images and to search for the different defects by analyzing all the images of the sequence. In shearography, one observes the local mechanical effect (lateral slope of out-of-plane displacement field) related to the defect which is hit by the heat wave. In this case, interferograms or phase maps computed between a reference state and a deformed state show a concentration of fringes inside the fringe pattern and that is due to the internal defect. The temporal evolution of the phase maps should also give an indication of the defect depth.
The purpose of the paper is to study thermography and shearography on reference parts with artificial defects certified for UT (teflon, flat bottom hole and pull-out methods). Indeed when developers of thermography or shearography techniques want to assess their techniques on the basis of industrial composite parts, they receive reference samples prepared generally for UT. In the case results are not convincing, industrials often conclude that these NDI techniques are not adequate. However the question arises if such reference composite parts are adequate for assessing thermography and/or shearography performances. Therefore we propose in our study to compare signals obtained by UT on such a reference part with signals obtained by thermography and shearography.
In section 2, we will describe the reference sample used for the study and the results obtained by UT on 3 types of artificial defects. In section 3, we will present the thermography and shearography setup and test protocol. In section 4 we will explain the data processing on the measurements and the results. At last, in section 5, we will present a qualitative comparison of both techniques on the different types of artificial defects.
2. THE CFRP REFERENCE SAMPLE WITH ARTIFICIAL DEFECTS
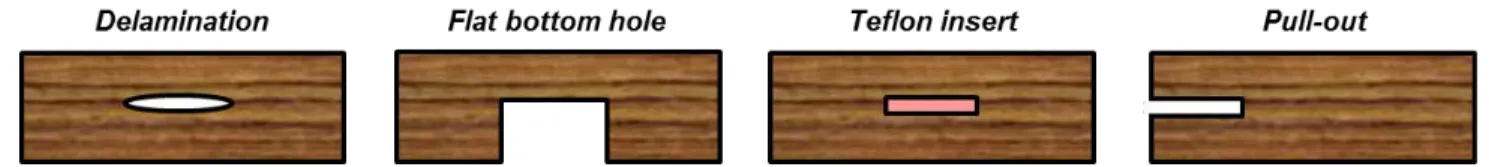
The CFRP composite reference sample was built by the “Centre Technologique en Aérospatiale” (CTA). It includes three different types of artificial defects. Figure 1 shows drawings with a true delamination (left) and the three methods for simulating delamination when the sample is observed from the upper surface: (from left to right) flat-bottom hole, teflon insert and pull-out. All are displayed lying at the same apparent depth as the true delamination. The pull-out can be generated only at the edge of the part, due to its manufacturing process which consists to remove a metallic sheet after polymer curing.
Figure 1. True delamination and 3 methods of artificial defects in CFRP laminates for UT NDI.
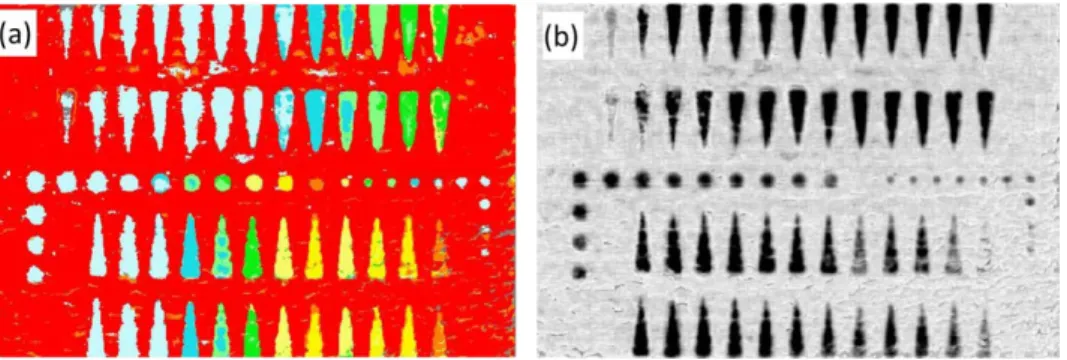
The CFRP reference sample is shown in Figure 2(b). The teflon inserts and pull-outs have isoscele triangular shapes while flat-bottom holes have a circular shape due to their manufacturing by drilling. The defects positions, their shapes and their depths are precisely known (Figure 2 (a)). The green rectangle shows the part of the sample which was observed by thermography and the red one by shearography. Figure 3 shows the C-scans obtained by UT NDI on the whole sample. In Figure 3 (a), the time-of-flight (TOF) result is shown. The different colors are used to show the time interval retrieved from temporal diagrams captured in each point of the surface (A-scans) and which show the initial ultrasound pulse and its echo returning at the surface. The C-scan displayed here is formed by putting all measurements together on a 2D representation. The red color represents zones where no defect is present and corresponds to the longest
time interval, typical from ultrasound wave reflecting from the sample's back wall and which do not encounter one of the artificial defects. At defect location, the echo takes a shorter time to come back at the front surface. Other colors are used to code these time intervals. It can be seen in Figure 3(a), that some of the triangle defects have the same color. This means that they are located at the same depths. Pull-out and teflon inserts of same depth are placed on the same column and we see no difference in color. Also flat-bottom holes having the same depth show equivalent color (although they are not aligned with other same-depth defects on the plate). It must be mentioned that a non-negligible part of the defects appear with the same grey color in Figure 3(a). This is typical of shallow defects for which the time interval is too short between the first pulse and its echo, generating an error. Such shallow defects belong to the so-called "dead zone" of UT. In Figure 3(b), the amplitude C-scan is given and also shows that the artificial defects of different natures have the same signatures. The conclusion from these TOF and amplitude C-scans is that one cannot distinguish between different types of artificial defects in UT.
Figure 2. CFRP matrix. (a) Defects positions and depths of the defects. The depths of some of the defects are indicated. The red rectangle shows the area seen by the shearographic camera and the green one shows the area seen by the thermographic
camera. (b) Picture of the CFRP plate sample back side.
Figure 3. C-scans obtained by UT for comparison (a) time-of-flight, (b) amplitude.
3. TEST SETUP AND MEASUREMENT PROTOCOL
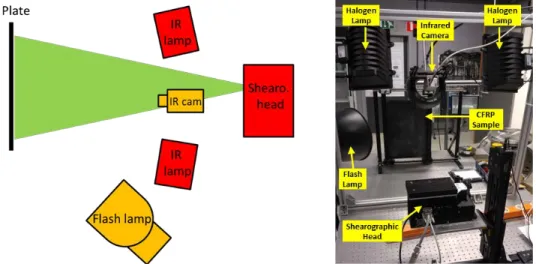
The lab setup is shown in Figure 4. It combines thermography and shearography on a same platform. The thermography setup is composed of a GOBI 640×480 pixels IR camera from Xenics®. A thermal stimulus is generated thanks to a 6000 Joules flash lamp from Hensel®. A sequence of thermographic images is acquired at the sampling frequencies of 50 Hz. A sequence is obtained by using a flash lamp placed on the front side of the sample. After a short and powerful pulse, an IR camera stores sequence of thermographic images over some time. The sequence contained 1000 images acquired over 20 seconds.
The shearography setup is composed of a basic shearography head in a Michelson interferometer configuration [5] . The image of the object illuminated by the laser is splitted in two equal images by a beamsplitter cube. Both images travel to separate mirrors which reflect them to a CCD camera through the beamsplitter. One of the mirrors is slightly misaligned in order to produce a lateral displacement between both images (so-called shearing). At the overlap, an interference occurs between the twin images, forming the so-called shearogram. A piezotranslator placed on one of the mirror allows temporal phase-shifting for computing the phase of the recorded shearograms. Shearograms recorded at different instants during object load (e.g. heating) allow computing phase difference between two states of the object. These phase maps can be used to determine the spatial derivative of the out-of-plane displacement along the shearing direction. The thermal stimulus here is produced thanks to two 750 Watt halogen lamps that are placed as is shown in the left part of Figure 4. The coherent illumination of the plate is obtained thanks to a 300 mW 532 nm DPSS laser diode which beam is extended with a microscope lens. The tested plate is placed at about 1 meter from the lamps. A sequence of phase-shifted shearograms is acquired at the sampling frequency of 1 Hz. In the next section, we explain how are processed the data captured by both thermography and shearography.
Figure 4. Test Setup. (Left) Scheme of the test setup as seen from above. (Right) Picture of the test setup as seen from behind
4. DATA PROCESSING AND RESULTS
4.1 ThermographyA sequence of thermogram (image of emitted thermal radiation) taken before the heating pulse is digitally stacked in order to create a 3-dimensional (3D) data cube T i j k( , , ), where i and j represent indices of pixels, and k the kth image of the temporal sequence. As we use only one lamp placed on the side of the plate, we observe a thermal signal of higher temperature on this side and which is the footprint of the flash lamp. We are interested in observing the net temperature evolution of a given defect with respect to its sound neighborhood. Therefore we need to remove this inhomogeneous background in the 3D data stack. This is achieved by fitting the data cube by a 3rd degree polynomial P x y t( , , ) based on least square method and removing it from the raw data.
In order to extract the temporal behavior of a defect area, instead of considering a single pixel, we use a spatial averaging over N×N pixels centered on the region of interest covering the defect centered at pixel coordinates(xd,yd). This allows obtaining a smoother temporal curve of temperature. We also select a similar N×N pixels pattern in a sound area ( ,x ys s) , just beside the defect. If T x( d,y td, ) is the temporal signal at the defect, T x y tR( ,s s, ) the equivalent at the sound
(reference) area, and P xT( d,y td, ) the polynomial fit of the global heating computed on the whole data set T x y t( , , ), we form a net and corrected temporal thermography signal at the defect Tnet(xd,y td, ) using
(
)
(
(
)
(
)
(
)
)
² 1 , , = , , , , , , ² net d d T d d R s s N d d T x y t T x y t P x y t T x y t N∑
− −(1)
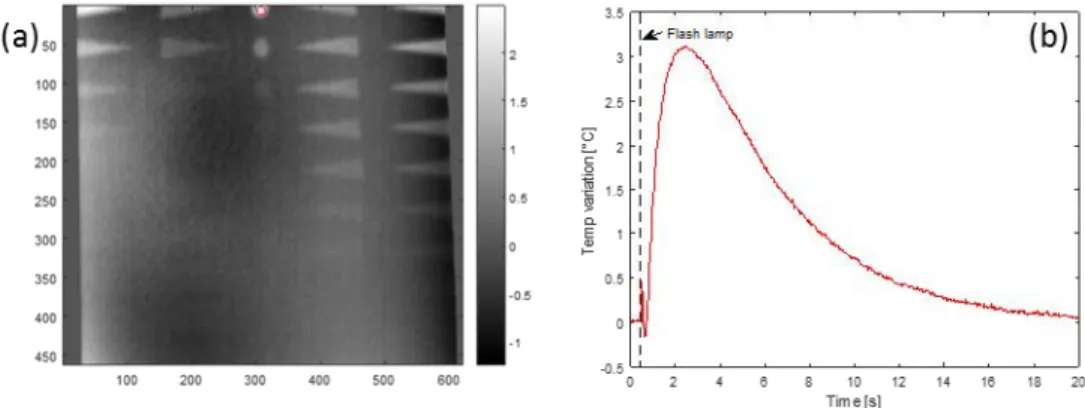
In order to illustrate the principle of data processing, Figure 5 (a) shows one thermogram after Eq(1) has been applied on raw temperature data. A defect has been selected and is circled in red, here on a circular flat-bottom hole. The net and corrected temperature curve averaged on the N×N pixels area centered at the defect is shown in Figure 5(b). It shows the temporal evolution after the flash lamp has reached the sample. Since the processing consists of retrieving the temperature of the surrounding neighborhood, the curve in Figure 5(b) shows the temperature contrast of the defect. This type of curves will be used later for comparing the different types of artificial defects.
Figure 5. Thermography processing and result. (a) One thermogram of the full temporal sequence after processing; the red circle indicates the defect location. (b) Net and corrected temporal evolution of temperature at defect.
4.2 Shearography
The same processing is applied to the shearography data. But unlike in thermography, where the temperature signal in every pixel has a monotonic evolution, shearography phase maps are computed modulo 2π. These phase jumps have to be removed by phase unwrapping [10]. After phase unwrapping, we want to obtain a monotonic curve showing the mechanical reaction (slope of displacement) of the defect and compare it to its neighborhood. Nevertheless, the problem is not simple. Indeed, besides the local behavior of defect displacement, the whole plate is deformed under the effect of the heating, showing fringes related to the global deformation. The latter can change from time to time, due to perturbations in the environment. We have to eliminate these variations of global deformation in order to find the net effect of a defect deformation with respect to its neighborhood. For that we look at phase map at every instant tk (for example Fig 6(a)) and unwrap it to obtain∆φunw
(
x y t, ,k)
(Fig 6(b)). The global deformation, that can be observed as two fringes globally oriented from bottom left to upper right in Fig 6(a)), has to be removed from the unwrapped result. For that, we apply a polynomial fit on the unwrapped phase, leading to a distribution of phase P∆φ(
x y t, , k)
displayed in Fig 6(c). Then we remove the latter from phase of Fig 6(b) and obtain a corrected phase map (Fig 6(d)), which can be expressed as follows, for all pixels in the image(
, ,)
= , ,(
)
(
, ,)
corr x y tk unw x y tk Pφ x y tk
φ φ ∆
∆ ∆ −
(2)
Figure 6. Shearography pre-processing (a) wrapped phase map, (b) unwrapped phase map, (c) polynomial fit of (b), (d) corrected phase map obtained by subtracting (c) to (b).
Having done the same type of processing for phase maps for all instantstk, we applied the temporal phase unwrapping [11] in every pixel in order to observe the temporal evolution of mechanical response. Also, we want the net effect of a defect mechanical response to the load. For that purpose, we take the difference between the phase value of a given pixel
(
xd,yd)
at a defect area and the phase value of a sound zone located in the neighborhood(
x ys, s)
. Similarly to the processing explained in thermography, we consider the averaging of phase on an N×N pixels area centered at the defect or sound location. We write(
)
(
(
)
(
)
)
² 1
, , = , , , ,
²
net d d corr d d corr s s
N
x y t x y t x y t
N
φ
φ
φ
∆
∑
∆ − ∆(3)
In order to be complete, we must remark that in shearography an instantaneous phase map shows the derivative of the displacement field in the direction of the optical shear. This has the consequence that local signature of abnormal displacement is observed as two lobes, symmetrically placed with respect to the actual center of defect. One of the lobes has a positive sign, and the other a negative one. In order to analyze the behavior of each defect (its maximum reaction to load, and temporal evolution of this reaction), we have considered two zones of interest: one on the positive lobe
(
x+d,y+d)
(shown in green in Fig 7(a)) and the other on the negative symmetric lobe(
x−d,y−d)
(shown in red). They have to correspond to the same true position of the defect which is at mid distance between both. The line passing through both(
x+d,y+d)
and(
x−d,y−d)
has to be parallel to the shearing direction, shown as the yellow arrow on the figure. Here the shearing direction is diagonal. The sound area(
x ys, s)
is the white circle. Since the sound surrounding area has been corrected by a polynomial fit, it is supposed to be almost flat, i.e. it has a constant null phase. Therefore, the choice of the sound area should not impact the result. Figure 7(b) shows the temporal evolution of phase (Eq(3)) for both the positive (green) and negative (red) lobes. We see that the temporal behavior has either a positive or a negative sign and that curves are globally symmetric with respect to the zero phase.Figure 7. Shearography. (a) Processed phase map with symmetric positions of defect area (green and red), sound area (white) and shear direction. (b) Net temporal evolution of the defect reaction (phase change related to displacement derivative)
5. COMPARISON BETWEEN SHEAROGRAPHY AND THERMOGRAPHY
TECHNIQUES FOR THE DIFFERENT ARTIFICIAL DEFECTS
Both thermography and shearography techniques have been used on the CFRP sample with three artificial defects. The different processing methods explained above have been applied in order to have a common comparison basis. Indeed we can now observe either the thermal contrast (in thermography) or the phase difference contrast (in shearography), in net amplitude and even their temporal evolution, which could provide interesting information. In the next subsections, we will present the results for each case of artificial defect. The zone of the object that has been observed is not the same for both techniques. In Figure 2(a), we have highlighted the observation zones of each of them. There is an overlap and we have selected preferentially defects which are in the overlap region.
5.1 Flat bottom holes
First we have considered the case of flat bottom-holes. Figure 8(a) shows a phase map where 3 defects are selected, corresponding to different depths. The red circles indicate the location of the studied zones, with both the positive and negative lobe for each defect. In the case of thermography, Figure 8(c), the center of defects is considered. In all cases, a sound area is taken in the direct neighborhood.
The temporal evolution of the phase contrast (in shearography, Figure 8(b)) or temperature contrast (in thermography, Figure 8(d)) can be analyzed.
Figure 8. Flat bottom hole defect type comparison. Positions of the defect of interest in shearography (a) and in thermography (c). Temporal evolution of the defect in shearography (b) and in thermography (d).
Figure 8(b) shows that the three defects have the same kind of signature with notable differences in amplitude depending on the depth of the defect: the shallowest defect has a higher contrast (blue curves) than the deepest one (red curves). The general behavior can be described as an increase of contrast during the heating until a plateau is reached and the contrast increase slows down, then a small time after the heating is needed before the contrast begins to weaken and tend to zero after a certain amount of time.
Figure 8(d) shows the same trend than the one in shearography: the shallower the defect is, the higher the temporal amplitude is. Note that color codes are inverted with respect to shearography (red curve is for shallower defect). The difference between defects depth is marked and the response can be easily correlated to the defect depth by comparing amplitude, increase and decrease slope which seem to be inversely proportional to the defect depth. We also note that the maximal contrast arrives later in the case of deeper defect than for shallow ones, which is obvious since the heat wave reach them later.
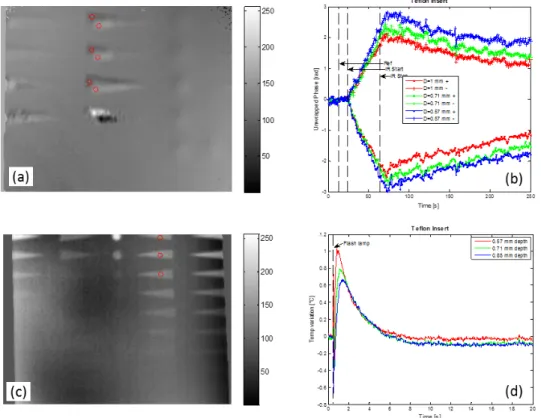
5.2 Teflon insert
We have performed the same kind of analysis on the teflon inserts. Figure 9(b) shows that the three defects have the same kind of signature with notable differences in amplitude depending on the depth of the defect: the shallowest defect have a higher contrast (blue curves) than the deepest one (red curves). The general behavior can be described as a constant increase of contrast during the heating, then a small time after the heating is needed before the contrast begins to weaken but it does not tend to zero for hundreds of second. This shows that the teflon stays deformed for a very long time after the heating stops. This mechanical reaction is quite different than the thermal one.
Figure 9(d) shows does not show the same trend than the one in shearography: the shallower the defect, the higher the contrast. However the cooling is rather fast, at least faster than the one with the flat bottom holes in Figure 8. The difference between defects depth is not as marked as the one with the flat bottom holes.
Figure 9. Teflon insert defect type comparison. Positions of the defect of interest in shearography (a) and in thermography (c). Temporal evolution of the defect in shearography (b) and in thermography (d).
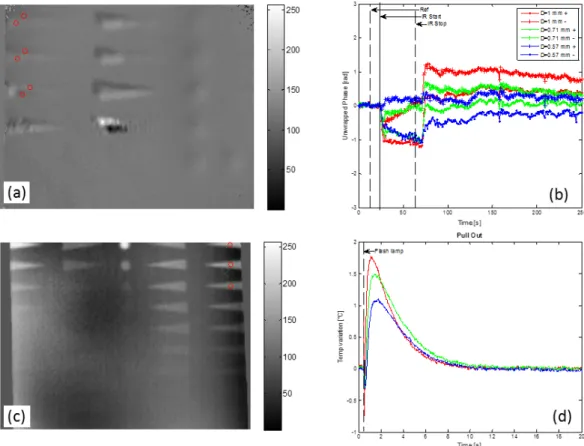
5.3 Pull-outs
The last case is the one of pull-outs. Figure 10 shows the same kind of analyses performed with other artificial defects. In shearography, Figure 10 (b) shows that the temporal evolution is similar to the one of flat-bottom holes, with a quick return to normal as soon as the heating stops. However we see here that the contrast is very poor and sometimes difficult to see. Moreover, for a specific defect, it can be seen that the positive and negative phase differences do not converge to zero. Instead they decrease to different asymptotic values. We also see that the phase variation during the heating is found negative for both lobes. This is not expected and shows that probably the post-processing described in section 4 should be improved. Indeed the signal to noise ratio is quite weak in the case of pull-outs. Also the selected pull-out are very close to the front surface, with only one CFRP layer. We can see that the fringe pattern on shallow defect is quite perturbed and is probably not smooth enough to allow this type of analysis. Further investigations are needed for these cases in the future.
In Figure 10(d), the difference between defects depth is not as marked as the one with the flat bottom holes at the temporal point of view. Here it seems that only amplitude can be used as a marker of depth.
Figure 10. Pull-outs defect type comparison. Positions of the defect of interest in shearography (a) and in thermography (c). Temporal evolution of the defect in shearography (b) and in thermography (d).
5.4 Discussion
All results presented above come from a single experiment in the integrated platform shown in Figure 4, and in parallel from one another. Therefore we can compare results in a reliable way. We can see that thermography provides and easier analysis because the temporal behavior of the surface temperature is monotonic. Contrast of thermal reaction at the defect can be easily observed, as well as the temporal trends. Comparison is relatively easy between different types of defects, and in function of depth for a given type. In shearography, such analyses are more difficult, especially for defects based on air gaps, like the pull-out and flat-bottom holes. Inclusion of teflon provides the strongest reaction, moreover which lasts for very long time after the heating has stopped, contrarily to air gaps where the reaction stops quickly. In the case of pull-outs, shearography does not deliver results of high quality and the post-processing should be improved.
Nevertheless, there is one thing that can be concluded here with high confidence: both thermography and shearography show obvious differences between the different artificial defect types, where UT C-scans do not show any. Also, thermography shows stronger contrast for air gaps than for teflon inserts, whereas shearography shows the reverse effect.
6. CONCLUSION
Shearography and thermography are both NDI techniques that can be used to detect defects in CRFP. In the latter, delamination (air gap) between layers of composites can constitute defect of major criticality which need to be detected
and characterized. In order to assess the performances of NDI techniques with respect to such delamination, reference composite structures with artificial defects are provided by aeronautical industries. These artificial defects certified for usual NDI techniques, such as ultrasound test (UT): they are made by teflon inserts, flat-bottom holes or pull-outs. They all show the same response when inspected through UT. Often the same reference structures are proposed to assess performances of other NDI techniques such as active thermography and shearography. However in these cases, one observes, respectively, the thermal or mechanical response to these artificial defects to a specific load (generally heating).
In this paper we have used such UT reference composite structure with typical thermography and shearography setup and standard test protocol. In a preliminary UT experiment, we have seen no differences between the 3 types of artificial defects. However we show that thermography and shearography give different responses between the different defects. Moreover the defects show a clear differentiated behavior between thermography and shearography. For example, the teflon inserts show a stronger deformation compared to air gap based defect (flat-bottom holes and pull-outs).
We have analyzed also the temporal evolution of the signals at the defect and observed that these can be used also to discriminate the different types of defects and could be used as identifier for defect type and depth. Further work and investigation will lead toward quantitative comparison of both the techniques.
The major conclusion of this paper is that it is difficult, even inappropriate, to use CFRP matrix with artificial defects (like those shown here) for assessing the capabilities of thermography or shearography to detect delamination in CFRP laminates. Such reference matrices should be kept for assessing the performances of UT NDI, for which they constitute a certified approach. For assessing the performances of thermography or shearography in detection of delamination, we recommend that new artificial defects approaches are used, dedicated specifically for these techniques.
7. ACKNOWLEDGEMENTS
These results have been obtained with financial support of Wallonia under the project TECCOMA (contract N° 7281) in the frame of SKYWIN competitiveness pole. Authors also acknowledge the financial support of cooperation project from Wallonie-Bruxelles International and Quebec Ministry of International Relations and Francophony.
REFERENCES
[1] Blitz, J. and Simpson, G., [Ultrasonic Methods for Non-Destructive Testing], Chapman & Hall (1992)
[2] Maldague, X., [Theory and Practice of Infrared Technology for Nondestructive Testing], Wiley-Interscience (2001).
[3] Jorge, I., Venegas, P., Vega, L., Lopez, I., Vollheim, B., Krausz, L., and Georges, M., "Review of thermal imaging systems in composite defect detection, " Infrared Physics & Technology 61, 167-175 (2013)
[4] Kreis, T., [Handbook of Holographic Interferometry: Optical and Digital Methods], Wiley-VCH Verlag GmbH | Co. KGaA, Weinheim (2005).
[5] Steinchen, W., Yang, L., [Digital Shearography: Theory and application of digital speckle pattern shearing interferometry], SPIE press (2003)
[6] Kalms, M., and Osten, W., "Mobile shearography system for the inspection of aircraft and automotive components," Opt. Eng. 42 (5), 1188- 1196 (2003)
[7] Georges, M. P., Vandenrijt, J.-F., Thizy, C., Alexeenko, I., Pedrini, G., Rochet, J., Vollheim, B., Lopez, I., Jorge, I., Rochet, J., and Osten, W., "Combined holography and thermography in a single sensor through image-plane holography at thermal infrared wavelengths," Opt. Exp. 22, 25517-25529 (2014)
[8] Georges, M.P., "Comparison between thermographic and holographic techniques for nondestructive testing of composites: similarities, differences and potential cross-fertilization," Proc. SPIE 9660, 966002 (2015)
[9] Georges, M.P., "Speckle interferometry in the long-wave infrared for combining holography and thermography in a single sensor. Applications to nondestructive testing: The FANTOM Project," Proc. SPIE 9525, 952557 (2015)
[10] Ghiglia, D., and. Pritt, M.D, [Two-Dimensional Phase Unwrapping: Theory, Algorithms, and Software ], Wiley, (1998)
[11] Huntley, J.M., and Saldner, H.O., "Temporal phase-unwrapping algorithm for automated interferogram analysis," Appl. Opt. 32, 3047–3052 (1993)