HAL Id: hal-01512986
https://hal.archives-ouvertes.fr/hal-01512986
Submitted on 24 Apr 2017
HAL is a multi-disciplinary open access
archive for the deposit and dissemination of
sci-entific research documents, whether they are
pub-lished or not. The documents may come from
teaching and research institutions in France or
abroad, or from public or private research centers.
L’archive ouverte pluridisciplinaire HAL, est
destinée au dépôt et à la diffusion de documents
scientifiques de niveau recherche, publiés ou non,
émanant des établissements d’enseignement et de
recherche français ou étrangers, des laboratoires
publics ou privés.
natural risk assessments
N. Saint Geours, T. Langer, Jean-Stéphane Bailly, F. Grelot
To cite this version:
N. Saint Geours, T. Langer, Jean-Stéphane Bailly, F. Grelot. Hazard-asset spatial overlays and induced
uncertainty in natural risk assessments. Accuracy 2014, Jul 2014, Lansing, MI, United States. pp.5.
�hal-01512986�
Hazard-asset spatial overlays
and induced uncertainty in natural risk assessments
Nathalie Saint-Geours
1,†; Thibaud Langer
1; Jean-Stéphane Bailly
1,2; Frédéric
Grelot
31 Irstea, UMR TETIS, 500 rue J.F. Breton BP 5095, F-34196 Montpellier, France 2 AgroParisTech, UMR LISAH, 2 place Pierre Viala, F-34060 Montpellier, France 3 Irstea, UMR G-EAU, 361 rue J.F. Breton BP 5095, F-34196 Montpellier, France † saintge@teledetection.fr
Abstract
We investigate how hazard spatial datasets and land use spatial datasets can be overlaid in natural risk assessments. Based on a case-study of a flood damage assessment on the Orb River, France, we show that the variability of spatial overlay techniques may result in significant uncertainty in natural risk assessments.
Keywords
: Uncertainty, Spatial overlay, Spatial support, Natural hazard, GIS.1. Introduction
From typhoons to droughts, natural disasters impacted the lives of millions of people around the world in 2013. In order to prepare our societies to face such extreme events, public authorities carry out quantitative assessments of natural risks. At local scale, a crucial step in such risk assessment studies is the overlaying of an hazard map, which describes the intensity of the natural phenomena in terms of quantitative physical parameters (e.g., water level for floods, seismic intensity for earthquakes, or wind speed for storms) and an assets map, which locates the various hazard-exposed assets in the study area (e.g., houses, plots of cultivated land, factories). We call this operation the
hazard-asset spatial overlay (HASO). The goal of HASO is to determine the intensity
of the natural hazard over each hazard-exposed asset. HASO is usually performed using a GIS software.
Meanwhile, there is a growing consensus that quantitative assessments of natural risks are fraught with uncertainties, which arise from inaccurate or missing data, model assumptions, measurement errors, or incomplete knowledge. Uncertainty analysis (UA) is thus required to assess the impacts of these uncertainties in the modelling chain: over the last decade, various UA methods have been used in natural risk studies, for example in flood damage assessment research (Apel et al. 2004).
Nevertheless, up to our knowledge, these UA studies have constantly overlooked one possible source of uncertainty: the HASO operation itself. Indeed, depending on the nature of the spatial datasets that are available, various techniques can be considered to perform the HASO spatial overlay analysis. For example, Saint-Geours et al. (2013) use polygonal objects extracted from agricultural census to describe flood-exposed plots of cultivated land, while they use points based on postal data to describe other hazard-exposed economic activities: the same HASO procedure cannot be applied to
these two different spatial datasets. Up to our knowledge, this source of uncertainty has never been carefully discussed in any natural risk assessment.
Our paper is an attempt in this direction. We try to answer the following question: how much can the outputs of a natural risk assessment vary depending on the HASO technique used? Is this variability important with respect to other sources of uncertainty in natural risk assessments? To narrow the scope of our work, we focus on a single case-study, which investigates flood damage estimates on the Orb Delta, France.
2. Materials and methods
2.1. Study area and data
As a case-study, we focus on a flood damage estimation for the one-hundred-year flood in the Orb Delta, south of France. The Orb Delta is a catchment of 63 sq. km, surrounding a 15 km reach of the Lower Orb River from Béziers city to the Mediterrean sea. In December 1995, a severe flooding event caused around 53 M€ in material losses
(Saint-Geours, 2012).
Available data on the area include both a hazard map and an assets map. The hazard map is a grid (raster data) with 5-m pixel size that gives spatially explicit maximum water levels over the Orb Delta for the one-hundred-year flood event. It was derived from a flow simulation performed using a hydraulic flow model. The assets map is a vector GIS layer at the 1:5000 scale that describes each flood-exposed asset with an individual polygonal feature. Four types of assets are considered: private housing units, plots of cultivated land, campgrounds, and other economic activities.
2.2. Data pre-processing
In order to explore the variety of possible HASO techniques, we first replicated the hazard map and the assets map to have them available with different spatial supports: either pixel-support (raster data), point support (vector data), or polygonal support (vector data). The hazard map was initially available as raster data; it was transformed to point-support and polygonal-support vector data by means of spatial interpolation. The assets map was initially a polygonal-support vector data: a point-support counterpart was created by extracting the centroid of each polygonal feature.
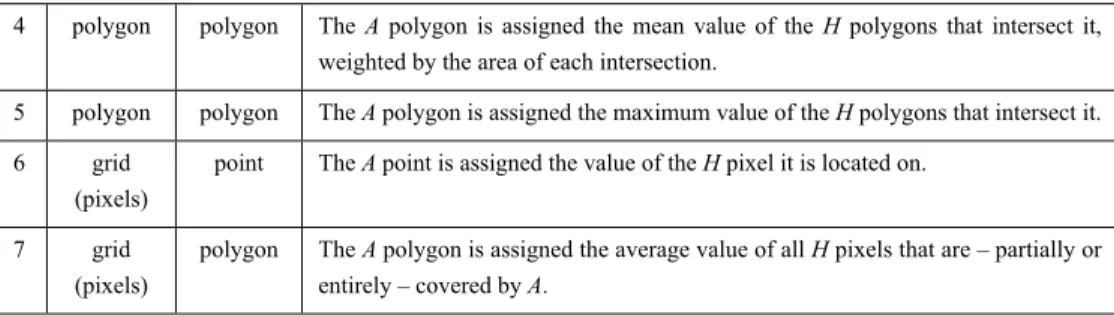
We listed seven techniques that can be considered to perform HASO for flood exposure assessment. All these techniques aim at computing hazard intensity characteristics (here, flood water level) for each hazard-exposed asset (Fig. 1). We classify HASO techniques along two dimensions: i) the spatial support of the hazard data (pixel, point or polygonal), and ii) the spatial support of the assets (point or polygonal). Fig. 2 and Table 1 give a brief description of these techniques.
Figure 1: The HASO operation aims at assigning each hazard-exposed asset with hazard
intensity characteristics (here, a water level).
Figure 2: Illustration of the seven different HASO techniques described in Table 1. Table 1: Possible HASO techniques depending on the spatial support of the hazard map (H) and
the spatial support of the assets map (A).
n° Hazard H Asset A Description
1 point point The A point is assigned the value of the closest H point.
2 polygon point The A point is assigned the value of the H polygon that contains it.
3 polygon polygon The A polygon is split into a number of sub-assets a, by intersection with the H polygons. Each new sub-asset a is assigned the value of the H polygon that contains it.
4 polygon polygon The A polygon is assigned the mean value of the H polygons that intersect it, weighted by the area of each intersection.
5 polygon polygon The A polygon is assigned the maximum value of the H polygons that intersect it. 6 grid
(pixels)
point The A point is assigned the value of the H pixel it is located on.
7 grid (pixels)
polygon The A polygon is assigned the average value of all H pixels that are – partially or entirely – covered by A.
2.4. Flood damage estimation
Flood damage costs for the one-hundred-year flood were finally computed for each flood-exposed asset from flood exposure data, using a set of so-called damage curves, which model the relation between water levels, assets characteristics (type, surface area, value, ground floor elevation) and direct monetary losses (Saint-Geours et al., 2013).1
3. Results and discussion
3.1. Uncertainty in flood damage estimates
Table 1 shows the total flood damages over the Orb Delta for each HASO technique, ranging from 161 M€ to 194 M€. It indicates that the uncertainty in total damage costs induced by the variety of the HASO techniques is close to 10%.
Table 1: Total flood damages for different HASO techniques. HASO technique Flood damages [M€]
1 182 2 186 3 173 4 161 5 194 6 179 7 171 3.2. Discussion
On this specific case-study, we find that relative differences in flood damage estimates can rise up to 10%, depending on the HASO technique that is selected. This result should be compared to previous works that have assessed the influence of other sources of uncertainty in flood damage assessments. Moel and Aerts (2011), for
1 These damage functions are either built from statistical analysis of ex-post data
collected after flood events or by a synthetic approach where the elementary effects of flood on the various components of the asset are modelled (e.g., damage on furniture, walls and doors of a house)
example, showed that the uncertainty in damage curves could lead to changes in flood damage estimates of a factor 4. They also investigated the influence of input uncertainties in the inundation depth, and the choice of a landuse map, and showed that the resulting variability of flood damage estimates could reach a factor 1.2. Hence, our first results clearly suggest that the uncertainty associated to the HASO operation is not negligible in flood damage assessments, as it leads to an output uncertainty whose order of magnitude is similar to that induced by other sources of uncertainty.
4. Conclusion
We investigated the impact of the hazard-asset spatial overlay (HASO) techniques in natural risk assessments. We classified existing HASO techniques depending on the spatial support of both the hazard spatial dataset and the assets spatial datasets. From a detailed case study on flood damage estimation on the Orb Delta, France, we found that relative differences in flood damage estimates can rise up to 10%, depending on the HASO technique that was selected.
References
Apel, H.; Thieken, A. H.; Merz, B. and Blöschl, G. (2004), Flood risk assessment and associated
uncertainty. Nat. Hazards Earth Syst. Sci., 4, 295-308.
de Moel, H. & Aerts, J. C. J. H. (2011) Effect of uncertainty in land use, damage models and
inundation depth on flood damage estimates. Nat. Hazards, 58, 407-425.
Langer, T. (2011), Mise en place d’outils pour l’analyse coût bénéfice d’aménagements de
prévention du risque d’inondation : croisement aléa, enjeux et incertitudes. Master thesis,
Université de Toulouse, Master 2 SIGMA, France.
Saint-Geours, N. (2012), Sensitivity analysis of spatial models: application to cost-benefit
analysis of flood risk management plans. PhD thesis, Université Montpellier II and Irstea,
France.
Saint-Geours, N., Lavergne, C., Bailly, J.-S. and Grelot, F. (2013), “Ranking sources of uncertainty in flood damage modelling: a case study on the cost-benefit analysis of a flood mitigation project in the Orb Delta”. Journal of Flood Risk Management, online first.