HAL Id: hal-00303924
https://hal.archives-ouvertes.fr/hal-00303924
Submitted on 28 Jun 2005HAL is a multi-disciplinary open access
archive for the deposit and dissemination of sci-entific research documents, whether they are pub-lished or not. The documents may come from teaching and research institutions in France or abroad, or from public or private research centers.
L’archive ouverte pluridisciplinaire HAL, est destinée au dépôt et à la diffusion de documents scientifiques de niveau recherche, publiés ou non, émanant des établissements d’enseignement et de recherche français ou étrangers, des laboratoires publics ou privés.
Characterization of ambient aerosols in Mexico City
during the MCMA-2003 campaign with Aerosol Mass
Spectrometry ? Part I: quantification, shape-related
collection efficiency, and comparison with collocated
instruments
D. Salcedo, K. Dzepina, T. B. Onasch, M. R. Canagaratna, Q. Zhang, A. Rr.
Huffman, P. F. Decarlo, J. T. Jayne, P. Mortimer, D. R. Worsnop, et al.
To cite this version:
D. Salcedo, K. Dzepina, T. B. Onasch, M. R. Canagaratna, Q. Zhang, et al.. Characterization of ambient aerosols in Mexico City during the MCMA-2003 campaign with Aerosol Mass Spectrometry ? Part I: quantification, shape-related collection efficiency, and comparison with collocated instruments. Atmospheric Chemistry and Physics Discussions, European Geosciences Union, 2005, 5 (3), pp.4143-4182. �hal-00303924�
ACPD
5, 4143–4182, 2005
Mexico City aerosol during MCMA-2003 using an AMS – Part I D. Salcedo et al. Title Page Abstract Introduction Conclusions References Tables Figures J I J I Back Close Full Screen / Esc
Print Version Interactive Discussion
Atmos. Chem. Phys. Discuss., 5, 4143–4182, 2005 www.atmos-chem-phys.org/acpd/5/4143/
SRef-ID: 1680-7375/acpd/2005-5-4143 European Geosciences Union
Atmospheric Chemistry and Physics Discussions
Characterization of ambient aerosols in
Mexico City during the MCMA-2003
campaign with Aerosol Mass
Spectrometry – Part I: quantification,
shape-related collection e
fficiency, and
comparison with collocated instruments
D. Salcedo1,2, K. Dzepina2,3, T. B. Onasch4, M. R. Canagaratna4, Q. Zhang2, J. A. Huffman2,3, P. F. DeCarlo2,5, J. T. Jayne4, P. Mortimer4,*, D. R. Worsnop4, C. E. Kolb4, K. S. Johnson6, B. Zuberi6,**, L. C. Marr6,***, L. T. Molina6,
M. J. Molina6, R. M. Bernab ´e7, B. Cardenas7, C. M ´arquez7, J. S. Gaffney8, N. A. Marley8, A. Laskin9, V. Shutthanandan9, and J. L. Jimenez2,3
1
Centro de Investigaciones Qu´ımicas, Universidad Aut´onoma del Estado de Morelos, Cuernavaca, Morelos, Mexico
2
Cooperative Institute for Research in the Environmental Sciences (CIRES), University of Colorado at Boulder, Boulder, CO, USA
3
Department of Chemistry and Biochemistry, University of Colorado at Boulder, Boulder, CO, USA
ACPD
5, 4143–4182, 2005
Mexico City aerosol during MCMA-2003 using an AMS – Part I D. Salcedo et al. Title Page Abstract Introduction Conclusions References Tables Figures J I J I Back Close Full Screen / Esc
Print Version Interactive Discussion
EGU
4
Center for Aerosol and Cloud Chemistry, Aerodyne Research Inc., Billerica, MA, USA
5
Program in Atmospheric and Oceanic Sciences, University of Colorado at Boulder, Boulder, CO, USA
6
Department of Earth, Atmospheric and Planetary Sciences and Department of Chemistry, Massachusetts Institute of Technology, Cambridge, MA, USA
7
Centro Nacional de Investigaci ´on Capacitaci ´on Ambiental, Instituto Nacional de Ecolog´ıa, M ´exico D.F., Mexico
8
Argonne National Laboratory, Argonne, IL, USA
9
William R. Wiley Environmental Molecular Sciences Laboratory, Pacific Northwest National Laboratory, Richland, WA, USA
∗ now at: John Hopkins University, Baltimore, MD, USA ∗∗ now at: GEO2 Technologies, Woburn, MA, USA
∗ ∗ ∗ now at: Department of Civil and Environmental Engineering, Virginia Polytechnic Institute and State University, Blacksburg, VA, USA
Received: 2 May 2005 – Accepted: 10 May 2005 – Published: 28 June 2005 Correspondence to: J. L. Jimenez ([email protected])
ACPD
5, 4143–4182, 2005
Mexico City aerosol during MCMA-2003 using an AMS – Part I D. Salcedo et al. Title Page Abstract Introduction Conclusions References Tables Figures J I J I Back Close Full Screen / Esc
Print Version Interactive Discussion
Abstract
An Aerodyne Aerosol Mass Spectrometer (AMS) was deployed at the CENICA Super-site, while another was deployed in the Aerodyne Mobile Laboratory (AML) during the Mexico City Metropolitan Area field study (MCMA-2003) from 31 March–4 May 2003 to investigate particle concentrations, sources, and processes. This is the first of a series 5
of papers reporting the AMS results from this campaign. The AMS provides real time information on mass concentration and composition of the non-refractory species in particulate matter less than 1 µm (NR-PM1) with high time and size-resolution. For the first time, we report field results from a beam width probe, which was used to study the shape and mixing state of the particles and to quantify potential losses of irregular 10
particles due to beam broadening inside the AMS. Data from this probe show that no significant amount of irregular particles was lost due to excessive beam broadening. A comparison of the CENICA and AML AMSs measurements is presented, being the first published intercomparison between two quadrupole AMSs. The speciation, and mass concentrations reported by the two AMSs compared relatively well. The di ffer-15
ences found are likely due to the different inlets used in both instruments. In order to account for the refractory material in the aerosol, we also present measurements of Black Carbon (BC) using an aethalometer and an estimate of the aerosol soil com-ponent obtained from Proton-Induced X-ray Emission Spectrometry (PIXE) analysis of impactor substrates. Comparisons of AMS+ BC + soil mass concentration with other 20
collocated particle instruments (a LASAIR Optical Particle Counter, a Tapered Element Oscillating Microbalance (TEOM) and a DustTrak Aerosol Monitor) are also presented. The comparisons show that the AMS+ BC + soil mass concentration during MCMA-2003 is a good approximation to the total PM2.5mass concentration.
ACPD
5, 4143–4182, 2005
Mexico City aerosol during MCMA-2003 using an AMS – Part I D. Salcedo et al. Title Page Abstract Introduction Conclusions References Tables Figures J I J I Back Close Full Screen / Esc
Print Version Interactive Discussion
EGU
1. Introduction
The Mexico City Metropolitan Area field experiment (MCMA-2003) was an intensive 5-week campaign that took place in the spring of 2003 (31 March–4 May), with the goal of investigating the atmospheric chemistry of the MCMA, with particular focus on emissions quantification, gas-phase photochemistry, and secondary particulate matter 5
formation. A focal point of the campaign was a highly instrumented “Supersite” lo-cated at the “Centro Nacional de Investigaci ´on y Capacitaci ´on Ambiental” (CENICA), in the south east of Mexico City. CENICA is located in the campus of the Universidad Aut ´onoma Metropolitana-Itzapalapa (UAM-I), approximately 10 km southeast of the city center, and within a medium income residential and commercial area. The main local 10
sources of pollutants are traffic and some small industries.
During the MCMA-campaign, we deployed an Aerodyne Quadrupole Aerosol Mass Spectrometer (Q-AMS) at CENICA. The AMS reports concentrations of non-refractory species in particles smaller than about 1 µm (NR-PM1) with high time and size-resolution (Jayne et al., 2000; Jimenez et al., 2003a). A second AMS was operated 15
inside the Aerodyne Mobile Laboratory (AML) that was also operated at CENICA when not in use for emissions monitoring or as a fixed site at other locations within the city (Kolb et al., 2004). In this paper we describe the AMSs’ operation and calibration, and the first field measurement of the shape-related collection efficiency of the AMS. Also for the first time, we show an intercomparison between two collocated Q-AMSs. Finally, 20
we report on intercomparisons between the AMSs and other collocated particle instru-ments deployed at CENICA (a LASAIR Optical Particle Counter, a Tapered Element Oscillating Microbalance (TEOM) and a DustTrak Aerosol Monitor). Since the AMS does not measure non-refractory aerosol components, we explicitly included in the to-tal mass comparisons Black Carbon (BC) measurements provided by an aethalometer 25
operated by the Argonne National Laboratory, and an estimation of the aerosol soil component from Proton-Induced X-ray Emission Spectrometry (PIXE) analysis of im-pactor substrates obtained by the Pacific Northwest National Laboratory (PNNL) and
ACPD
5, 4143–4182, 2005
Mexico City aerosol during MCMA-2003 using an AMS – Part I D. Salcedo et al. Title Page Abstract Introduction Conclusions References Tables Figures J I J I Back Close Full Screen / Esc
Print Version Interactive Discussion
the Massachusetts Institute of Technology (MIT). In the companion paper (Part II), we will discuss in detail the main characteristics of the time evolution of the concentration, composition, and size distribution of the NR-PM1measured with the AMS at CENICA.
2. Experimental
2.1. Aerodyne Aerosol Mass Spectrometer (AMS) 5
The AMS has been described in detail previously (Jayne et al., 2000; Jimenez et al., 2003a) so only a brief description will be given here. The AMS instrument consists of three main parts: an aerosol inlet, a particle sizing chamber, and a particle detection section. Particles are sampled from ambient pressure into ∼1.5 Torr, and are focused using an aerodynamic lens into a narrow beam of ∼100 µm diameter (Heberlein et al., 10
2001). The aerodynamic lens allows near unity transmission for particles in the size range of 60 nm to 600 nm, and partial transmission down to ∼30 nm and up to ∼1.5 µm. In the expansion at the exit of the lens into the high vacuum chamber the particles ac-quire a size-dependent velocity. The beam then passes through a spinning chopper wheel in the particle sizing chamber, where vacuum aerodynamic diameter (dv a) of 15
the particles (Jimenez et al., 2003b; Jimenez et al., 2003c; DeCarlo et al., 2004) is determined by measuring the time it takes a particle to reach the detector ( particle time-of-flight or P-ToF). In the detector the particle beam impacts on a heated surface (∼600◦C) under high vacuum (∼10−7Torr), leading to flash vaporization of the “non-refractory” (NR) particle species. NR is defined operationally to include all species that 20
evaporate in a few seconds under these conditions. In practice NR includes species such as ammonium sulfate and sodium nitrate, and excludes black carbon, crustal materials, and sea salt/sodium chloride. Non-refractory species internally mixed with refractory species (e.g. organics internally mixed with black carbon) can be quantita-tively detected with the AMS (Katrib et al., 2005; Slowik et al., 2004). The NR particle 25
ACPD
5, 4143–4182, 2005
Mexico City aerosol during MCMA-2003 using an AMS – Part I D. Salcedo et al. Title Page Abstract Introduction Conclusions References Tables Figures J I J I Back Close Full Screen / Esc
Print Version Interactive Discussion
EGU
(EI) ionization, which forms positive ions that are analyzed with a quadrupole mass spectrometer. The signal is linear with particle mass of a given species and detection limits below 1 µg m−3 are typically achieved for all species (see Sect. 2.4.1).
During the MCMA campaign, a recently developed beam width probe (BWP) was used with the AMS to provide a continuous measurement of surrogate particle mor-5
phology (non-sphericity) and to allow the estimation of the potentially reduced particle collection efficiency due to particle shape. The design of the probe and the techniques for analysis and interpretation of its data have been extensively discussed elsewhere (Jayne et al., 2000; Huffman et al., 20051). The probe used in this study consisted of a 0.41 mm diameter wire, which was moved intermittently to a fixed position blocking 10
part of the particle beam near the AMS vaporizer in order to determine the attenuation of the signal vs. wire position. The BWP was alternated between the “out” position (not blocking any part of the vaporizer) and one of the seven partially blocking positions in front of the 3.81 mm diameter vaporizer. One of the seven blocking positions cov-ered the center of the vaporizer and six were symmetrically located around the center 15
to each side, with partial vaporizer blocking. The probe was operated in two-minute intervals, with a total cycling time (loop through the entire round of positions) of 28 min. 2.2. CENICA AMS operation
The AMS was located inside a hut built on the roof of the 12 m tall building that houses CENICA. Ambient air was sampled at a flow rate of 9 lpm through a PM2.5 cyclone 20
(URG-2000-30EN, URG, Chapel Hill, NC) located 2.3 m above the roof of the hut and drawn into a 9.525 mm (3/8 inch) copper tubing to within 15 cm of the AMS inlet, where 8.9 lpm were exhausted by a vacuum pump and ∼0.1 lpm was sampled into the AMS from the center of the 9.525 mm line. The total length of the inlet line was 5.3 m.
1
Huffman, J. A., Jayne, J. T., Drewnick, F., Aiken, A. C., Onasch, T., Worsnop, D. R., and Jimenez, J. L.: Design, Modeling, Optimization, and Experimental Tests of a Particle Beam Width Probe for the Aerodyne Aerosol Mass Spectrometer, Aerosol Sci. Technol., submitted, 2005.
ACPD
5, 4143–4182, 2005
Mexico City aerosol during MCMA-2003 using an AMS – Part I D. Salcedo et al. Title Page Abstract Introduction Conclusions References Tables Figures J I J I Back Close Full Screen / Esc
Print Version Interactive Discussion
Maximum particle losses due to diffusion and bends in the line were calculated (Baron and Willeke, 2001) to be 6.5% for 30 nm particles and 0.7% for 1 µm particles.
The ions chosen and the main species monitored with the AMS P-ToF mode during this campaign were: m/z 16 for ammonium (NH+2); m/z 18 for water (H2O+); m/z 28 for the airbeam (N+2); m/z 30 and 46 for nitrate (NO+, NO+2); m/z 36 for chloride 5
(HCl+); m/z 48 and 64 for sulfate (SO+, SO+2); m/z 43, 44, 55, 57, 67, 77, and 141 for organic species; and m/z202 and 226 for polycyclic aromatic hydrocarbons (PAHs).
The various BWP blocked positions and the unblocked position were alternated every two minutes. This produced a 4-min, 50% duty cycle dataset without the BWP that is used to derive particle concentrations in this paper. The combination of this unblocked 10
dataset with the other interleaved, 4-min, 50% duty cycle of BWP data for the seven blocked positions is analyzed in Sect. 3.1 to determine the shape-related collection efficiency (see Sect. 2.4 for its definition).
All mass concentrations presented in this paper for all instruments are at ambient temperature and pressure conditions (local pressure is approximately 76 kPa). Local 15
Standard Time in Mexico City normally corresponds to Central Standard Time (CST) or Coordinated Universal Time (UTC) minus 6 h. On 6 April 2003 at 02:00 a.m. the Daylight Savings Time period started in Mexico; after that, local time corresponded to Central Daylight Saving Time (CDT) or UTC minus 5 h. All data in this paper is reported in Local Time, i.e. CST before 6 April and CDT after 6 April.
20
2.3. Mobile Laboratory AMS operation
A second AMS, also equipped with a BWP, was operated on-board of the Aerodyne Mobile Laboratory (Kolb et al., 2004). The AML was stationed at CENICA while not in use for “vehicle chase” experiments (Canagaratna et al., 2004), vehicle fleet emissions measurements, ambient pollutant mapping activities, or as a high time resolution fixed 25
site in other locations across Mexico City (Kolb et al., 2004). The design and operation of both AMSs was the same, with the exception of the use of a smaller critical orifice for sampling from ambient pressure in the AML AMS (100 µm in the AML AMS vs 120 µm
ACPD
5, 4143–4182, 2005
Mexico City aerosol during MCMA-2003 using an AMS – Part I D. Salcedo et al. Title Page Abstract Introduction Conclusions References Tables Figures J I J I Back Close Full Screen / Esc
Print Version Interactive Discussion
EGU
in the CENICA AMS). The smaller AML AMS orifice was selected to favor the trans-mission of smaller particles expected for fresh vehicle exhaust in the AML AMS during vehicle chase experiments since it is known that the window of particle sizes transmit-ted shifts to slightly smaller sizes as the lens operating pressure decreases (Zhang et al., 2004b). This led to slightly different particle transmission functions between the two 5
AMSs.
2.4. AMS quality control and calibrations 2.4.1. AMS ionization efficiency calibration
The ionization efficiency (IE) of both AMSs was calibrated every few days with dry monodisperse NH4NO3particles with the procedure described previously (Jimenez et 10
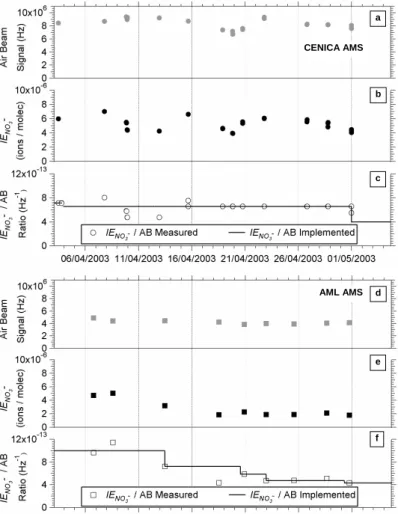
al., 2003a; Zhang et al., 2005b). Figure 1 shows the results of all IE calibrations for the CENICA and AML AMSs during the campaign.
Panels (a) and (d) of Fig. 1 show the airbeam signal (m/z 28 signal from gas phase nitrogen, N2, sampled from ambient air) for the two AMSs. Fluctuations in the airbeam signal reflect changes in atmospheric pressure (the changes are minor for typical syn-15
optic weather patterns, but significant for altitude changes) and the fundamental sensi-tivity of the AMS ionization and mass analysis techniques. The sensisensi-tivity of the AMS can change due to changes in the electron multiplier gain, significant changes in inlet alignment, changes in the sampling orifice, and, most importantly, changes in the ion-ization, extraction, and detection efficiencies. The airbeams shown in Fig. 1 indicate 20
an absolute change of less than 20% for either AMS over the whole campaign.
The ionization efficiency calibrations of the AMSs are shown in panels (b) and (e) of Fig. 1 and represent the ratio of the number of ions measured at m/z 30 and 46 for the NO+ and NO+2 fragments of NH4NO3to the total number of NH4NO3molecules in a monodisperse aerosol sampled by the AMS. Thus, this calibration includes the ion 25
detection sensitivities inherent in the airbeam measurement plus the additional sensi-tivities to vaporization, and ionization of particle chemical components. The accuracy
ACPD
5, 4143–4182, 2005
Mexico City aerosol during MCMA-2003 using an AMS – Part I D. Salcedo et al. Title Page Abstract Introduction Conclusions References Tables Figures J I J I Back Close Full Screen / Esc
Print Version Interactive Discussion
of the AMS measurements during MCMA-2003 was partially limited by our ability to calibrate the ionization efficiencies. The efficiency with which various chemical species ionize in the AMS is calculated by multiplying the calibrated nitrate IE values by the appropriate relative ionization efficiencies (RIE) factors. The MCMA data was ana-lyzed using previously published RIEs of 1.2 for sulfate, 1.1 for nitrate, 1.4 for organics 5
and 1.3 for chloride (Jimenez et al., 2003a; Alfarra et al., 2004). The NH4NO3IE cali-bration allows for the direct determination of the ammonium RIE. The ammonium RIE measured for the CENICA the AML AMSs were 3.8–6.2 and 4.5, respectively.
The IE calibration results shown in Fig. 1 for both of the instruments exhibit more scatter than the airbeam measurements. This scatter represents the uncertainty inher-10
ent in accurately generating and sampling a known number of molecules of ammonium nitrate in aerosol form. The two AMS instruments were typically calibrated with oper-ators from both instruments and the aerosol generation system was shared between the two groups. During the study, a new IE calibration procedure was adopted after 13 April, which relied on sampling polystyrene latex spheres (PSLs) to provide a more 15
accurate size measurement for the subsequently sampled monodisperse ammonium nitrate aerosol. The IE calibrations were reasonably constant for the CENICA AMS, but exhibited a significant decrease with time for the AML AMS. The CENICA AMS was stationary during the duration of the study, whereas the AML AMS was operated on the roads in chase mode during most days of the study and was stationary during 20
nights and several specific time periods at remote locations around the Mexico City Metropolitan Area. The decrease in the AML AMS IE is most likely due to an inlet alignment change caused by abrupt motions experienced by the AMS during on-road operations.
The true calibration of the AMS for quantitative particle chemical composition is de-25
termined by the ratio of the IE/AB values. The IE/AB ratio for both instruments is shown in panels (c) and (f) of Fig. 1. The symbols show the measured values and the solid line shows the IE/AB calibration values used to correct the mass loading data. The IE/AB reference values for the CENICA AMS were nearly constant, especially after the new
ACPD
5, 4143–4182, 2005
Mexico City aerosol during MCMA-2003 using an AMS – Part I D. Salcedo et al. Title Page Abstract Introduction Conclusions References Tables Figures J I J I Back Close Full Screen / Esc
Print Version Interactive Discussion
EGU
calibration procedure was adopted, and a constant value of 6.57×10⁻¹³was chosen to correct the complete data set, except for the final three days. During the final few days of the study, the CENICA AMS experienced a malfunction of an internal component whose replacement required the instrument losing vacuum. Due to time and personnel constraints, an IE/AB calibration was not performed on this instrument after the fail-5
ure. Given the good agreement between both AMSs for the rest of the campaign, the IE/AB value used for this period for the CENICA AMS was chosen by comparison with co-located AML AMS data, which suggested the apparent change in the IE/AB value for this period. In contrast, IE/AB values for the AML AMS show a strong decrease during the first half of the study and only settle out during the second half of the study, 10
following the same pattern observed in the individual IE measurements.
The detection limits (DLs) from individual species were determined by analyzing periods in which ambient filtered air was sampled and are reported as three times the standard deviation (3σ) of the reported mass concentration during those periods. DLs during this campaign for the CENICA based AMS were 0.01, 0.09, 0.11, 0.41 15
and 0.04 µg m−3 for nitrate, sulfate, ammonium, organics and chloride respectively for a 10 min. averaging time. The DLs for the Mobile Laboratory based AMS were 0.04, 0.06, 0.2, 0.8 and 0.04 µg m−3 for nitrate, sulfate, ammonium, organics and chloride respectively for a 10 min. averaging time. These DLs are similar between the two instruments and close to those reported for previous AMS campaigns (Zhang et al., 20
2005b).
2.4.2. Analysis of Potential Interferences in the AMS Measurements
The quadrupole AMS (Q-AMS) used in this study operates with unit m/z resolution. Since multiple ions can produce signals at the same integer m/z, there is no direct way to separate their contributions based on Q-AMS data. E.g. NO+, CH2O+, and/or 25
C2H+6 can produce signals at m/z 30 and these signals are indistinguishable when recorded. Allan et al. (2004b) have developed a linear deconvolution procedure to
ap-ACPD
5, 4143–4182, 2005
Mexico City aerosol during MCMA-2003 using an AMS – Part I D. Salcedo et al. Title Page Abstract Introduction Conclusions References Tables Figures J I J I Back Close Full Screen / Esc
Print Version Interactive Discussion
portion the signals recorded at each integer m/z of the Q-AMS into species-specific spectra based on observed fragmentation patterns in laboratory and calibration exper-iments, and on element isotopic ratios. This algorithm has been implemented in the standard AMS analysis software used for the analyses presented here. However it is still possible that some interferences may remain if they do not fit the patterns assumed 5
in the “fragmentation tables” that are used with the algorithm. Jimenez et al. (2003a) introduced a procedure to check for such interferences by examining the correlation between the time series and the size distributions of several ion fragments attributed to the same inorganic species. Since an interfering species will likely not be corre-lated in time with a given inorganic species, owing to likely differences in sources and 10
formation processes, deviations in the correlation of the different fragments can be in-dicative of remaining unsubtracted interferences. Conversely, the lack of deviations in these correlation plots is a necessary, although not sufficient condition for lack of major interferences. Figure 2 shows the correlation between the time series of the main ion fragments used to calculate the mass concentration of the inorganic species during the 15
MCMA-2003 study. Note that the AMS concentration of a given species is obtained by summing the individual concentrations of the ions it produces (Jimenez et al., 2003a). The mass concentrations of individual ions, such as nitrate at m/z 30, are an interme-diate step in the calculation of the species mass concentrations and are proportional to the ion signals, but do not have a direct physical meaning in terms of “concentration 20
of a fragment” in ambient air. Although there is significant scatter in the time series plots, likely owing to limited-signal to noise of the individual measurements, there is no clear sign of significant deviations from linearity. This indicates that unsubtracted interferences from organic fragments in the retrieved concentrations of the inorganic species are small during this campaign. A small exception may be the small deviations 25
in the correlation between the nitrate fragments in the different periods, which may be due to the presence of small concentrations of organic nitrates.
ACPD
5, 4143–4182, 2005
Mexico City aerosol during MCMA-2003 using an AMS – Part I D. Salcedo et al. Title Page Abstract Introduction Conclusions References Tables Figures J I J I Back Close Full Screen / Esc
Print Version Interactive Discussion
EGU
2.4.3. Calculation of the AMS mass concentration
In previous studies using the AMS (Allan et al., 2004a; Drewnick et al., 2004a; Hogrefe et al., 2004; Zhang et al., 2005b), it has been observed that there is a systematic (but generally highly reproducible) underestimation of the mass concentration of aerosols measured with the AMS when compared to other quantitative aerosol measurements 5
such a the Particle Into Liquid Sampler (PILS). In these studies, the underestimation in mass concentration observed with the AMS indicates AMS Collection Efficiencies (CE) ranging from 0.43 to 1.
Huffman et al. (20051) have recently defined the observed AMS collection efficiency in terms of three terms: CE=EL∗ Es∗ Eb. The ELterm accounts for the portion of PM2.5 10
that is not transmitted into the AMS due to the approximate PM1size cut (Jayne et al., 2000; Zhang et al., 2005b) of the aerodynamic lens in the AMS. The latter two terms account for possible effects that cause the PM1 particles that are introduced into the instrument and get through the aerodynamic lens to still not be detected by the mass spectrometer. The shape-related collection efficiency (Es) could be less than one for 15
nonspherical particles because the efficiency with which they are focused by the lens is reduced (Jayne et al., 2000; Huffman et al., 20051) and this in turn could potentially cause irregular particles to “miss” the AMS vaporizer. The bounce-related collection efficiency (Eb) could be smaller than one if dry less-volatile particles such as those with a high proportion of (NH4)2SO4, bounce after impacting the AMS vaporizer, instead of 20
evaporating. Previously, the latter two effects (and sometimes all three effects) had been included in one collection efficiency (CE=Es∗ Eb) (Alfarra et al., 2004; Drewnick et al., 2004b; Zhang et al., 2005b).
The newly developed beam width probe (BWP) that was operated in this campaign allowed for the first direct measurements of Es in the field. In Sect. 3.1, we show that 25
Es∼1 during this field campaign. Ebis more difficult to determine because it likely de-pends on particle phase (liquid vs. solid), water content, and particle composition. Par-ticles with significant ammonium sulfate content appear to bounce with Eb∼0.5 when
ACPD
5, 4143–4182, 2005
Mexico City aerosol during MCMA-2003 using an AMS – Part I D. Salcedo et al. Title Page Abstract Introduction Conclusions References Tables Figures J I J I Back Close Full Screen / Esc
Print Version Interactive Discussion
they are dry inside the AMS, and to be collected with Eb∼1 when they retain water after entering the vacuum system (Hogrefe et al., 2004). Pure ammonium nitrate and ammonium nitrate-dominated ambient particles are collected with Eb∼1 (Jayne et al., 2000). The evidence is less clear for organic-dominated particles, as was the case during most of the MCMA-2003 campaign. Observations of ambient particles domi-5
nated by oxygenated organic aerosol (OOA) off the coast of New England, showed a
Eb∼0.5 (Onasch et al., 20052). Chamber experiments have also shown that secondary organic aerosols (SOA) formed from photooxidation of aromatics, and from ozonolysis of biogenic compounds, have an Eb∼0.5 (Bahreini et al., 2005). Since analysis of the submicron aerosol in Mexico City shows that a large fraction is OOA, likely mostly SOA 10
from the photooxidation of aromatics and other precursors (Dzepina et al., 20053), a similar value may be applicable to this study.
Given the evidence and uncertainties from previous laboratory studies and field cam-paigns, we have chosen a value of Eb=0.5 for all species for this campaign. We es-timate the maximum range of possible values of this parameter between about 0.45 15
and 0.70. Thus the mass concentrations reported in this paper have a range of uncer-tainty of about −30% and+10% due to the uncertainty in particle collection efficiency. The comparisons with other instruments presented in Sect. 3.3 are also consistent with the value of CE chosen here. Despite the uncertainty in the absolute concen-trations, the relative variation in concentrations and size distributions reported here 20
have a lower uncertainty, as evidenced by the fact that the dynamics of the AMS and TEOM/DustTrak/LASAIR concentrations track each other during the campaign (see Sect. 3.3).
2
Onasch, T. B. et al.: AMS measurements off the coast of New England, in preparation, 2005.
3
ACPD
5, 4143–4182, 2005
Mexico City aerosol during MCMA-2003 using an AMS – Part I D. Salcedo et al. Title Page Abstract Introduction Conclusions References Tables Figures J I J I Back Close Full Screen / Esc
Print Version Interactive Discussion
EGU
2.5. Collocated aerosol instrumentation 2.5.1. Black carbon measurements
The black carbon content of fine aerosols was estimated from the aerosol light absorp-tion using a seven-channel aethalometer (RTAA-1000, Magee Scientific, Berkeley, CA). Its sampling line was found to effectively collect aerosols in the 0.1 to 2.0 micron size 5
range (PM2). The particles are collected within the instrument by continuous filtration through a quartz filter tape strip. The optical transmission of the deposited aerosol par-ticles is then measured sequentially at seven wavelengths (370, 450, 520, 590, 660, 880, and 950 nm). Black carbon is a strongly absorbing component whose light ab-sorption coefficient is relatively constant over a broad spectral region. The instrument 10
automatically calculates the black carbon concentration from the transmission mea-surements by assuming black carbon to be the main absorbing aerosol species in the samples with a mass specific absorption coefficient of 19 m2g−1(Hansen et al., 1982; Marley et al., 2001). This value is larger than those typically used for the absorption of black carbon suspended in air due to the enhancement of the particle absorption 15
in the fiber matrix of the filter tape (Anthony Hansen, Magee Scientific, personal com-munication). Data were recorded for each of the seven channels at a two-minute time resolution. In addition, the analog output of the 520 nm channel was monitored con-tinuously and one minute averages of this channel were recorded separately. As the sample is deposited on the paper tape strip, the light attenuation steadily increases. At 20
high sample loadings the high absorptions cause detection limits to decrease. To pre-vent this, the instrument automatically advances the tape to a new sample spot when light attenuation becomes severe. The instrument sample was diluted 10:1 to minimize the instrument down time created by too frequent tape advances due to the high black carbon loading observed in Mexico City.
25
Unlike other absorbing aerosol species (e.g. humic like substances), black carbon absorption is relatively constant from the ultraviolet to the infrared (Marley et al., 2001). Thus a comparison of results from the different channels can act as an independent
ACPD
5, 4143–4182, 2005
Mexico City aerosol during MCMA-2003 using an AMS – Part I D. Salcedo et al. Title Page Abstract Introduction Conclusions References Tables Figures J I J I Back Close Full Screen / Esc
Print Version Interactive Discussion
validation of the assumption that black carbon is the main absorbing species in the samples. For the sampling period, all seven channels were found to be in excellent agreement, with a variation of 1–2%, indicating that black carbon was indeed the major light absorbing material present in the aerosol, if not the only one. The results from the 880 nm channel are used in this paper.
5
Jeong et al. (2004) reported that measurements of BC using an aethalometer can be up to about a factor of three different (higher or lower) than simultaneous measure-ments of elemental carbon (EC) using a thermal-optical method, depending on the physical and chemical characteristics of light absorbing species in the particles. Be-cause of this, there is some uncertainty on the actual EC/BC mass concentrations in 10
Mexico City during the MCMA-2003.
2.5.2. Impactor aerosol collection and PIXE analysis
A detailed description of the impactor sampling and analysis techniques are given elsewhere (Johnson et al., 2005a4) (Shutthanandan et al., 2002), hence only a brief description is presented here. Impactor aerosol collections were made continuously 15
onto Teflon strips with a 3-Stage IMPROVE DRUM impactor (UC Davis, California) in size ranges 1.15–2.5 µm, 0.34–1.15 µm, and 0.07–0.34 µm. The DRUM was operated with a fixed flow rate of 10 SLPM and rotation of 2 mm per 12 h. Proton-Induced X-ray Emission (PIXE) analysis was carried out immediately following the campaign at the Environmental Molecular Sciences Laboratory (EMSL), a national scientific facil-20
ity within Pacific Northwest National Laboratory located in Richland, WA. A 3.5 MeV proton beam with diameter 0.5 mm was used during analysis. PIXE spectra were inter-preted with the GUPIX program (Maxwell et al., 1995) and concentrations of elements Na to Pb determined by calibration to known standards. Concentrations are given in 6-h averages.
25
4
Johnson, K. S. et al.: Composition and Sourcing of Aerosol in the Mexico City Metropolitan Area with PIXE/PESA/STIM and Multivariate Analysis, in preparation, 2005a.
ACPD
5, 4143–4182, 2005
Mexico City aerosol during MCMA-2003 using an AMS – Part I D. Salcedo et al. Title Page Abstract Introduction Conclusions References Tables Figures J I J I Back Close Full Screen / Esc
Print Version Interactive Discussion
EGU
The soil particulate mass concentration is estimated from PIXE mass concentrations using the method described by Malm et al. (1994). These authors estimate the soil par-ticulate mass concentration by summing the elements predominantly associated with soil, plus oxygen for the most common oxides (Al2O3, SiO2, CaO, FeO, Fe2O3, TiO2), plus corrections for other compounds such as K2O, MgO, Na2O, water and carbonate. 5
The equation used is:
[soil]=2.20[Al] + 2.49[Si] + 1.36[Ca] + 2.42[Fe] + 1.94[Ti] (1) 2.5.3. Other particle instruments
A LASAIR Optical Particle Counter model 1001 (Particle Measuring Systems, Boulder, CO), and a DustTrak Aerosol Monitor model 8520 (TSI, St. Paul, MN) were deployed 10
at the CENICA site by the MIT and PNNL research groups.
The LASAIR device detects light scattered by individual particles crossing a detection volume illuminated with laser light and estimates the particles size by assuming that the scattered light intensity is a monotonic function of the particle size (Hinds, 1999). It de-termines the number concentration of particles in 8 different size channels (0.1–0.2 µm, 15
0.2–0.3 µm, 0.3–0.4 µm, 0.4–05 µm, 0.5–0.7 µm, 0.7–1.0 µm, 1.0–2.0 µm, 2.0–5.0 µm; equivalent geometric diameter, dp). The nominal detection efficiency is 100% for all channels, with the exception of 50% for the smallest channel.
The DustTrak is an aerosol photometer that uses a laser-beam to illuminate a sample stream, in which multiple particles scatter light in all directions. A detector determines 20
the total amount of light scattered at a 90 degree angle, which is roughly proportional to the mass concentration of the aerosol (TSI, 2004). The DustTrak deployed during the MCMA campaign used a PM2.5 impactor inlet. The DustTrak measurement was calibrated with gravimetric filter measurements taken by CENICA during the MCMA-2003 campaign and agreed well with a similar unit on board of the Aerodyne Mobile 25
Lab when parked at CENICA.
ACPD
5, 4143–4182, 2005
Mexico City aerosol during MCMA-2003 using an AMS – Part I D. Salcedo et al. Title Page Abstract Introduction Conclusions References Tables Figures J I J I Back Close Full Screen / Esc
Print Version Interactive Discussion
Greenbush, NY), which measures total PM2.5 mass concentration was operated by CENICA. The TEOM measures the PM2.5 total mass concentration using a vibrating element, whose resonant frequency depends on the accumulated particle mass col-lected on a filter located at the extreme of the element (Hinds, 1999). The TEOM used during the MCMA-2003 operated at 35◦C and was not equipped with a Sample 5
Equilibration System (SES).
3. Results and discussion
3.1. Determination of the Shape-Related Collection Efficiency (Es)
The average signal attenuation measured for each species as a function of BWP posi-tion across the particle beam is shown in Fig. 3. Chloride is not included because its 10
concentration was very low most of the time and the attenuated signal profile is very noisy. The attenuation at each position is similar for all species, and it is large only when the BWP is at the center position. This means that on average the particle beam is well-focused on the vaporizer. By applying the model of Huffman et al. (2005)1to the time dependent attenuation profiles of all species we estimate that Es∼1 for all species 15
during this field campaign; i.e., no significant particle mass goes undetected because of excessive beam divergence caused by particle non-sphericity. The fact that the pro-files of all species are similar suggests internal mixing of the species most of the time, since externally mixed particles would likely have different profiles for different species. Similar conclusions were obtained from the analysis of the speciated size distributions 20
(Salcedo et al., 2005), and with electron microscopy studies of individual particles col-lected at the CENICA site (Johnson et al., 2005b). The airbeam signal is attenuated at all positions except the outermost one, which indicates that the airbeam is not as well-focused as the particle beam. The attenuation of the airbeam is not symmetrical around the center of the heated surface, which is probably due to slight imperfections 25
ACPD
5, 4143–4182, 2005
Mexico City aerosol during MCMA-2003 using an AMS – Part I D. Salcedo et al. Title Page Abstract Introduction Conclusions References Tables Figures J I J I Back Close Full Screen / Esc
Print Version Interactive Discussion
EGU
Particle beam focusing in aerodynamic lenses is known to be a function not only of shape, but also of particle size (Zhang et al., 2004b; Huffman et al., 20051). In order to explore the focusing of the ambient particle beam as a function of particle size, pan-els (a) through (d) in Fig. 4 show the size distribution for each species compared with the size distribution measured when the BWP was blocking the center of the particle 5
beam. Panels (e) and (f) in Fig. 4 show the signal attenuation when the BWP was on the center position as a function of particle size. Note that the NH+4 attenuation profiles are noisier than for other species due to the higher noise for this species in the AMS, mainly due to interference from O+ ions from O2 and water. The signal attenuation reveals a size dependency: the smaller particles show lower attenuation in the pres-10
ence of the BWP, which means that they are less well focused than the particles at the peak of the size distribution. This is expected since Brownian motion and the lower ef-ficiency of aerodynamic focusing for small particles cause increased beam broadening for these particles, even if they are spherical, eventually leading to incomplete collec-tion below ∼60 nm (Zhang et al., 2002, 2004b). In addicollec-tion, the ultrafine particle mode 15
is dominated by combustion emissions in Mexico City (Dzepina et al., 20053); hence, because they are likely internally mixed with soot, they are irregular. Non spherical particles, which are less focused by the aerodynamic lens (Liu et al., 1995; Jayne et al., 2000; Huffman et al., 20051), form a wider beam and their signal should be atten-uated less by the BWP. Although particle losses due to beam broadening for smaller 20
particles can be considerable, we did not attempt to correct for this effect due to the complexities and assumptions needed, and because there are other uncertainties that are more important, such as the value of Eb(see Sect. 2.4). Particles in the accumula-tion mode (300–800 nm) show much larger attenuaaccumula-tion, indicating that they are better focused. Particles larger than 1 µm have broader beams than those around 500 nm, 25
as expected due to the reduced focusing ability of the lens for larger sizes (Zhang et al., 2004b). The similar attenuation for all species for the accumulation mode is also suggestive of internal mixing most of the time for this mode.
ACPD
5, 4143–4182, 2005
Mexico City aerosol during MCMA-2003 using an AMS – Part I D. Salcedo et al. Title Page Abstract Introduction Conclusions References Tables Figures J I J I Back Close Full Screen / Esc
Print Version Interactive Discussion
did not block the particle beam at all) with the concentration measured when the BWP was blocking the center of the particle beam. Only a few days of the campaign are shown because the purpose of the figure is to illustrate the range of variation of this measurement, and the patterns were similar during other periods. Mass concentra-tions in this figure were not corrected for air beam (AB) signal variaconcentra-tions (Allan et al., 5
2003) because of the large variations in the AB were caused by the presence of BWP and that are not due to changes in the sensitivity of the instrument as assumed by the AB correction. Panel (b) shows the signal attenuation caused by the BWP at the posi-tion that blocks the center of the particle beam, compared to the non-blocking posiposi-tion measurements in the 2 min preceding and following the attenuated measurement. The 10
figure shows that the degree of attenuation of the signal has some variability in time, in-dicating changes in the particle beam focusing which might be attributed to changes in the particle shape. The shape-related collection efficiency, Es, remained at 1 during this period. In order to explore the relationship between particle shape and the signal atten-uation with the BWP, Fig. 5b also shows the signal of the ion fragment m/z 44, which 15
is a marker for oxygenated organic aerosol (OOA) (Zhang et al., 2005a). The presence of OOA in the particles might be an indication of particle aging. Figure 5 shows that some of the variability in the signal attenuation appears to correlate with changes in the particle OOA concentration. However, this correlation does not always hold. Simi-lar analyses to that exemplified by Fig. 5 were carried out using other parameters that 20
may be correlated with particle sphericity or non-sphericity, such as relative humid-ity, particle size, black carbon, and hydrocarbon-like organic compounds (HOA, likely primary combustion aerosol) as indicated by the AMS ion fragment m/z 57. These correlations were also analyzed for selected AMS size ranges, since particle focusing is also dependent on particle size. Various periods of correlations, anti-correlation, 25
and no correlation between beam attenuation and these parameters were observed in the data from this campaign. However, no consistent trend was observed, indicating that multiple parameters may affect the average particle non-sphericity in a complex way. In order to understand this issue, detailed laboratory work with particles of known
ACPD
5, 4143–4182, 2005
Mexico City aerosol during MCMA-2003 using an AMS – Part I D. Salcedo et al. Title Page Abstract Introduction Conclusions References Tables Figures J I J I Back Close Full Screen / Esc
Print Version Interactive Discussion
EGU
sizes and shapes (e.g. combined with off-line electron microscopy measurements) and fieldwork at more locations need to be performed.
3.2. Comparison between AMSs
Figure 6 panels (a) and (b) show the comparison (time series and scatter plot) of the total NR-PM1 measured with the CENICA and the AML AMSs for periods when the 5
AML was parked at CENICA during MCMA-2003. Panels (b)–(f) show the scatter plots of the main NR-PM1 species measured with both AMSs. The comparison is made using 30 min averages in order to minimize the effects of local plumes. While the two AMSs were co-located at CENICA, they were situated 20–50 m apart (parking lot and top of building) and were not sampling from the same inlet. Thus, either instrument 10
could and was influenced by local, small scale (car, truck, industrial) plumes that were either sampled by the other AMS at a slightly different time, or not at all. Despite the slight difference in location, the correlations between the two AMSs for total NR-PM1 and for each individual chemical component are generally good, exhibiting r2 values greater than 0.84. Absolute magnitude differences between instruments were 14%, 15
32%, 17%, 12% and 1% for total, nitrate, sulfate, ammonium, and organics, respec-tively. The positive difference in the signals (CENICA > AML) for the total and each individual species, with the apparent exception of the organics, is due to the different inlets used in the CENICA and AML AMSs. The largest difference (32%) is noted in the nitrate comparison and occurred on 9 and 10 April, depicted as the yellow time 20
period in Fig. 6. During this period, the aerosol composition was dominated by nitrate and organics and to a less degree, ammonium and sulfate. The median diameters of the accumulation mode of the nitrate and organics size distributions during this period (513 and 476 nm, respectively) were larger than the median diameter for the nitrate and organics during the full campaign (438 and 343 nm, respectively) (Salcedo et al., 25
2005). Measurements with LASAIR further confirm that the particles size distribution shifts to larger diameters during this period. Since a 120 micron orifice allows larger particle transmission compared with the 100 micron orifice, the AML AMS was missing
ACPD
5, 4143–4182, 2005
Mexico City aerosol during MCMA-2003 using an AMS – Part I D. Salcedo et al. Title Page Abstract Introduction Conclusions References Tables Figures J I J I Back Close Full Screen / Esc
Print Version Interactive Discussion
a fraction of the mass measured by the CENICA AMS during 9 and 10 April. This effect is readily apparent in the correlation plots in Fig. 6, where the yellow points in the total, nitrate, sulfate, ammonium, and organics comparisons are all higher than the 1:1 line. The reason for the small magnitude difference in the case of the organics is due to the fact that the fit is dominated by higher organic concentrations measured at a different 5
time.
3.3. Comparison with collocated particle instruments
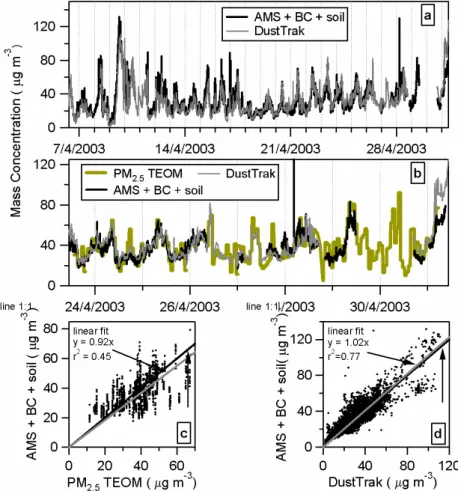
The DustTrak and TEOM measure the total particulate concentration, including both refractory and non refractory species. In order to properly compare these instruments to the AMS, the mass of the refractory species needs to be added to the total AMS non-10
refractory mass concentrations. Thus we have added the AMS, BC, and estimated soil particulate mass concentrations as the best approximation to the total particle mass concentration from the sum of all speciated measurements. This correction to the AMS data is important for the comparison with other instruments because the BC+ soil mass concentration was relatively high during the MCMA-2003 (equivalent to ∼20% of the 15
Total NR-PM1, (Salcedo et al., 2005)). Figure 7 shows the comparison of AMS+ BC + soil mass concentration with that measured by the DustTrak and TEOM. For the TEOM only a few days at the end of the campaign were available due to instrument malfunc-tion in the earlier part. Scatter plots between the three data sets are also shown in Fig. 7. Note that the AMS measured approximately PM1, while the aethalometer mea-20
sured PM2BC, and the impactor subtracts, DustTrak and TEOM measured PM2.5. The total AMS + BC + soil concentrations are close on average to the total PM2.5 mass measured by either TEOM or DustTrak. The agreement between AMS + BC + soil concentrations and the other total mass measurements suggests that there is very little non-refractory mass in particles with diameters between 1 and 2.5 µm. These ob-25
servations can be further substantiated by analyzing the size distribution data provided by the LASAIR.
ACPD
5, 4143–4182, 2005
Mexico City aerosol during MCMA-2003 using an AMS – Part I D. Salcedo et al. Title Page Abstract Introduction Conclusions References Tables Figures J I J I Back Close Full Screen / Esc
Print Version Interactive Discussion
EGU
+ soil mass loadings are compared in Figure 8 (note the different scales). The black carbon size distribution was estimated using the size distribution of ion fragment m/z 57, which has been used as a marker for fresh primary emitted particles; thus, it is expected to have a similar size distribution as black carbon vs. vacuum aerodynamic diameter (Zhang et al., 2005a, b). The size distribution of AMS fragment m/z 57 was 5
scaled so that the integrated mass concentration was equal to the BC mass concen-tration. The number concentration of particles in each LASAIR channel was converted to volume concentration assuming that the particle probability density is constant for all sizes in each bin. Then, we converted the particle volume concentration into mass con-centration by multiplying the volume by the estimated size dependent material density 10
(ρm, g cm−3), calculated using the following equation (DeCarlo et al., 2004):
ρm=[NO − 3]+ [SO 2− 4 ]+ [NH + 4]+ [Cl − ]+ [organics] + [BC] + [soil] [NO−3]+[SO2−4 ]+[NH+4] 1.75 + [Cl−] 1.52+ [organics] 1.2 + [BC] 1.77+ [soil] 2.7 (2)
where [NO−3], [SO2−4 ], [NH+4], [Cl−], [organics], [BC], and [soil] represent the size de-pendent mass concentration of each species. Equation (2) assumes that the densities of ammonium nitrate, ammonium sulfate, and ammonium bisulfate are approximately 15
1.75 g cm−3 (Lide, 1991); the density of ammonium chloride is 1.52 g cm−3 (Lide, 1991); the density of organics is 1.2 g cm−3 (Turpin and Lim, 2001); the density of black carbon 1.77 g cm−3 (Park et al., 2004); the average density of soil, calculated from the weighted average density of the main oxides (Lide, 1991), is 2.7 g cm−3. The
dv acorresponding to the geometric diameter (dp) of each channel boundary of the LA-20
SAIR and the impactor substrates, was also calculated from dp using the estimated size-dependent density (Jimenez et al., 2003b).
Figure 8 shows that the LASAIR measured lower mass concentrations than the AMS + BC + soil. The discrepancy may be partially due to saturation of the LASAIR with the high particle number concentrations in Mexico City. This instrument has some elec-25
ACPD
5, 4143–4182, 2005
Mexico City aerosol during MCMA-2003 using an AMS – Part I D. Salcedo et al. Title Page Abstract Introduction Conclusions References Tables Figures J I J I Back Close Full Screen / Esc
Print Version Interactive Discussion
this saturation effect (Murphy et al., 1997), but unfortunately a diluter was not used during this study. The average aerosol number concentration reported by the LASAIR for its size range during MCMA-2003 was 1922 cm−3; almost an order of magnitude higher than the maximum ambient concentration recommended for the LASAIR 1001 (353 cm−3). This very likely caused the instrument to undercount particles. An un-5
dercounting effect has been observed in other studies (Murphy et al., 1997). Another possible effect of the LASAIR operating under saturation conditions is the possibility of more than one particle being in the optical sensing volume at the same time. This coincidence of particles may also cause an undercounting; in addition, it may shift the size distribution to larger sizes because the instrument may classify the particles in the 10
sensing volume as a single larger particle.
The shapes of the size distributions in Fig. 8 are similar for large particle sizes, while the LASAIR detects fewer small particles than the AMS+ BC + soil. This may partially be due to the larger size cut at the small end for the LASAIR, that nominally detects 50% of the particles between dp=100–200 nm, compared to the AMS, which detects all 15
(spherical) particles down to about 60 nm and has some transmission down to ∼33 nm (Zhang et al., 2004a). The agreement between the size distributions can be improved if the mass concentration in the smallest LASAIR channel is multiplied by two in order to account for the lower detection efficiency of the smallest particles, as it is shown by the dashed line in Fig. 8.
20
Another possible source for the apparent discrepancy is the presence of irregular soot particles that are sized smaller than their volume-equivalent diameter by the AMS (DeCarlo et al., 2004; Slowik et al., 2004; Zhang et al., 2005b) and likely sized larger by the LASAIR since light scattering is roughly proportional to particle surface area. A similar apparent discrepancy when comparing AMS and SMPS data for Pittsburgh 25
is shown in Fig. 4a of Zhang et al. (2005b). An important piece of information arising from the LASAIR data is the relatively low mass concentrations of particles between 1 and 3 µm (even when the size distribution might be shifted to larger sizes as it was mentioned above). In some previous AMS studies the concentrations of particles in
ACPD
5, 4143–4182, 2005
Mexico City aerosol during MCMA-2003 using an AMS – Part I D. Salcedo et al. Title Page Abstract Introduction Conclusions References Tables Figures J I J I Back Close Full Screen / Esc
Print Version Interactive Discussion
EGU
this size range have been high, leading to significantly higher PM2.5 than PM1 mass concentrations (Zhang et al., 2005b). The fact that this is not the case during MCMA-2003 is consistent with the good agreement seen in Fig. 7 between the total AMS+ BC + soil concentrations and those measured by the TEOM and DustTrak which operated with PM2.5size cuts.
5
Figure 9 compares the time series of AMS+ BC + soil mass concentrations with the estimated LASAIR mass concentrations. To estimate the LASAIR mass concentration shown in the figure, the size dependent density described above was used, and only the first six channels (0.1 µm to 1.0 µm geometrical diameter) were considered be-cause they correspond to approximately 137 nm to 1370 nm in vacuum aerodynamic 10
diameter, which roughly corresponds to the size range that the AMS can measure. It can be seen in Fig. 9 that the LASAIR measures about 43% of the mass concentra-tion of AMS+ BC + soil. However, both measurements capture similar dynamics and changes of the mass concentration in time (e.g. r2=0.78). The absolute discrepancy is likely due to saturation of the LASAIR with the high particle number concentrations in 15
Mexico City.
Some air quality standards for fine particles are based on PM2.5 total mass con-centration. In Fig. 10 we present an estimation of the species contributions to the total average PM2.5 mass concentration from the available particle composition data at CENICA during MCMA-2003. PIXE analyses on the impactor substrates indicate 20
that the average concentration of NaCl was at most 0.1 µg m−3, and hence we did not include sodium in this figure or the previous analysis. Another species that we did not include is particulate water, because there are significant uncertainties in water quan-tification with the AMS due to evaporation losses in the inlet. Note that although water evaporation in the AMS inlet has been observed by several groups, evaporation of other 25
species is not believed to be a problem for AMS ambient measurements, since the va-por pressure of other aerosol components is typically at least 6–7 orders of magnitude below that of water. Finally, although the AMS measures NR-PM1, LASAIR measure-ments during the MCMA-2003 campaign show that the particle mass in the range of
ACPD
5, 4143–4182, 2005
Mexico City aerosol during MCMA-2003 using an AMS – Part I D. Salcedo et al. Title Page Abstract Introduction Conclusions References Tables Figures J I J I Back Close Full Screen / Esc
Print Version Interactive Discussion
1–3 µm is small. For this reason, and to avoid double counting the BC and soil particu-late mass in this size range, we did not include an estimation of the mass concentration of the NR particulate matter 1–2.5 µm. For comparison purposes, Fig. 10 also shows the average DustTrak PM2.5 mass concentration for the same period. The difference between the estimated PM2.5 from speciated measurements and the DustTrak PM2.5 5
is within the experimental uncertainties; hence, we conclude that the combination of the AMS, BC, and soil particulate mass measurements can be used as an estimate of PM2.5during MCMA-2003, which is consistent with other particle measurements.
4. Conclusions
Two Aerodyne Aerosol Mass Spectrometers were deployed in Mexico City as part of 10
the MCMA-2003 field campaign. The results of this deployment will be presented in a series of papers, of which this is the first one. Here we focus on the calibrations, measurement of shape-related collection efficiencies, and comparison of both AMSs with each other and with other collocated particle instruments. The calibration and sensitivity of the instruments were stable during the campaign, and the measured de-15
tection limits were similar to those reported for previous campaigns. For the first time, we report the use of a beam width probe inside an AMS during a field campaign to probe the surrogate shape and mixing state of the particles, and to quantify potential losses of irregular particles due to beam broadening. Results from this probe show that the shape-related collection efficiency of the particles was approximately one dur-20
ing the campaign. The speciation, and mass concentrations reported by the two AMSs compared well. The differences found are likely due to the different inlets used in both instruments. This is the first published intercomparison between two Q-AMSs. The combined AMS+ BC + soil mass concentrations and size distribution are compared with other collocated instruments (LASAIR, TEOM, and DustTrak) and the results show 25
that the combined AMS + BC + soil measurements represent a quantitative, size-resolved chemical speciation of the total PM2.5in MCMA. An overview of the dynamics
ACPD
5, 4143–4182, 2005
Mexico City aerosol during MCMA-2003 using an AMS – Part I D. Salcedo et al. Title Page Abstract Introduction Conclusions References Tables Figures J I J I Back Close Full Screen / Esc
Print Version Interactive Discussion
EGU
of these species during MCMA-2003 is presented in Part II of this series, with more detailed analysis to follow in future papers.
Acknowledgements. The authors are very grateful to R. Ramos from the Government of the Federal District for help with logistical and customs issues. We thank J. Allan of the University of Manchester, and A. Delia of the University of Colorado for AMS data analysis software.
5
We acknowledge funding from the US National Science Foundation (Grant ATM-0308748) to MIT, CU and ARI. CU also received funds from the US Department of Energy (Grant DE-FG02-05ER63981). The MIT and ARI teams also thank the Comisi ´on Ambiental Metropolitana (CAM) for financial and logistical support. Argonne National Laboratory studies were supported by the Department of Energy’s Atmospheric Science Program. D. Salcedo acknowledges Consejo
10
Nacional de Ciencia y Tecnolog´ıa (CONACyT) for financial support. K. Dzepina is a recipient of an Advanced Study Program Graduate Fellowship from the National Center for Atmospheric Research (NCAR). A. Huffman is grateful for a NASA Earth Science fellowship (grant NGT5-30516). We thank the AMS Users community for many helpful discussions.
References
15
Alfarra, M. R., Coe, H., Allan, J. D., Bower, K. N., Boudries, H., Canagaratna, M. R., Jimenez, J. L., Jayne, J. T., Garforth, A., Li, S. M., and Worsnop, D. R.: Characterization of Urban and Regional Organic Aerosols In the Lower Fraser Valley Using Two Aerodyne Aerosol Mass Spectrometers, Atmos. Environ., 38, 5745–5758, 2004.
Allan, J. D., Jimenez, J. L., Coe, H., Bower, K. N., Williams, P. I., and Worsnop, D. R.:
Quanti-20
tative Sampling Using an Aerodyne Aerosol Mass Spectrometer, Part 1: Techniques of Data Interpretation and Error Analysis, J. Geophys. Res., 108, 4090, doi:10.1029/2002JD002358, 2003.
Allan, J. D., Bower, K. N., Coe, H., Boudries, H., Jayne, J. T., Canagaratna, M. R., Mil-let, D. B., Goldstein, A. H., Quinn, P. K., Weber, R. J., and Worsnop, D. R.: Submicron
25
aerosol composition at Trinidad Head, CA during ITCT 2K2, its relationship with gas phase volatile organic carbon and assessment of instrument performance, J. Geophys. Res., 109, doi:10.1029/2003JD004208, 2004a.
Allan, J. D., Delia, A. E., Coe, H., Bower, K. N., Alfarra, M. R., Jimenez, J. L., Middlebrook, A. M., Drewnick, F., Onasch, T. B., Canagaratna, M. R., Jayne, J. T., and Worsnop, D. R.:
ACPD
5, 4143–4182, 2005
Mexico City aerosol during MCMA-2003 using an AMS – Part I D. Salcedo et al. Title Page Abstract Introduction Conclusions References Tables Figures J I J I Back Close Full Screen / Esc
Print Version Interactive Discussion
Technical note: A generalized method for the extraction of chemically resolved mass spectra from Aerodyne aerosol mass spectrometer data, J. Aerosol. Sci., 35, 909–922, 2004b. Bahreini, R., Keywood, M. D., Ng, N. L., Varutbangkul, V., Gao, S., Flagan, R. C., Seinfeld, J.
H., Worsnop, D. R., and Jimenez, J. L.: Measurements of Secondary Organic Aerosol (SOA) from oxidation of cycloalkenes, terpenes, and m-xylene using an Aerodyne Aerosol Mass
5
Spectrometer, Environ. Sci. Technol., in press, 2005.
Baron, P. A. and Willeke, K.: Aerosol Measurement: Principles, Techniques, and Applications, Wiley-Interscience, Hoboken, NH, 2001.
Canagaratna, M. R., Jayne, J. T., Ghertner, D. A., Herndon, S., Shi, Q., Jimenez, J. L., Silva, P. J., Williams, P. I., Lanni, T., Drewnick, F., Demerjian, K. L., Kolb, C. E., and Worsnop, D.
10
R.: Chase Studies of Particulate Emissions from in-use New York City Vehicles, Aerosol Sci. Technol., 38, 555–573, 2004.
DeCarlo, P. F., Slowik, J. G., Worsnop, D. R., Davidovits, P., and Jimenez, J. L.: Particle Morphology and Density Characterization by Combined Mobility and Aerody-namic Diameter Measurements, Part 1: Theory, Aerosol Sci. Technol., 38, 1185–1205,
15
doi:10.1080/027868290903907, 2004.
Drewnick, F., Schwab, J. J., Jayne, J. T., Canagaratna, M. R., Worsnop, D. R., and Demerjian, K. L.: Measurement of Ambient Aerosol Composition During the PMTACS-NY 2001 Using an Aerosol Mass Spectrometer, Part I: Mass concentrations, Aerosol Sci. Technol., 38, 92–103, doi:10.1080/02786820390229507, 2004a.
20
Drewnick, F., Jayne, J. T., Canagaratna, M. R., Worsnop, D. R., and Demerjian, K. L.: Mea-surement of Ambient Aerosol Composition During the PMTACS-NY 2001 Using an Aerosol Mass Spectrometer, Part II: Chemically Speciated Mass Distributions, Aerosol Sci. Technol., 38, 104–117, 2004b.
Hansen, A. D. A., Rosen, H., and Novakov, T.: Real-time measurement of the absorption
25
coefficient of aerosol particles, Appl. Optics, 21, 3060–3062, 1982.
Heberlein, J., Postel, O., Girshick, S., McMurry, P., Gerberich, W., Iordanoglou, D., Di Fonzo, F., Neumann, D., Gidwani, A., Fan, M., and Tymiak, N.: Thermal plasma deposition of nanophase hard coatings, Surf. Coat. Technol., 142, 265–271, 2001.
Hinds, W. C.: Aerosol technology; properties behavior, and measurement of airborne particles,
30
John Wiley and Sons, USA, 1999.
Hogrefe, O., Schwab, J. J., Drewnick, F., Lala, G. G., Peters, S., Demerjian, K. L., Rhoads, K., Felton, H. D., Rattigan, O. V., Husain, L., and Dutkiewicz, V. A.: Semicontinuous PM2.5
ACPD
5, 4143–4182, 2005
Mexico City aerosol during MCMA-2003 using an AMS – Part I D. Salcedo et al. Title Page Abstract Introduction Conclusions References Tables Figures J I J I Back Close Full Screen / Esc
Print Version Interactive Discussion
EGU
Sulfate and Nitrate Measurements at an Urban and a Rural Location in New York: PMTACS-NY Summer 2001 and 2002 Campaigns, J. Air. Waste Manage., 54, 1040–1060, 2004. Jayne, J. T., Leard, D. C., Zhang, X., Davidovits, P., Smith, K. A., Kolb, C. E., and Worsnop,
D. R.: Development of an Aerosol Mass Spectrometer for Size and Composition Analysis of Submicron Particles, Aerosol Sci. Technol., 33, 49–70, 2000.
5
Jeong, C.-H., Hopke, P. K., Kim, E., and Lee, D.-W.: The comparison between thermal-optical transmittance elemental carbon and Aethalometer black carbon measured at multiple moni-toring sites, Atmos. Environ., 38, 5193–5204, 2004.
Jimenez, J. L., Jayne, J. T., Shi, Q., Kolb, C. E., Worsnop, D. R., Yourshaw, I., Seinfeld, J. H., Flagan, R. C., Zhang, X., Smith, K. A., Morris, J., and Davidovits, P.: Ambient aerosol
10
sampling using the Aerodyne Aerosol Mass Spectrometer, J. Geophys. Res., 108, 8425, doi:10.1029/2001JD001213, 2003a.
Jimenez, J. L., Bahreini, R., Cocker, D. R., Zhuang, H., Varutbangkul, V., Flagan, R. C., Sein-feld, J. H., O’Dowd, C. D., and Hoffmann, T.: New particle formation from photooxidation of diiodomethane (CH2I2), J. Geophys. Res., 108, 4318, doi:10.1029/2002JD002452, 2003b.
15
Jimenez, J. L., Bahreini, R., Cocker, D. R., Zhuang, H., Varutbangkul, V., Flagan, R. C., Seinfeld, J. H., O’Dowd, C. D., and Hoffmann, T.: Correction to “New particle for-mation from photooxidation of diiodomethane (CH2I2)”, J. Geophys. Res., 108, 4733,
doi:10.1029/2003JD004249, 2003c.
Johnson, K. S., Zuberi, B., Iedema, M. J., Cowin, J. P., Gaspar, D. J., Wang, C., Laskin, A.,
20
Molina, L. T., and Molina, M. J.: Processing of Soot in an Urban Environment: Case Study from the Mexico City Metropolitan Area, Atmos. Chem. Phys. Discuss., accepted, 2005b. Katrib, Y., Martin, S. T., Rudich, Y., Davidovits, P., Jayne, J. T., and Worsnop, D. R.: Density
Changes of Aerosol Particles as a Result of Chemical Reaction, Atmos. Chem. Phys., 5, 275–291, 2005,
25
SRef-ID: 1680-7324/acp/2005-5-275.
Kolb, C. E., Herndon, S. C., McManus, J. B., Shorter, J. H., Zahniser, M. S., Nelson, D. D., Jayne, J. T., Canagaratna, M. R., and Worsnop, D. R.: Mobile Laboratory with Rapid Re-sponse Instruments for Real-Time Measurements of Urban and Regional Trace Gas and Particulate Distributions and Emission Source Characteristics, Environ. Sci. Technol., 38,
30
5694–5703, 2004.
Lide, D. R.: CRC Handbook of Chemistry and Physics, CRC Press Inc, USA, 1991.