HAL Id: hal-00329068
https://hal.archives-ouvertes.fr/hal-00329068
Submitted on 1 Jan 1997
HAL is a multi-disciplinary open access archive for the deposit and dissemination of sci-entific research documents, whether they are pub-lished or not. The documents may come from teaching and research institutions in France or abroad, or from public or private research centers.
L’archive ouverte pluridisciplinaire HAL, est destinée au dépôt et à la diffusion de documents scientifiques de niveau recherche, publiés ou non, émanant des établissements d’enseignement et de recherche français ou étrangers, des laboratoires publics ou privés.
E-region mid-latitude decametre irregularities observed
at four radar frequencies. Experiment and first results
G. C. Hussey, J. Delloue, C. Haldoupis, A. Bourdillon
To cite this version:
G. C. Hussey, J. Delloue, C. Haldoupis, A. Bourdillon. E-region mid-latitude decametre irregularities observed at four radar frequencies. Experiment and first results. Annales Geophysicae, European Geosciences Union, 1997, 15 (7), pp.918-924. �hal-00329068�
E-region mid-latitude decametre irregularities observed
at four radar frequencies. Experiment and first results
G. C. Hussey1, J. Delloue1, C. Haldoupis2, A. Bourdillon31Laboratoire de Physique de 1’Exosphe`re, Universite´ Pierre et Marie Curie, Paris, France 2
Physics Department, University of Crete, Iraklion, Crete, Greece
3Laboratoire Radiocommunications, Universite´ de Rennes 1, Rennes, France
Received: 5 June 1996 / Revised: 24 September 1996 / Accepted: 24 October 1996
Abstract. In this paper an experiment designed for
multifrequency azimuthal Doppler-spectrum investiga-tions of decametre-scale plasma irregularities in the mid-latitude E region is introduced and some preliminary results are presented. The observations were made with the high-frequency Valensole radar in the south of France. The radar operated in a multifrequency mode that allowed simultaneous measurements of Doppler spectra at the four frequencies of 9.23, 11.03, 12.71 and 16.09 MHz, which correspond to scatter from field-aligned irregularities with wavelengths of 16.2, 13.6, 11.8 and 9.3 m, respectively. In addition, a digital ionosonde was operating beneath a small part of the radar viewing region. The data show that lower-frequency echoes are stronger, more frequent and more spatially extended than higher-frequency ones, in general agreement with theory and rocket measurements. On the other hand, the preliminary analysis shows no pronounced differences of the Doppler spectrum with radar frequency. Some trends in the spectral moments do exist, however, which can be understood as the result of temporal and/or spatial mixing of backscatter from directly generated (primary) plasma waves by the gradient drift instability and secondary low-velocity waves. Finally, a close relation of mid-latitude coherent backscatter with patchy sporadic E-layers is present in the data, but the details of this relation remain unresolved.
1 Introduction
In the last decade there has been a renewed interest in coherent backscatter from short-scale field-aligned plas-ma irregularities in the mid-latitude E-region ionosphere using radio-frequency radars (e.g. Riggin et al., 1986; Yamamoto et al., 1992; Haldoupis and Schlegel, 1993; Bourdillon et al., 1995). The objective has been to investigate the nature of the echoes, in particular, their
Doppler spectrum, dynamics and morphological char-acteristics, as well as the mechanisms that destabilise the plasma at decametre and metre wavelengths. The fun-damental physics and understanding of these phenom-ena are based upon the modified two-stream, or Farley-Buneman, plasma instability and the gradient-drift instability, which have their origins in E-region studies of the equatorial and auroral electrojets (e.g. Fejer and Kelley, 1980).
To continue the work started by Bourdillon et al. (1995), the Valensole high-frequency (HF) radar, run by the Laboratoire de Physique de l’Exosphe`re at the Universite´ Pierre et Marie Curie (Paris VI), was oper-ated in a multifrequency scheme for the purpose of investigating the backscatter dependence on decametre irregularity wavelength. In this experiment the radar operation mode allowed for the observation of Doppler spectra simultaneously at four frequencies: 9.23, 11.03, 12.71, and 16.09 MHz. To supplement the radar measurements, a digital ionosonde was also operated beneath one part of the field of view. In this paper, the experiment is introduced and some preliminary obser-vations are presented and discussed.
2 Experiment
The present experiment, referred to as SPOREX-95 (sporadic-E experiment 1995), is an extension of a similar experiment performed in 1993 and described by Bourdillon et al. (1995), who also give details about the radar system and the observing geometry. In brief, the radar is located near the village of Valensole (43.8°N, 6.1°E) in southern France and can operate from 4 to 30 MHz with a frequency step of 1 kHz. For transmission, a broad beam-width array is used for large azimuthal coverage, whereas for reception a long array (560 m) of vertical monopole antenna pairs is used, along with digital beam forming, to obtain a 3-dB beam width of 2° at 15 MHz. Through antenna phasing and beam forming, the receiver beam can be stepped in increments
of 2° in azimuth from 58° W to 24° E of geographic north for a total of 42 azimuths. In this experiment, a 16-gate viewing region sampled every 18 km from 102 to 390 km was assumed to be more than sufficient to cover all E-region aspect sensitive backscatter from an iono-spheric area centred near ~37° invariant magnetic latitude, L ~ 1.7, and magnetic dip ~60°. The novel aspect of the experiment was the simultaneous radar operation in four frequencies
A complete azimuthal scan, in spatial terms 16 ranges by 42 azimuths for a total of 672 grid points, took ~ 4 min. For each individual grid (range-azimuth) point a 64-point Doppler spectrum was computed by averaging in real time four spectral estimates for each of the four radar frequencies. In order to obtain the spectra for all four frequencies simultaneously, the radar was operated in a pulse-to-pulse interlace mode with an inter-pulse period of 30 ms per frequency and a pulse repetition rate of 133.33 Hz. In this mode, the unambiguous range was 2250 km and the Nyquist Doppler velocities for the four frequencies of 9.23, 11.03, 12.71 and 16.09 MHz were ±270.7, ±226.5, ±196.6 and ±155.3 m/s respectively, whereas the corresponding Doppler velocity resolution was 8.4, 7.1, 6.1 and 4.8 m/s. A complete description of the Valensole HF radar system may be found in Six et al. (1996).
During the last phase of the experiment there was a digital ionosonde operating under a small part of the Valensole radar field of view near the village of Termignon (45.3° N, 6.8° E) about 175 km northeast of Valensole. With respect to the radar field of view, the ionosonde was situated at an azimuth of 18.8°and at a range between 196 and 212 km for backscatter heights between 90 and 120 km. In this campaign, the radar operated from 27 May to 28 June 1995 and 3 July to 13 July 1995. The ionosonde only operated from 4 July to 17 July 1995.
3 Observations
The foremost purpose of the experiment was to study possible dependences in the decametre-scale range of measured quantities and to compare the results to theory. To this end, the four first moments of the Doppler spectrum were calculated for all four radar frequencies. These moments represent the total relative echo power (as signal-to-noise ratio in dB), mean Doppler velocity (m/s), mean spectral width (m/s) and skewness (dimensionless), respectively. The first three quantities relate to the mean electron density fluctuation amplitude, phase velocity and growth rate of the scattering plasma waves, respectively. The skewness is a measure of the degree of asymmetry in the Doppler spectrum. Note that all moments were computed inside the same Doppler velocity band of ±150 m/s for all four frequencies.
We focus on a typical event of backscatter observed in the dark post-midnight hours of 6 July 1995. In this event, echoes were present in all four frequencies for a period of about 3 h starting shortly after ~01:00 UT
(LT = UT + 25 min), during a night having a low level of manmade interference.
3.1 Azimuthal characteristics
In Fig. 1, colour-scale plots of the total power of all four radar frequencies for a single scan are shown in a range versus geographic azimuth format. The 4-min scan begins at 01:59:48 UT and shows aspect sensitive scatter to be present in all four frequencies for only part of the large azimuthal sector covered by the radar. The total power, expressed as a signal-to-noise ratio in dB, is in principle proportional to the irregularity scattering cross-section at a fixed wavelength but also depends on a number of experimental parameters that vary with frequency such as effective antenna patterns, transmitted power, transmission line losses, etc. Note that no power corrections between different frequencies have been made, although to a first approximation these are small and likely to be within 1–4 dB of one another.
As seen in Fig. 1, the strongest echoes are located roughly at an oblique range of 200 km for all frequen-cies, which corresponds to aspect sensitive scatter from heights in the neighbourhood of 105 km. We note that both the occurrence and intensity of scatter decrease as the radar frequency increases; also, the echoes are more extended in space at lower frequencies, a result that agrees with simultaneous measurements at 9.0 and 14.8 MHz made in SPOREX-93 and reported by Bourdillon
et al. (1995). This trend of decreasing echo intensity and
occurrence with decreasing irregularity wavelength is in general agreement with theory (e.g. see review by Farley, 1985) and in situ rocket observations (e.g. Pfaff et al., 1987).
The remaining spectral moments for the event shown in Fig. 1, that is, mean velocity, width and skewness, were plotted in the same format as power but are not shown here. In brief, the mean velocity plot indicated that for all four frequencies the Doppler motions between 30° and 0° azimuth were positive (motions towards the radar) and took values between ~10 and 50 m/s; in the easternmost portion of the plots the motions were in the opposite direction at roughly the same magnitude (~)10 to )40 m/s). The mean-width plot indicated narrow spectra with values between ~50 and 100 m/s. As for the skewness, it was clear that when the mean velocity was positive the skewness was negative, and vice versa; this trend was seen throughout the data set and is further explored in the statistical study which follows. Note that a spectrum having its tail extended to the right (left) has a positive (negative) skewness compared to a symmetric spectrum of zero skewness.
Two other presentation formats similar to that in Fig. 1 are also used to study further spatial and temporal aspects of the data. These correspond to time-(scan) azimuth-intensity (TAI) plots at a fixed range and to range-time-intensity (RTI) plots at a fixed azimuth, which allow detection of zonal and meridional motions, respectively, of backscatter regions inside the field of view. As an example, we present in Fig. 2 the TAI plot
for the mean Doppler velocity at the range of 192 km which is optimal for aspect sensitive scatter near 105-km altitude. As seen, the echo region between azimuths of about –20° to –10° starting at scan number 10 moves eastwards to between azimuths of about 0°to 10°at scan number 30. There also appears to be westward motion of scatter starting at ~20°azimuth and scan number 10 and moving to an azimuth of ~0°and scan number close to 40. Another point of interest is that all four frequency plots have very similar velocity distributions.
3.2 Doppler spectra and statistics
Inspection of numerous Doppler spectra indicates that they have similar shapes for all four radar frequencies and are often skewed and multipeaked. This may be an indication of echoes coming from different irregularity types, for example, regions of secondary and primary wave scattering in different dynamic locations.
Before discussing some statistical trends present in the data we comment briefly on primary and secondary irregularities, a notion used widely in E-region studies (e.g., Fejer and Kelley, 1980). Note that primary waves, which are generated directly by the combined action of the two-stream and gradient-drift instability (e.g. Farley and Fejer, 1975), are identified by narrow peaks at large Doppler velocities, whereas secondary waves, which are associated with a turbulent cascade from long wave-lengths to short, are characterised by broad power spectra centred around zero Doppler shift. Often in
E-region scatter these two irregularity types are observed
simultaneously by the radar, as a result of temporal and/ or spatial averaging, which in turn gives a composite, often asymmetric and multipeaked, Doppler spectrum.
As shown in detail by Bourdillon et al. (1995), in the presence of intense night-time sporadic-E-layers that contribute destabilising electron density gradients per-pendicular to the goemagnetic field, B, the plasma is susceptible to direct decametre plasma wave generation by the gradient drift instability even if electric fields are only a few mV/m. The presence of both primary and secondary irregularities in the mid-latitude decametre wavelength backscatter was verified clearly in a recent Doppler spectrum study of SPOREX-93 data presented by Haldoupis et al. (1996a). These authors showed that the situation of mid-latitude decametre waves is at times analogous with that of type-1 and type-2 irregularities seen at 50 MHz in the equator. A noticeable difference is that at mid-latitudes the primary waves propagate at speeds well below that of equatorial type-1 waves because of reduced instability thresholds caused by the sharp destabilising density gradients present during intense Es conditions. Another difference is that spectra
associated with secondary mid-latitude waves are nar-rower, compared to equatorial ones, presumably
be-cause of lower levels of turbulence due to weaker driving terms in the instability process, for example fairly weak electric fields.
In the following statistical study all 48 scans were used from 01:17:12 to 04:19:43 UT 6 July 1995. The data in this file were nearly free of manmade interference and the scatter was at all four frequencies coming from approximately the same scattering volume, that is, differential refraction effects were, most likely, not important here. The spectral parameters of signal intensity, spectrum width and skewness are plotted against Doppler velocity for all four frequencies and appear in Fig. 3 as x-y scatter plots.
An inspection of power versus mean-velocity scatter plots (top of Fig. 3) shows mostly negative velocities (motions away from the radar). This is consistent with the observations made before by Bourdillon et al. (1995) and at 50 MHz by Haldoupis and Schlegel (1993), and is attributed to prevailing eastward ambient electric fields in most of the night-time sector. The power versus mean-velocity scatter plots are similar for all four frequencies, although a trend for the scatter intensity to decrease with increasing frequency is clear in the data. A noticeable difference is seen, however, at 9.23 MHz, where a subset of low-intensity points (< 10 dB) has relatively large negative velocities (< –50 m/s). These could be due to gradient-drift primary waves which, as shown in detail by Bourdillon et al. (1995), are generated more easily at lower than higher frequencies in the presence of strong destabilising density gradients even if electric fields are only a few mV/m.
The preference for negative mean velocities is also seen in the mean-width versus mean-velocity plots. These plots also indicate that as the width increases the mean velocity attains lower values towards zero; this trend, however, becomes less pronounced as we move from lower to higher frequencies. We also note that the large velocity points at 9.23 MHz correspond to rather broad spectra (widths close to 150 m/s) which suggests composite spectra possibly as the result of backscatter mixture from primary and secondary waves; this hypothesis is also supported by the strongly positive skewness observed during the same time, as we will discuss.
The scatter plots of skewness versus mean velocity (bottom of Fig. 3) clearly show a linear relationship passing through the origin; again, this trend is more pronounced at lower than at higher frequencies. These plots indicate that when velocity is negative (positive) skewness is positive (negative), whereas for near-zero Doppler shifts the skewness is close to zero, that is, the spectrum is nearly symmetric. An explanation for this may be the mixing of scatter from primary and secondary waves which results in a composite asymmet-ric spectrum with a tail towards lower Doppler shifts. Finally, the changes with frequency can be explained by
Fig. 1. Colour plots for scan 12 (01:59:48 UT 6 July 1995 ) showing the four radar frequencies for the mean total backscatter power Fig. 2. Colour plots for a fixed range of 192 km (01:17:12 to 04:19:14 UT 6 July 1995) showing the four radar frequencies for mean spectral
velocity b
Fig. 3. Statistical (scatter) plots o f the spectral p arameters for a ll four radar frequencies. The number a t the top right corner is the number o f points. See text for details
the fact that gradient-drift primary waves are more easily excited at lower rather than higher frequencies.
3.3 Ionosonde data
A qualitative comparison was made between the radar and ionosonde observations for the period from ~19:00 UT 5 July to ~04:30 UT 6 July 1995. For the few grid cells above the ionosonde, backscatter occurred from ~02.00 to 03.00 UT only. The ionograms indicated ‘weak’ intermittent occurrences of sporadic-E up until ~01:00 UT. After this time Escame in strong and it was
observed on all the ionograms up until ~04:00 UT with its bottom surface at about 100–110 km. Then the Es
disappears for about 20 min and then reappears as a much narrower and fainter Es-layer.
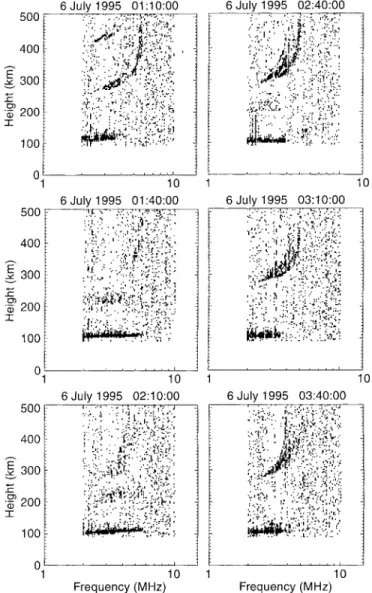
Sample ionograms for the period 01:00–04:00 UT are shown in Fig. 4. The ionograms from 02:00 to 03:00 UT indicate broad Es layers with top frequencies ftEs
between 4 and 8 MHz, while for an hour immediately before and after this period the ionograms indicate ‘weaker’ Es-layers with ftEs usually near 4 MHz,
although some were as high as 6 MHz. A comparison between the backscatter and the ionosonde data was also made for the next day (6–7 July) and again similar results were obtained. This seems to indicate that the presence of Es does not mean that the HF radar will
simultaneously observe scatter, a conclusion that agrees with similar findings by Yamamoto et al. (1992). This could mean that for the radar echoes to occur there must be some critical conditions in the Es-layer so that acting
parameters, that is, density gradients, electric fields, layer height etc., do combine to destabilise the plasma.
A noticeable characteristic of Es, especially during
the time of maximum echo occurrence from about 02:00 to 03:00 UT, was the patchiness and apparent transpar-ency of the layer that allowed clear detection during this period of the F-region trace. This means that Es was
fairly inhomogeneous in the horizontal plane, which implies the possible presence of strong horizontal density gradients with significant components perpen-dicular to B, especially if they are directed more along the zonal direction. These gradients could contribute decisively to plasma destabilisation. Also, the Es
patch-iness may be necessary for setting up large zonal electric fields inside the dense-layer patches as a result of a local polarisation process proposed recently by Haldoupis
et al. (1996b). This zonal field is similar in nature to the
equatorial electrojet polarisation field (e.g. Kelley, 1989) and can arise when dense and patchy night-time sporadic-E-layers have sharp discontinuities in conduc-tivity and the right geometry relative to the magnetic field. These zonal fields combined with parallel density gradients can excite primary gradient drift waves prop-agating mostly in the north-south direction. This pos-tulation seems to be in agreement with the Valensole
E-region echoes (both SPOREX-93 and -95) which occur
overwhelmingly at ±15° in the azimuthal sector about magnetic north.
4 Summary and concluding comments
This paper describes the Valensole HF radar which was configured during the summer of 1995 to observe backscatter from decameter-scale plasma irregularities simultaneously at four radar frequencies in the mid-latitude E-region. The motivation behind this experi-ment was to study the dependence of various observed quantities with frequency and compare the results to theory. To this end, a preliminary analysis has been performed in which all aspects of the experimental data have been introduced, but not fully explored, a task presently under way.
In this paper the analysis was based on a 3-h post-midnight period of backscatter recordings that were detected simultaneously on all four radar frequencies. It
Fig. 4. Ionograms during a period of intense HF backscatter from
~01:00 to 04:00 UT 6 July 1995 obtained with a digital ionosonde located at Termignon (~18°azimuth, ~200-km range with respect to the Valensole HF radar). The detection of the F-region traces during Valensole backscatter occurrence suggests that Es is strongly
transparent at these times, which implies irregular electron-density structuring and thus electron-density gradients in the horizontal plane G. C. Hussey et al.: E-region mid-latitude decametre irregularities observed at four radar frequencies 923
was found that scatter was more prevalent, that is, stronger, more frequent and more extended in space, at the lower radar frequencies than at the higher ones. Inspection of the Doppler spectra showed skewed and structured spectra which are possibly the result of temporal and/or spatial averaging of signals scattered by primary and secondary waves. This idea of an asymmetric, composite spectrum of primary and sec-ondary wave scattering is consistent with the depen-dences seen in the plots of skewness versus velocity and width versus velocity. It is important to stress that in the presence of intense Es-layers, which are known to be
closely connected with mid-latitude scatter, it is possible to have easy excitation of gradient-drift decametre plasma waves even if electric fields are as small as 2–4 mV/m. The trends seen in the data, and attributed to the superposition of backscatter from primary and second-ary waves, become less pronounced as the frequency increases, for example the spectra are less skewed at 16 than at 9 MHz. This agrees with linear theory which predicts that longer wavelength gradient drift waves are more easily excitable than shorter wavelength waves.
Finally, the hypothesis that sporadic-E-layers are responsible for the HF-radar scatter was to a first order supported by the comparison between Valensole radar and simultaneous ionosonde data. Also, it was argued that the strong patchiness of Esobserved during times of
strong echo occurrence is possibly necessary for dec-ametre plasma-wave generation, because under these Es
conditions there may exist strong horizontal density gradients and local polarisation fields that combine to excite the gradient-drift instability.
We would like to stress that this paper presents only a preliminary investigation of the multifrequency mid-latitude backscatter observations made with the Valen-sole radar and does not explore all scientific aspects of the data, because the analysis of the enormous data base is very time consuming and was thus incomplete at the time of the Lindau workshop. With the analysis work progressing, we aim mainly to establish the k-depen-dences of measured parameters like relative signal intensity and spectrum width and compare these to theory. In this task it is important to be able to use carefully selected criteria in order to separate the respective echoes associated with primary and secondary waves. Another study would involve a comparison of the HF-radar data with the support ionosonde, both
ionograms and fixed frequency angle of arrival mea-surements.
Acknowledgements. The Valensole radar and its operation is
supported by the Universite´ de Paris VI and CNRS. The authors are grateful for the assistance of Michel Six and the Valensole technician Jacques Legros. Also partial support for the completion of this work was provided by the French-Greek collaborative program PLATON project number 184340 L.
Topical Editor thanks D.T. Farley for his help in evaluating this paper.
References
Bourdillon, A., C. Haldoupis, and J. Delloue, High-frequency
Doppler radar observations of magnetic aspect sensitive irreg-ularities in the mid-latitude E region ionosphere, J. Geophys.
Res., 100, 21 503–21 521, 1995.
Farley, D. T., Theory of equatorial electrojet waves: new
develop-ments and current status. J. Atmos. Terr. Phys., 47, 729–744, 1985.
Farley, D. T., and B. G. Fejer, The effect of the gradient-drift
instability on the type-1 electrojet irregularities, J. Geophys.
Res., 80, 3087–3090, 1975.
Fejer, B. G., and M. C. Kelley, Ionospheric irregularities, Rev. Geophys., 18, 401–454, 1980.
Haldoupis, C., and K. Schlegel, A 50-MHz radio Doppler
exper-iment for mid-latitude E-region coherent backscatter studies. System description and first results, Radio Sci., 28, 959–978, 1993.
Haldoupis, C., A. Bourdillon, M. Six, and J. Delloue, Midlatitude E-region coherent backscatter at two HF radar frequencies, J. Geophys. Res., 101, 7961–7971, 1996a.
Haldoupis, C., K. Schlegel, and D. T. Farley, An explanation for
type-1 echoes from the midlatitude E-region ionosphere,
Geophys. Res. Lett., 23, 97–100, 1996b.
Kelley, M. C., The Earth’s Ionosphere: Plasma Physics and Electrodynamics, Academic, San Diego, Calif., 1989.
Pfaff, R. F., M. C. Kelley, E. Kudeki, B. G. Fejer, and K. D. Baker,
Electric field and plasma density measurements in the strongly driven daytime equatorial electrojet. 1. The unstable layer and gradient drift waves, J. Geophys. Res., 92, 13 578–13 596, 1987.
Riggin, D., W. E. Swartz, J. F. Providakes, and D. T. Farley, Radar
studies of long-wavelength waves associated with midlatitude sporadic-E-layers, J. Geophys. Res., 91, 8011–8024. 1986.
Six, M., J. Parent, A. Bourdillon, and J. Delloue, A new multibeam
receiving equipment for the Valensole skywave HF radar: Description and Applications, IEEE Trans. Geosci. Remote
Sensing, 34, 708–719, 1996.
Yamamoto, M., S. Fukao, T. Ogawa, T. Tsuda, and S. Kato, A
morphological study on mid-latitude E-region field-aligned irregularities observed with the MU radar, J. Atmos. Terr.