HAL Id: hal-00317875
https://hal.archives-ouvertes.fr/hal-00317875
Submitted on 13 Oct 2005
HAL is a multi-disciplinary open access
archive for the deposit and dissemination of
sci-entific research documents, whether they are
pub-lished or not. The documents may come from
teaching and research institutions in France or
abroad, or from public or private research centers.
L’archive ouverte pluridisciplinaire HAL, est
destinée au dépôt et à la diffusion de documents
scientifiques de niveau recherche, publiés ou non,
émanant des établissements d’enseignement et de
recherche français ou étrangers, des laboratoires
publics ou privés.
Numerical simulation of mid-latitude ionospheric
E-region based on SEEK and SEEK-2 observations
T. Yokoyama, M. Yamamoto, S. Fukao, T. Takahashi, M. Tanaka
To cite this version:
T. Yokoyama, M. Yamamoto, S. Fukao, T. Takahashi, M. Tanaka. Numerical simulation of
mid-latitude ionospheric E-region based on SEEK and SEEK-2 observations. Annales Geophysicae,
Euro-pean Geosciences Union, 2005, 23 (7), pp.2377-2384. �hal-00317875�
SRef-ID: 1432-0576/ag/2005-23-2377 © European Geosciences Union 2005
Annales
Geophysicae
Numerical simulation of mid-latitude ionospheric E-region based on
SEEK and SEEK-2 observations
T. Yokoyama1,3, M. Yamamoto1, S. Fukao1, T. Takahashi2, and M. Tanaka2 1Research Institute for Sustainable Humanosphere, Kyoto University, Kyoto, Japan 2Information Science Laboratory, Tokai University, Kanagawa, Japan
3now at: Solar-Terrestrial Environment Laboratory, Nagoya University, Aichi, Japan
Received: 20 December 2004 – Revised: 10 June 2005 – Accepted: 13 July 2005 – Published: 13 October 2005 Part of Special Issue “SEEK-2 (Sporadic-E Experiment over Kyushu 2)”
Abstract. Observational campaigns of the mid-latitude iono-spheric E-region with sounding rockets and ground-based in-struments were conducted in 1996 (SEEK) and 2002 (SEEK-2). Both of them were successfully conducted to bring im-portant findings about the mid-latitude E-region and quasi-periodic (QP) VHF radar echoes. The observational results in the SEEK and the SEEK-2 are compared with numeri-cal simulations and discussed in this paper. While
sporadic-E (Es)-layers are actually formed by the observed neutral
wind, it is difficult for the constant wind shear to produce the sharp Es-layer gradient. However, once they are formed in
the lower E-region, they cannot easily be dissipated by the simple diffusive motion. The polarization electric field, cal-culated under the condition at the rocket launch time, shows similar amplitude and structure to the measurement around the Es-layer altitude. The structure of the plasma density and
the electric field above the Es-layer observed in the SEEK-2
showed a wave-like pattern up to an altitude of 150 km. Con-sidering a mapping of the polarization electric field generated within the Es-layers, gravity waves are the possible source
of the wave-like structure of the measured electric fields and sub-peaks of the electron density above the main Es-layers.
Fluctuation of the measured magnetic field is reproduced by Hall or field-aligned current driven by the polarization elec-tric field. The current theoretical models for QP echoes and the polarization electric field are basically verified by the dis-cussion in this paper.
Keywords. Ionospheric irregularities – Mid-latitude iono-sphere – Numerical simulation studies
1 Introduction
Quasi-periodic (QP) echoes associated with sporadic-E (Es)
layers in the mid-latitude E-region have been intensively
Correspondence to: T. Yokoyama
studied since the first discovery with the MU radar (Ya-mamoto et al., 1991). QP echoes tend to appear above about an altitude of 100 km in the post-sunset period dur-ing the summertime and usually have striated structures in range-time-intensity (RTI) plots. Most plasma irregularities in the mid-latitude E-region are believed to be produced by gradient-drift instability induced by steep plasma den-sity gradient of Es-layers (e.g. Ecklund et al., 1981).
Re-cent studies have proposed that the polarization electric field associated with horizontal inhomogeneity of an Es-layer
plays an important role in the generation of QP echoes (Hal-doupis et al., 1996; Tsunoda, 1998; Maruyama et al., 2000). Altitude-modulated or inhomogeneous structure of Es-layers
has observationally been shown in association with the ap-pearance of QP echoes (Ogawa et al., 1998, 2002). Electri-cal coupling between the E and the F -regions should also be important for the generation of the polarization electric field (Cosgrove and Tsunoda, 2003, 2004; Cosgrove et al., 2004; Yokoyama et al., 2004a). Neutral dynamics in the lower ther-mosphere should also be important for the E-region plasma irregularities. Kagan and Kelley (1998, 2000) and Kagan (2002) first proposed wind-driven gradient-drift and thermal mechanisms for E-region irregularities. Kagan and Kelley (1998) showed that both sides of an Es-layer can be
unsta-ble by neutral wind shear to produce the Es-layer. Larsen
(2000) suggested that the shear instability should frequently occur at the lower E-region and modulate Es-layers to
initi-ate gradient-drift instability.
Two observational experiments with sounding rockets and ground-based instruments were conducted in 1996 and 2002, which are called the SEEK (Sporadic-E Experiment over Kyushu) and the SEEK-2 campaigns, respectively (Fukao et al., 1998; Yamamoto et al., 2005). Two sounding rock-ets were successfully launched in each campaign (S-310-25 and S-310-26 in the SEEK, and S-310-31 and S-310-32 in the SEEK-2), and brought important findings about the mid-latitude E-region. Electron density measurements revealed that the Es-layers were not deeply modulated, as suggested
2378 T. Yokoyama et al.: Simulation based on SEEK and SEEK-2 by Woodman et al. (1991) and Tsunoda et al. (1994) but
horizontally stratified around 100 km and that several sub-peaks were detected above the main Es-layer (Yamamoto
et al., 1998; Wakabayashi et al., 2005). Neutral wind ve-locity measured by trimethyl aluminum (TMA) release ex-periments showed a maximum magnitude of 150 m/s and a strong shear, which was in good agreement with the alti-tude of the main Es-layer (Larsen et al., 1998, 2005). The
measured electric field in the SEEK exceeded 10 mV/m with small-scale fluctuations of 5–10 mV/m below 130 km (Pfaff et al., 1998). In the SEEK-2, on the other hand, the fluctu-ated electric field was detected only below 108 km, with the maximum amplitude of about 5 mV/m (Pfaff et al., 2005). At higher altitudes, there was sinusoidal variation of the electric field with a wavelength of 15–20 km in both measurements. Pfaff et al. (1998) interpreted the variation as due to atmo-spheric gravity waves.
It has been confirmed with numerical simulations that the large polarization electric field can be generated in as-sociation with inhomogeneous Es-layers or a neutral wind
shear (Hysell et al., 2002; Cosgrove and Tsunoda, 2003; Yokoyama et al., 2003, 2004a). QP structures of plasma den-sity in the E-region can be produced through the polariza-tion electric field by atmospheric gravity waves, even if the
Es-layer does not initially contain inhomogeneous structures
(Yokoyama et al., 2004b). However, quantitative comparison between rocket measurements and numerical simulations has never been conducted. In this paper, we study the genera-tion of QP echoes in the mid-latitude E-region, comprehen-sively based on the direct measurements in the SEEK and the SEEK-2 and numerical simulations. We pay attention to the striking observational results during the QP echo appearance from SEEK and SEEK-2:
1. neutral wind shear associated with Es-layers (Larsen
et al., 1998, 2005),
2. sub-peaks of electron density above the main Es-layers
(Yamamoto et al., 1998; Wakabayashi et al., 2005), 3. wave structure of the electric field (Pfaff et al., 1998,
2005), and
4. fluctuation of the magnetic field.
2 Model description
The numerical model applied in this study is based on that of Yokoyama et al. (2004b), who uses the three-dimensional Cartesian coordinate in which the geomagnetic field is in the meridional-vertical plane with a dip angle of 45◦. The in-tegrated F -region conductivity is applied at the top bound-ary (140 km) and periodic boundbound-ary conditions are applied in both horizontal directions. Positive ions are divided into metallic and molecular species of Fe+ and NO+,
respec-tively. The momentum equation for each species is written as qj Mj(E + Vj ×B) − kBT Mj ∇Nj Nj +νi(U − Vj) =0, (1)
where the subscript j denotes the species (NO+, Fe+, and electrons), q is the charge including its sign, M is the mass,
E is the electric field, V is the velocity, B is the geomagnetic
field with |B|=4.6×10⁻⁵T, kBis the Boltzmann constant, T
is the plasma temperature, N is the density, ν is the collision frequency with neutrals, and U is the neutral wind veloc-ity. Gravity and inertial terms are neglected. The continuity equations of the ion species are calculated separately, which are written as
∂NFe+
∂t + ∇ ·(NFe+VFe+) =0 (2) ∂NNO+
∂t + ∇ ·(NNO+VNO+) = P − αNNO+Ne, (3)
where P and α are the production rate and the recombination coefficient of NO+, respectively (Yokoyama et al., 2004b), and Ne (=NFe++NNO+) is the electron density. Production and recombination of Fe+are neglected and only the trans-port of Fe+is taken into account. The polarization electric field is obtained to satisfy a divergence that is free of current as
∇ ·J = ∇ · [eN (Vi−Ve)] = 0 (4)
where, for simplicity, the motion of positive ions Vi is
treated as a single fluid by assuming in Eq. (1) that Vj=Vi, Nj=Ne, and Mi=(MFe+NFe++MNO+NNO+)/Ne. MSISE-90 and IRI-95 models are used for background and bound-ary conditions of the neutral atmosphere and the ionosphere (Hedin, 1991; Bilitza et al., 1993).
3 Numerical results and comparison with observations 3.1 Formation of Es-layer
At first we simulate the formation and diffusion of Es-layers
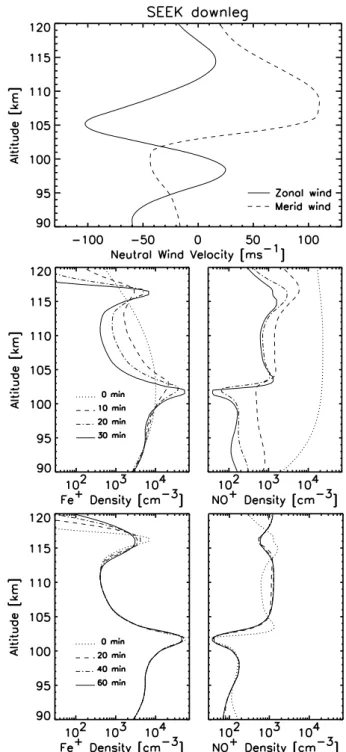
by applying the neutral wind observed in SEEK and SEEK-2 with a grid spacing of 250 m. The top panel of Fig. 1 shows the neutral wind observed in SEEK, which is interpolated for the simulation grid points. The initial NO+ density is
cho-sen at a pre-sunset period from the IRI-model, while Fe+is
assumed to have a broad Gaussian distribution with a peak at 102 km (dotted lines in the middle panel of Fig. 1). The middle panels of Fig. 1 show time variation of Fe+and NO+ density produced by the neutral wind shown in the top panel. Fe+is accumulated by the neutral wind at 102 and 117 km, where the zonal wind changes from eastward to westward with increasing altitude. These Fe+peaks are well correlated to the plasma density structures observed in SEEK. Since the vertical motion of ions due to the zonal wind is large at higher altitude, the smaller zonal wind shear at 117 km (10 m/s/km)
can produce the comparable plasma density gradient to that at 102 km (60 m/s/km). NO+, on the other hand, is largely
influenced by the recombination process (right-hand side of Eq. (3)). At the peaks of Fe+, NO+density depleted because of enhanced recombination due to the increased Ne. In order
to see a diffusion effect on plasma density, plasma is left for 1 h with stopping the neutral wind after a 30 min accumula-tion, as shown in the bottom panels of Fig. 1 (the solid lines in the middle panels correspond to the dotted lines in the bot-tom panels). Since diffusion is inversely proportional to the ion-neutral collision frequency, diffusion of the peak of Fe+ at 117 km is much faster than that at 102 km. While the peak density after 1 hour at 117 km is decreased to 45% of the ini-tial value, the peak at 102 km is still 83%. Once Es-layers are
formed at around 100 km, they can persist for several hours and cannot easily be dissipated by the simple diffusive mo-tion. NO+, on the other hand, reached chemical equilibrium
within the first 20 min and kept the nighttime background density of the order of 103cm−3. Compared with the electron density measured by the rockets (Yamamoto et al., 1998), the main peak detected at around 100 km is reproduced by the main zonal wind shear. The peak and background densities are also comparable to the observed values. However, many sub-peaks detected with the rocket above 100 km could not be reproduced by the simulation as long as the neutral wind did not vary for 30 min. The plasma density structure above the main Es-layer is not simply formed by the local wind
shear but, for example, by polarization electric fields, as dis-cussed later (e.g. Yokoyama et al., 2003).
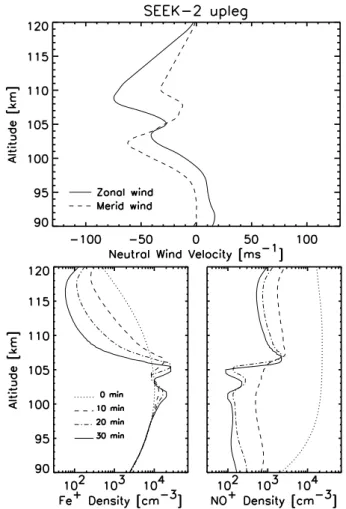
Figures 2 and 3 show the neutral wind observed in the SEEK-2 (Larsen et al., 2005) and plasma density profiles produced by the simulation for the upleg and downleg, re-spectively. Since the neutral wind was obtained only up to 110 km, we linearly extrapolated the wind by assuming no wind at 120 km. Although the neutral wind profiles from the upleg and downleg look quite different, plasma densities produced by both winds show similar structures, namely, the main peak at 106 km and the sub-peak at 101 km. Another sub-peak is produced at 98 km by the extremely large zonal wind shear observed in the downleg. While the reproduced multi-peak structure looks consistent with the electron den-sity measurement around the main Es-layer (Wakabayashi et
al., 2005), a sharp gradient of the Es-layer cannot be
repro-duced in the simulation. It is inferred that the main Es-layers
observed in both rocket experiments should be produced by the zonal wind shear which was also observed with rockets. However, the plasma density profiles cannot fully be repro-duced only by applying the constant neutral wind. The spa-tial and time variation of the neutral wind which is expected from the upleg and downleg in SEEK-2 should play an im-portant role in producing Es-layers.
3.2 Amplitude of polarization electric field
Yokoyama et al. (2004a) have shown that neutral winds gen-erate polarization electric fields effectively in the lower E-region when an Es-layer contains zonally-elongated
higher-Fig. 1. Neutral wind profiles observed in SEEK which are
inter-polated for the simulation grid points (top), plasma density profiles produced by the neutral wind every 10 min (middle), and diffusion of the plasma after stopping the neutral wind every 20 min (bottom).
density plasma clouds. We can verify this mechanism by comparing the neutral wind and the electric field data from the SEEK-2 campaign with those of our numerical simu-lation. As mentioned above, the observed neutral winds and electron density profiles are qualitatively consistent with each other. We use a simple model of a horizontal structure of Es-layers that is the same as that used by Yokoyama et al.
2380 T. Yokoyama et al.: Simulation based on SEEK and SEEK-2
Fig. 2. Same as top and middle panels of Fig. 1 but for the upleg of
the SEEK-2.
background Es-layer during the SEEK-2 rocket experiment.
The Es-layer is then located at 103 km and the plasma
den-sity is set to satisfy the critical frequency foEs=7.2 MHz and
the blanketing frequency fbEs=2.2 MHz, which were
de-rived from the simultaneous ionogram at Yamagawa, 40 km west of the rocket range. The neutral wind observed with the TMA release experiment during the upleg is applied. Other conditions are adopted from the IRI-model at the rocket launch time. The grid spacing is 500 m which is the same as Yokoyama et al. (2004a). Figure 4 shows the generated polar-ization electric fields on the meridional-vertical plane (top) and the horizontal plane (bottom). Background gray scales represent plasma density in the sliced 2-D planes, and arrows represent the polarization electric fields. The value shown at the upper right corner indicates the maximum value which corresponds to the longest arrow. Since the southward neu-tral wind is dominant at the Es-layer altitude, the
polariza-tion electric fields are mainly directed northward and slightly westward, with a maximum amplitude of 5.5 mV/m through the same mechanism as Yokoyama et al. (2004a). This be-havior roughly agrees with the observed electric field around 100 km by the S-310-31 rocket (Pfaff et al., 2005). In Fig. 4, we can find that the electric fields are oppositely directed at
Fig. 3. Same as Fig. 2 but for the downleg of SEEK-2.
western and eastern edges of the plasma cloud. From the ex-periment, Pfaff et al. (2005) reported some sudden changes in the direction of the electric field at 115, 128, and 139 km, which may be due to the steep plasma density gradient at the edge of the plasma cloud. The southwestward or southeast-ward electric field observed above 108 km, however, cannot be explained only by assuming this simple plasma structure and the uniform neutral wind. The observed complicated electric fields imply that Es-layers contain various shapes of
plasma clouds. Considering the large variability of the neu-tral winds during the upleg and downleg in SEEK-2 (Larsen et al., 2005), we should expect that neutral winds are not hor-izontally uniform but turbulent, with a scale of several tens of kilometers. Spatial structure of the Es-layers should also
be essential to determine the polarization electric field. 3.3 Modulation by gravity waves
Yokoyama et al. (2004b) showed that gravity waves gen-erated in the troposphere can modulate an Es-layer
signif-icantly and produce polarization electric fields of several mV/m. We use this simulation result to discuss an electric-field mapping effect above the main Es-layers. Figure 5
Electric Field 0 [sec] y = 30 [km] 0 10 20 30 40 50 60 South -- North [km] 80 90 100 110 120 130 140 Altitude [km] 0.00550272 ^^ Plasma Density 103104105106 [cm-3] Electric Field 0 [sec]
z = 103 [km] 15 20 25 30 35 40 45 West -- East [km] 15 20 25 30 35 40 45 South -- North [km] 0.00546572 ^^ Plasma Density 103104105106 [cm-3]
Fig. 4. Electric field generated with the condition obtained in the
SEEK-2 campaign. The plasma cloud is assumed as to be a rod-like structure, as used in Yokoyama et al. (2004a). Background gray-scale contours represent plasma density in the sliced 2-D planes, and arrows represent the polarization electric fields.
shows the polarization electric fields generated in the Es
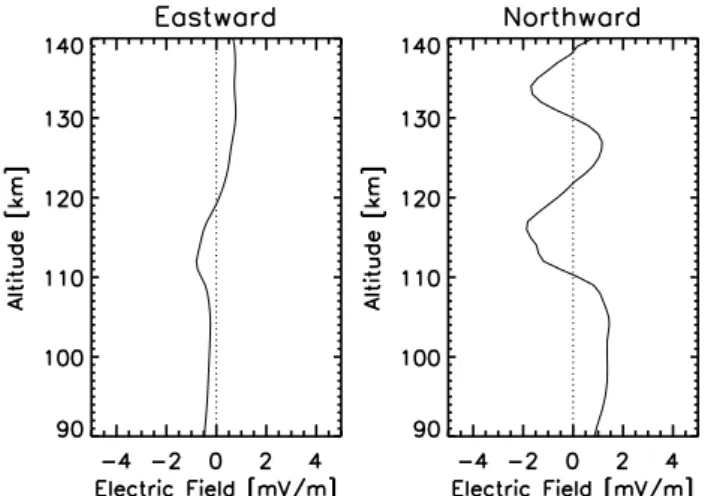
-layer mapped to the upper E-region and the produced plasma density structure aligned from northwest to southeast. The horizontal domain was 192 km×192 km with a grid spac-ing of 1 km. Such polarization electric fields are expected to give the vertical wave-like structure of the electric fields and the multi-peak of the plasma density observed in SEEK and SEEK-2. Figure 6 shows an example of a profile of the polarization electric field obtained from the simulation at
t =3600 s of Yokoyama et al. (2004b) (Fig. 5). The polariza-tion electric field, especially in the meridional component, shows sinusoidal modulation above 110 km. The polariza-tion electric fields generated by gravity waves at the lower
E-region map along the geomagnetic field, then the high-altitude variation is produced. Since the geomagnetic field is
Electric Field 3600 [sec]
z = 120 [km]
0 50 100 150 West -- East [km] 0 50 100 150 South -- North [km] 0.00283652 [cm-3] 2x10² 4x10² 103 2x10³ 5x10³Fig. 5. Plasma density distribution (background) and the
polar-ization electric field (arrows) on the horizontal plane at 120 km at 3600 s, after applying the gravity waves propagated from the lower atmosphere. (Reproduced from Yokoyama et al. (2004b).)
Fig. 6. Profiles of each component of the electric field obtained
from the simulation at t=3600 s of Yokoyama et al. (2004b).
assumed to be inclined 45◦, the vertical wavelength can be interpreted as the horizontal one, corresponding to the hori-zontal structure of the plasma density shown in Fig. 5. This structure of the polarization electric field looks very simi-lar to the observed electric fields. It is thus confirmed that the variation of electric fields should be due to the horizon-tal structure of gravity waves. Figure 7 shows a profile of the plasma density obtained from the simulation at the same position of Fig. 6. While the main Es-layer is formed by
the zonal wind shear at 105 km, another peak is formed at 130 km by the polarization electric field. At altitudes of 95, 97, 100, 110, 114, 122 km, there are step-like structures in the profile. Considering the coarse vertical resolution of the simulation, they can be an indication of minor peaks of the
2382 T. Yokoyama et al.: Simulation based on SEEK and SEEK-2
Fig. 7. A profile of the plasma density obtained from the simulation
at t=3600 s of Yokoyama et al. (2004b).
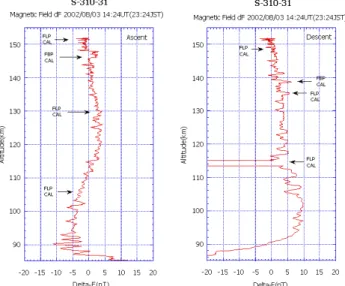
Fig. 8. Magnetic field fluctuation observed with magnetic field
mea-surement (MGF) on board the S-310-31 rocket. Black arrows indi-cate the interference from the calibration signals of other instru-ments on board the same rocket.
Es structures. In SEEK-2, several minor peaks of electron density were detected above the main Es-layer (Wakabayashi
et al., 2005), which can be produced by polarization electric fields.
3.4 Fluctuation of magnetic field
The magnetic field measurement (MGF) on board S-310-31 detected the fluctuations, as shown in Fig. 8. Major fluctu-ations of the magnetic field are found at 102 km in the up-leg, and at 107 km in the downleg. Minor fluctuations of
±1∼2 nT distribute wide above the main Es-layer altitudes.
Here we investigate whether such magnetic-field fluctuations are physically meaningful or not. From the simulation we calculate the current associated with the polarization electric field shown in Fig. 4. The magnetic field B is generated by
Magnetic Field 0 [sec] y = 30 [km] 0 10 20 30 40 50 60 South -- North [km] 80 90 100 110 120 130 140 Altitude [km] 4.46224e-09 ^^ Plasma Density 103104105106 [cm-3]
Magnetic Field 0 [sec] z = 110 [km] 15 20 25 30 35 40 45 West -- East [km] 10 15 20 25 30 35 40 South -- North [km] 1.48791e-09 ^^ Plasma Density 103104105106 [cm-3]
Fig. 9. Magnetic field produced by the current in the case of Fig. 4.
the current J from Amp`ere’s law as
∇ ×B = µJ . (5)
The magnetic vector potential A is defined as
B = ∇ × A. (6)
Combining these two equations,
∇ ×(∇ ×A) = ∇(∇ · A) − ∇2A = µJ . (7) Assuming ∇·A=0, we obtain
∇2A = −µJ , (8) where A is obtained from J in the simulation by solving the Poisson Equation (8), then B is calculated from Eq. (6). Fig-ure 9 shows the calculated magnetic field in the case of Fig. 4. In the meridional-vertical plane (top), the counterclockwise magnetic field due to the eastward Hall current is generated around the plasma cloud. The maximum amplitude of 4.5 nT is well comparable to the fluctuation detected in SEEK-2, as
shown in Fig. 8. In the horizontal plane at 110 km (bottom), rotating magnetic field due to the field-aligned current is gen-erated with a maximum of 1.5 nT. The magnetic-field fluctua-tions of several nanoteslas detected in SEEK-2 are physically meaningful, and strongly supports the proposed polarization mechanisms. The Hall current which flows within the Es
-layers is coupled with the upper E-region and even with the
F-region via the field-aligned current.
4 Discussion
The two rocket observations confirmed that Es-layers and
strong wind shears actually existed at the lower E-region when QP echoes were observed from the ground with VHF radars. We also confirmed by simulation that the observed wind shear accumulates plasma at the shear node and that once Es-layers are formed at the lower E-region, they are not
easily dissipated by the simple diffusive motion. However, only the constant zonal wind shear cannot produce sharp den-sity gradient effectively because of frequent collisions with neutrals, then ionization and distribution of atomic metals with a long lifetime should be important for the formation of Es-layers. Direct vertical transport of plasma via
colli-sions, for example, gravity waves or shear instability may also be important. When gravity waves propagate up to the E-region altitudes, the amplitude increases exponentially with decreasing of the atmospheric density, then the gravity waves should modulate the existing Es-layers. Shear
insta-bility may also modulate Es-layers directly in the lower
E-region (Larsen, 2000; Bernhardt, 2002). Although we do not have exact observational evidence whether shear instability can actually occur or not, the TMA trace released in SEEK-2 showed the billow-like structure which strongly supports oc-currence of the instability (Larsen et al., 2005). Such vertical transport of plasma can produce altitude-modulated or inho-mogeneous structures within Es-layers (Ogawa et al., 1998)
and polarization electric fields which can modulate the upper
E-region (Yokoyama et al., 2004b).
Comparing between the electric field measured in SEEK and SEEK-2, the amplitude frequently exceeds 10 mV/m and sometimes reaches more than 20 mV/m in SEEK, which is more than twice that measured in SEEK-2 (Pfaff et al., 1998, 2005). Fluctuating electric fields with large ampli-tude are seen up to 130 km in SEEK while up to 108 km in the SEEK-2. Considering these small-scale electric fields as those mapped from the lower E-region, the mapping dis-tance was shorter in SEEK-2 for small-scale fluctuation. It may be expected that solar activity variation, that is, vari-ation of conductivity of the F -region makes the difference in the electric field profiles. Yokoyama et al. (2004a) sug-gested that field-line integrated Pedersen conductivity of the
F-region (6PF) strongly affects the generation of the polar-ization electric field at the E-region and mapping along the geomagnetic field. They showed from numerical simulations that a mapping distance is much shorter in the large 6PF case, and an amplitude of the polarization electric field can be
larger in the small 6F
P case, up to the upper E-region. From
the ionosonde in Yamagawa, the critical frequencies of the
F-layer were 5.1 MHz and 8.8 MHz during the electric field measurements of SEEK and SEEK-2, respectively. The dif-ference in the measured electric fields in SEEK and SEEK-2 and the plasma density in the F -region are consistent with the numerical results of Yokoyama et al. (2004a). However, Yokoyama et al. (2004a) also showed that generation of the polarization electric field is strongly affected by the structure of the Es-layers itself. We need to take the horizontal
struc-ture of the Es-layers into consideration in a future study.
The sub-peaks of the electron density detected with the rocket measurements should be related to the mapping of the polarization electric field. The electric field can easily produce a plasma density structure at an altitude of about 120 km, where the Pedersen mobility of ions is maximum (Yokoyama et al., 2003). Given that all of the sub-peaks above the main Es-layer are produced by the polarization
electric field mapped from the Es-layer, the vertical structure
of plasma density is regarded as the horizontal structure of the polarization electric field. It can be due to the horizontal structure, or spatial periodicity on the horizontal plane of the
Es-layer which may be produced by shear instability or
grav-ity waves (Bernhardt, 2002; Yokoyama et al., 2004b). Such spatial periodicity can be a source of the QP radar echoes, as well as wave structures of the electric field and sub-peaks of the electron density.
5 Conclusions
The observational results from SEEK and SEEK-2 cam-paigns have been quantitatively discussed with numerical simulations. Es-layers which are essential for gradient-drift
instability are produced by zonal neutral wind shears. Inho-mogeneous Es-layers can be a source of large polarization
electric fields because of the difference between ion-neutral and electron-neutral collision frequencies. The generated po-larization electric field maps along the geomagnetic field up to the F -region and can produce a field-aligned plasma den-sity structure up to 120 km. The mechanism was also con-firmed by the comparison between the rocket measurement of the magnetic field and our numerical simulation. The
F-region conductivity can strongly affect the mapping effi-ciency and the amplitude of the polarization electric fields. The sub-peaks of electron density above the main Es-layer
observed with the rockets can be due to the mapped polar-ization electric field. Shear instability or gravity waves are the possible sources of the wave structure of the electric field and the sub-peaks of electron density. The mechanism to produce strong neutral winds and shears in the lower ther-mosphere is still unknown, however. The neutral wind mea-surements suggests that the shear instability actually occurs in the E-region (Larsen et al., 1998, 2005). More compre-hensive studies that include the neutral atmosphere, the E-region, and the F -E-region, are required in future.
2384 T. Yokoyama et al.: Simulation based on SEEK and SEEK-2
Acknowledgements. Computation in the present study was
per-formed with the KDK system of Research Institute for Sustainable Humanosphere (RISH) at Kyoto University as a collaborative re-search project. This work is supported by The Ministry of Educa-tion, Culture, Sports, Science and Technology of Japan under Grant-in-Aid for JSPS Fellows 14001700.
Topical editor M. Pinnock thanks T. Maruyama and another referee for their help in evaluating this paper.
References
Bernhardt, P. A.: The modulation of sporadic-E layers by Kelvin-Helmholtz billows in the neutral atmosphere, J. Atmos. Solar-Terr. Phys., 64, 1487–1504, 2002.
Bilitza, D., Rawer, K., Bossy, L., and Gulyaeva, T.: International reference ionosphere in: Past, present, and future, Adv. Space Res., 13, 3, 3–23, 1993.
Cosgrove, R. B. and Tsunoda, R. T.: Simulation of the nonlin-ear evolution of the sporadic-E-layer instability in the night-time mid-latitude ionosphere, J. Geophys. Res., 108(A7), 1283, doi:10.1029/2002JA009728, 2003.
Cosgrove, R. B. and Tsunoda, R. T.: Instability of the E−F coupled nighttime mid-latitude ionosphere, J. Geophys. Res., 109(A04305), doi:10.1029/2003JA010243, 2004.
Cosgrove, R. B., Tsunoda, R. T., Fukao, S., and Yamamoto, M.: Coupling of the Perkins instability and the sporadic E-layer instability derived from physical arguments, J. Geophys. Res., 109(A06301), doi:10.1029/2003JA010295, 2004.
Ecklund, W. L., Carter, D. A., and Balsley, B. B.: Gradient drift irregularities in mid-latitude sporadic E, J. Geophys. Res., 86, 858–862, 1981.
Fukao, S., Yamamoto, M., Tsunoda, R. T., Hayakawa, H., and Mukai, T.: The SEEK (Sporadic-E Experiment over Kyushu) campaign, Geophys. Res. Lett., 25, 1761–1764, 1998.
Haldoupis, C., Schlegel, K., and Farley, D. T.: An explanation for type 1 radar echoes from the mid-latitude E-region ionosphere, Geophys. Res. Lett., 23, 97–100, 1996.
Hedin, A. E.: Extension of the MSIS thermosphere model into the middle and lower atmosphere, J. Geophys. Res., 96, 1159–1172, 1991.
Hysell, D. L., Yamamoto, M., and Fukao, S.: Simulations of plasma clouds in the mid-latitude E-region ionosphere with implications for type I and type II quasiperiodic echoes, J. Geophys. Res., 107(A10), 1313, doi:10.1029/ 2002JA009291, 2002.
Kagan, L. M.: Effects of neutral gas motions on mid-latitude E re-gion irregular structure, J. Atmos. Solar-Terr. Phys., 64, 1479– 1486, 2002.
Kagan, L. M. and Kelley, M. C.: A wind-driven gradient drift mech-anism for mid-latitude E-region ionospheric irregularities, Geo-phys. Res. Lett., 25, 4141–4144, 1998.
Kagan, L. M. and Kelley, M. C.: A thermal mechanism for gen-eration of type-2 small-scale irregularities in the ionospheric E-region, J. Geophys. Res., 105, 5291–5303, 2000.
Larsen, M. F.: A shear instability seeding mechanism for quasi-periodic radar echoes, J. Geophys. Res., 105, 24 931–24 940, 2000.
Larsen, M. F., Fukao, S., Yamamoto, M., Tsunoda, R. T., Igarashi, K., and Ono, T.: The SEEK chemical release experiment: Ob-served neutral wind profile in a region of sporadic-E, Geophys. Res. Lett., 25, 1789–1792, 1998.
Larsen, M. F., Yamamoto, M., Fukao, S., and Tsunoda, R. T.: SEEK 2: Observations of neutral winds, wind shears, and wave struc-ture during a sporadic E/QP event, Ann. Geophys., 23, 2369– 2375, 2005.
Maruyama, T., Fukao, S., and Yamamoto, M.: A possible mecha-nism for echo-striation generation of radar backscatter from mid-latitude sporadic E, Radio Sci., 35, 1155–1164, 2000.
Ogawa, T., Sekito, N., Nozaki, K., and Yamamoto, M.: Height com-parison of mid-latitude E-region field-aligned irregularities and sporadic E-layer, Geophys. Res. Lett., 25, 1813–1816, 1998. Ogawa, T., Takahashi, O., Otsuka, Y., Nozaki, K., Yamamoto, M.,
and Kita, K.: Simultaneous middle and upper atmosphere radar and ionospheric sounder observations of mid-latitude E-region irregularities and sporadic E-layer, J. Geophys. Res., 107(A10), 1275, doi:10.1029/2001JA900176, 2002.
Pfaff, R., Yamamoto, M., Marionni, P., Mori, H., and Fukao, S.: Electric field measurements above and within a sporadic-E layer, Geophys. Res. Lett., 25, 1769–1772, 1998.
Pfaff, R., Freudenreich, H., Yokoyama, T., Yamamoto, M., Fukao, S., and Mori, H.: Electric field measurements of DC and long wavelength structures associated with sporadic-E layers and QP radar echoes Ann. Geophys., 23, 2319–2334, 2005.
Tsunoda, R. T.: On polarized frontal structures, type-1 and quasi-periodic echoes in mid-latitude sporadic E, Geophys. Res. Lett., 25, 2641–2644, 1998.
Tsunoda, R. T., Fukao, S., and Yamamoto, M.: On the origin of quasi-periodic radar backscatter from mid-latitude sporadic-E, Radio Sci., 29, 349–365, 1994.
Wakabayashi, M., Ono, T., Mori, T., and Bernhardt, P. A.: Electron density and plasma waves measurement in mid-latitude
sporadic-Elayer observed during the SEEK-2 campaign, Ann. Geophys., 23, 2335–2345, 2005.
Woodman, R. F., Yamamoto, M., and Fukao, S.: Gravity wave mod-ulation of gradient drift instabilities in mid-latitude sporadic E irregularities, Geophys. Res. Lett., 18, 1197–1200, 1991. Yamamoto, M., Fukao, S., Woodman, R. F., Ogawa, T., Tsuda,
T., and Kato, S.: Mid-latitude E-region field-aligned irregular-ities observed with the MU radar, J. Geophys. Res., 96, 15 943– 15 949, 1991.
Yamamoto, M.-Y., Ono, T., Oya, T., Tsunoda, R. T., and Larsen, M. F.: S. Fukao, and M. Yamamoto, Structures in
sporadic-E observed with an impedance probe during the SEEK cam-paign: Comparisons with neutral-wind and radar-echo observa-tions, Geophys. Res. Lett., 25, 1781–1784, 1998.
Yamamoto, M., Fukao, S., Tsunoda, R. T., Pfaff, R., and Hayakawa, H.: SEEK-2 (Sporadic Experiment over Kyushu 2) – Project out-line and significance, Ann. Geophys., 23, 2295–2305, 2005. Yokoyama, T., Yamamoto, M., and Fukao, S.: Computer
simu-lation of polarization electric fields as a source of mid-latitude field-aligned irregularities, J. Geophys. Res., 108(A2), 1054, doi:10.1029/2002JA009513, 2003.
Yokoyama, T., Yamamoto, M., Fukao, S., and Cosgrove, R. B.: Three-dimensional simulation on generation of polarization elec-tric field in the mid-latitude E-region ionosphere, J. Geophys. Res., 109(A01309), doi:10.1029/2003JA010238, 2004a. Yokoyama, T., Horinouchi, T., Yamamoto, M., and Fukao, S.:
Modulation of the mid-latitude ionospheric E-region by atmo-spheric gravity waves through polarization electric field J. Geo-phys. Res., 109(A12307), doi:10.1029/2004JA010508, 2004b.