vol.14 no.7 pp. 1285-1288, 1993
DNA adducts, cell proliferation and papilloma latency time in
mouse skin after repeated dermal application of DMBA and TPA
Wolfgang H.Fischer, Peter E.Beland
and Werner K.Lutz
1Institute of Toxicology, Swiss Federal Institute of Technology (ETH) and University of Zurich, CH-8603 Schwerzenbach, Switzerland
'To whom all correspondence should be addressed
The mouse skin tumor model was used to investigate whether
the level of DNA adducts and/or the rate of cell division in
the epidermis are indicators of the risk of cancer formation
for an individual in an outbred animal population. A high
risk was considered to be reflected by a short latency period
for the appearance of a papilloma. Female NMRI mice were
treated twice weekly with 2.5 nmol
7,12-dimethylbenz[a]an-thracene (DMBA) and 3 nmol
12-0-tetradecanoylphorbol-13-acetate (TPA) and the appearance of papillomas was
registered. The first papilloma appeared after 7.5 weeks.
After 17 weeks, when 12 of 14 mice had at least one
papilloma, an osmotic minipump delivering
5-bromo-2'-deoxyuridine (BrdU) was implanted into each mouse for 24
h. The mice were killed after 24 h and the epidermis was
analyzed for DMBA-nucleotide adducts by
32P-postlabeling,
for the cell number per unit skin length, and for the labeling
index for DNA synthesis. Unexpectedly, DMBA-nucleotide
adduct levels were highest in those animals which showed the
longest latency periods. Adduct levels were negatively
correlated with the labeling index, indicating that dilution of
adducts by cell division was a predominant factor in
determining average adduct concentrations. Individual
tumor-latency time was not correlated with either cell number
or labeling index. This could be due to the fact that the
measurements only provided averaged data and gave no
information on the specific situation in clones of premalignant
cells. Under the conditions of this assay, therefore, neither
DNA adduct levels nor information on the average kinetics
of cell division had a predictive value for the individual cancer
risk within a group of outbred animals receiving the same
treatment.
Introduction
The risk of an individual to develop a carcinogen-induced tumor
is dependent upon heritable and life-style factors that determine
carcinogen metabolism leading to DNA adducts and rates of DNA
repair and cell division (1). The question is whether one or the
other of these factors could be used as a predictive marker for
an individual cancer risk.
With the introduction of the
32P-postlabeling method, the
measurement of DNA adducts in human samples has become a
routine technique for biomonitoring exposure to carcinogens (2).
Attempts to correlate adduct levels with cancer risk, however,
have been hampered by the facts that (i) target tissue is not easily
•Abbreviations: DMBA, 7,12-dimethylbenz[a]anthracene; TPA, 12-0-tetradecanoylphorbol-13-acetate; BrdU, 5-bromo-2'-deoxyuridine.
© Oxford University Press
available and that (ii) 'individual cancer risk' is not well defined.
One study dealt with lung cancer patients undergoing surgery:
it was found that the patients who were <55 years old had a
higher level of DNA adducts in bronchial biopsies as compared
with the >55 year-old group (3). This finding could be
interpreted as if high adduct levels could be responsible for a
short latency period. Unfortunately, smoking habits in the weeks
before surgery were not reported for the two groups.
In this study, we investigated under experimental conditions
whether DNA adduct levels and/or rates of cell division in the
target tissue have a predictive value for the individual cancer risk.
The mouse skin tumor model of Hecker and coworkers (4) was
used. It allows a visual observation of the appearance of
papillomas. The individual tumor latency time can be used as
an indicator of the individual cancer risk. The mice were treated
repeatedly with 7,12-dimethylbenz[a]anthracene (DMBA*) as a
DNA adduct-forming carcinogen and
12-O-tetradecanoylphorbol-13-acetate (TPA) as a tumor-promoting agent affecting cell
division and differentiation. This combined treatment was
considered to best reflect chronic exposure of humans to both
genotoxic and nongenotoxic carcinogens. The hypothesis was
tested whether DNA adduct levels and/or rates of cell division
are highest in those animals where a skin papilloma is seen
earliest.
Materials and methods
Chemicals
The following sources were used: DMBA, acetone and proteinase K: Fluka AG, Buchs SG, Switzerland. TPA: LC Services Corporation (Wobum, MA, USA). [7-32P]ATP (7000 Ci/mmol): ICN. RNase A (R-5125), RNase T, (R-1003),
nuclease P, (N-8630), spleen phosphodiesterase (P-6752), micrococcal nuclease (N-3755), 5-bromo-2'-deoxyuridine (BrdU): Sigma. T4 polynucleotide kinase (70031): United States Biochemicals. Polyethyleneimine cellulose TLC plates: Macherey and Nagel. Anti-BrdU murine IgG: Becton Dickinson Co. (Research Triangle Park, NC). Supersensitive kit: Biogenex Laboratories Inc. (San Ramon, CA).
Animals and treatments
Sixteen 6 week-old female NMRI mice (from Charles River Savo, Kisslegg, Germany) were housed, in groups of four, at 21 ± 1°C with a 12 h light/dark cycle (7 a.m./7 p.m.) in macrolone cages type IV. Food (Nafag 890 from Nafag AG, Gossau, Switzerland) and water were given ad libitum. After 1 week, the backs were shaved (a swath 4 cm long, 3 cm wide; Wella Minicut). Nine days later, the treatment with 2.S nmol DMBA and 3 nmol TPA in 100 ftl acetone started (week 0) and was repeated twice weekly (on Tuesday and Friday, sometimes on Monday and Thursday). The time of the first appearance of a papilloma with diameter > 1 mm was registered for each animal. Two mice died spontaneously at weeks 10 and 12. When 12 of 14 mice showed at least one papilloma, an osmotic minipump was implanted s.c. in all animals (Alzet 2001 D, flow rate 8 pl/h for 24 h; Alza Corp., Palo Alto, CA; filled with 220 pi of a solution of 20 mg BidU/ml 10 mM potassium phosphate, 130 mM NaCl, pH 7.6 (PBS), plus 1 % 1N NaOH). 24 h later, all mice were killed by an overdose of halothane. The treated skin area and a piece of the small intestine were excised. A tumor-free part of the skin and the small intestine were prepared for the immunohistochemistry, the remaining skin excluding papilloma was used to isolate DNA.
DNA isolation and ^P-postlabeling
The epidermis (without tumor-bearing areas) was scraped off with a scalpel after brief warming of the skin to 55°C in a waterbath (5) and was stored at - 8 0 ° C . DNA was isolated according to published methods (6). The DNA was dissolved in 'nucleotide buffer' (20 mM sodium succinate, 8 mM CaCl2, pH 6.0) and
1285
W.H.Fischer, P.E.Bdand and W.K.Lutz
stored at - 8 0 ° C . DNA concentrations were estimated spectrophotometrically assuming an A260 of 20 for a solution of 1 mg/ml.
32P-Posdabeling analysis of DMBA-adducts was performed as described (7,8). Eight peg, DNA was digested at 38°C for 3.5 h in 10 pi 20 mM sodium succinate, 8 mM CaCl2> PH 6 0> containing 2.2 pg phosphodiesterase (0.048 units) and 1.32 jig micrococcal nuclease (0.24 units). 8.5 pi of the digest was used for the enrichment of the adducts by addition of 0.27 jtl nuclease P, (1.7 units), 1.2 /il 0.85 mM ZnCl2 to each sample and incubation at 38°C for 40 min. 4.4 /<1 of this hydrolysate was incubated with 3.1 y\ nucleotide buffer and 4.5 id hot-mix (125 iiCi [y -32P] ATP, 1.5 /d kinase-buffer [300 mM Tris-HCl, pH 9.5, 100 mM magnesium chloride, 100 mM dhhiothreitol, 10 mM spermidine], 0.7 pi 10~5 M ATP, 3 units polynucleotide kinase up to 4.5 pi with H2O) for 40 min at room temperature. All samples were labeled in one experiment.
Chromatography of 32P-labeled nucleotides and quantification
Prior to use, PEI-cellulose plates were washed with methanol and water, dried, and a Whatman filter paper (no. 17) wick was attached. Nine p\ of the labeled mixture were applied on a PEI plate as described (7). Plates were developed in Dl direction overnight with 1.7 M sodium phosphate, pH 6.0. The wick was removed and the sheet developed in D3 direction using 4.3 M lithium formate and 7.4 M urea, pH 3.4. To increase the separation of the spots, another wick (1.5 cm; no. 1) was attached in D4 direction which was developed with 0.72 M sodium phosphate, 0.45 M Tris, 7.6 M urea, pH 8.2. Background radioactivity was reduced by developing the sheet in D5 direction (same as Dl) using 1.7 M sodium phosphate, pH 6.0, onto another wick (4 cm; no. 1). After each development the plates were washed with water for 10 min (tank with permanent water exchange). Immediately before chromatography in D3 and D4, the layers were predeveloped with water to - 1 cm from die bottom edge. For autoradiography, Kodak XAR O-MAT film was exposed at -80°C. Adduct spots were cut out and their radioactivity determined by Cerenkov counting in the scintillation counter (counting efficiency 33%).
Adducts levels were calculated from the net radioactivity in die respective spot, taking into account the sp. act. of the [y-32P]ATP at the time of measurement and the amount of DNA hydrolysate (2.24 p.%) applied to the TLC plate. The estimation of adduct concentrations in the DNA was based on a recovery of 9%, as derived from the postlabeling of a standard DNA sample adducted with [3H]DMBA (see below). Background radioactivity was determined in spots cut from the TLC sheet 2 cm above adduct 1. The coefficient of variance of the background radioactivity of different sheets was 20% (84±17 c.p.m.; 1 SD;
n = 14). Within a sheet, the variability was 4 c.p.m. as derived from 5 pairs
of two background spots measured 2 cm apart. Combining the intrasheet variability with the statistical counting error derived from the Poisson distribution of the radioactive decay (4 c.p.m. as 1 SD in our measurements), the limit of detection of an adduct spot at a significance level of 95% was 11 net c.p.m.. This is equivalent to a concentration of 5 adducts per 109 DNA nucleotides.
DNA isolated from animals treated with [3H]DMBA was used as a standard for adjusting die 32P-posdabeling data to adduct concentrations. Nine percent of the adducts measured with the tritium marker were detectable by 32P after die 32P-postlabeling procedure (mean of four replicates; based on die sum of all adducts). As an approximation, the same normalization factor was used for all adducts.
Immunohistochemistry
A tumor-free part of the treated skin area was pinned flat on a cork board and fixed in 4% formalin, 0.5% hexameuiylene-tetramine for at least 3 weeks. The skin was embedded in Paraplast paraffin (Monoject Scientific Inc., Athy, Ireland) and cut into 2—3 jim thin sections. A small intestinal section was used to control for die staining efficiency. The sections were stained immunohistochemically for incorporation of BrdU into DNA (9). Nuclei of cells which were in S-phase during BrdU exposure stained red.
The histological sections were scanned for areas of highest BrdU-incorporation in order to measure die maximum possible response of each individual animal. Here, a total of 700 cells were counted and die labeling index was calculated as the fraction of red cells among all epithelial cells. For calculating die number of cells per unit length, die distance covered by die 700 cells was also measured. Due to technical problems with embedding and cutting die values of one mouse (latency period: 7.5 weeks) are not available.
Results and Discussion
DNA adducts and latency time
The cumulative skin-papilloma incidence of mice treated twice
weekly with DMBA and TPA is shown in Figure 1. The first
animal showed a papilloma after 7.S weeks of treatment, the 12th
mouse after 15.5 weeks. The experiment was terminated at week
17. DMBA adducts in the epidermal DNA of each individual
mouse were determined by
32P-postlabeling. One adduct (1 in
1286
100 90 80 60 50 40 10 -0 5 10 15 Period of treatment [weeks]20
Fig. 1. Cumulative skin papilloma incidence in a group of 14 female NMRI mice after twice weekly treatments with DMBA (2.5 nmol) and TPA (3 nmol). The time of die first appearance of a papilloma was registered for each animal. All mice were killed after 17 weeks of treatment (arrow).
D3
Dl
o
OR D 4 "
Fig. 2. 32P-Postlabeling TLC map of DMBA-nucleotide adducts from epidermal DNA of a NMRI mouse which had been treated with 2.5 nmol DMBA and 3 nmol TPA twice weekly for 17 weeks.
Figure 2) was seen in all 14 animals. Adducts 2 and 3 were
detectable in all but one animal. Additional adducts were
occasionally (in 1 - 3 mice) above the limit of detection, making
a total of eight different adducts. As expected from the low dose
of DMBA administered (2.5 nmol = 0.64 /tg; twice weekly),
measured concentrations of single adducts ranged between 8 and
90 x 10~
9mol adduct per mol DNA nucleotide. Figure 2 shows
a postlabeling map that can be obtained at these adduct levels.
The correlation of the three main adducts (nos 1—3) and the
sum of all adducts with the latency period is shown in Figure 3.
Very surprisingly, higher adduct levels were seen in those mice
that had a longer latency period. This was true not only for the
sum of all adducts (Figure 3, bottom right) but also for two of
the most abundant individual adducts (Figure 3, other charts).
The positive correlation was significant for adduct 1 (P = 0.03;
Spearman rank correlation coefficient test) and for the sum of
all the adducts (P = 0.05). For adduct 3, the significance level
was somewhat lower {P = 0.09). Adduct 2 showed no
correlation. The adduct levels measured in those two mice which
had not (yet) developed a papilloma after 17 weeks were also
relatively high: a sum of 18 and 12 X 10~
8mol adduct per mol
nucleotide was measured. This finding gives further support to
the unexpected correlation of long latency periods with high
adduct levels.
When the present adduct maps are compared to those published
(10), a very tentative assignment could designate adduct 1 as a
deoxyguanosine adduct, while adducts 2 and 3 could be
deoxyadenosine adducts. Different adducts formed by the same
carcinogen can have different biological consequences. A
correlation of adduct levels with a measure of risk can only be
expected for dangerous adducts. More than 90% of the skin
papillomas initiated by DMBA contain an A-to-T transversion
DMBA Adducts, cell division, and skin tumor latency time Adduct # 1 10- 8- 6- 4- 2- 0-A d d u d * 2 • • • • 0 2 4 6 8 10 12 14 16 18 0 2 4 6 8 10 12 14 16 18 10-,
h
Adduct # 3 35-, 30- 25- 20- 15-ia 5-£ Adducts 0 2 4 6 8 10 12 14 16 18 Papilloma latency period [weeks]0 2 4 6 8 10 12 14 16 18 PapDIoma latency period [weeks]
Fig. 3. Correlation of DMBA-nucleotide adduct levels from epidermal DNA of NMRI mice with the latency period for the appearance of a papilloma after twice weekly dermal treatment for 17 weeks with DMBA (2.5 nmol) and TPA (3 nmol). Correlations are shown for the three major adduct spots and for die sum of up to eight adducts. Spearman rank correlation coefficient test: 1, P = 0.03; 3, P = 0.09; £ , P = 0.05.
in codon 61 (A
182) of the Ha-ras gene (11). Guanine in codon
12, on the other hand, was not found to be substituted. It would
be premature, however, to consider the major adduct seen in this
chronic study (adduct 1) an innocuous DNA modification. In
another report on carcinogen-specific mutation of Ha-ras during
mouse skin carcinogenesis, a small proportion of DMBA-induced
tumours were activated at codon 12, presumably by changes at
one of two G residues (12). Furthermore, it cannot be excluded
that adducts which are not particularly strong in ras activation
result in other types of mutations, for instance strand breaks after
depurination. This discussion illustrates that the total levels of
adducts can only represent an approximate risk marker but, on
the other hand, one should not regard any adduct as completely
harmless.
Cell division and latency time
The rate of accumulation of mutations from promutagenic DNA
adducts is dependent on the number of proliferating cells and
on the rate of cell division (13,14). An inverse correlation
between one of these variables and the papilloma-latency time
could therefore be expected. The analysis of our data is shown
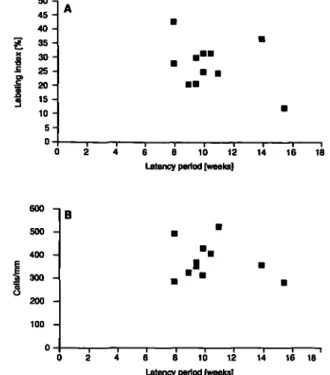
in Figure 4. Neither labeling index (A) nor cell number (B)
showed any correlation with the papilloma-latency time. Although
the labeling index varied more than threefold within the group
of mice under analysis, the individual response of the normal
epidermis to the mitogenic activity of TPA did not correlate with
the rate of papilloma formation.
Cell division and DNA adducts
The concentration of DNA adducts is dependent on the rates of
formation and repair, and on the rate of dilution by DNA
synthesis. With each round of DNA replication, the adduct
concentration is divided in half because the newly synthesized
strand does not contain adducts. The higher the rate of cell
50 45 40 35 30 25 20 15 10 5 -0 A 2 4 600 500 400 300 200 100 -B ) 2 4 m • • • 6 8 10 12 14 16 If Latency period [weeks]
. - ' • • .
6 8 10 12 14 16 18 Latency period (weeks]
Fig. 4. Correlation of the labeling index for DNA replication (A) and of the number of cells per mm epidermis (B) with the latency period for the appearance of the first papilloma in NMRI mice after twice weekly dermal treatment for 17 weeks with 2.5 nmol DMBA and 3 nmol TPA. No significant correlation.
4
-0 5 1-0 15 2-0 25 3-0 35 4-0 45 5-0 Labeling Index [%]
Fig. 5. Correlation of the DMBA-nucleotide adduct level (no. 1) with die labeling index for DNA replication in the epidermis of NMRI mice after twice weekly dermal treatment for 17 weeks with DMBA (2.5 nmol) and TPA (3 nmol). Spearman rank correlation coefficient text: P = 0.02.
division, therefore, the lower the adduct concentration measured
in the isolated DNA. This phenomenon could indeed be seen in
this study and is illustrated in Figure 5: the concentration of
adduct 1 was lowest in those individuals that showed the highest
labeling index (P = 0.02, Spearman rank correlation coefficient
test). This could also explain the unexpected correlation between
low adduct levels and short tumor latency period: individuals with
high susceptibility to the mitogenic activity of TPA are expected
to show a lower average level of DNA adducts.
Cell type specificity
The question remains why the individual tumor latency was not
correlated with any of our data on cell division. The problem
could have its roots in the fact that both the rates of DNA
replication and the numbers of cells 'at risk' were determined
without accounting for the cell type, for the status of the cells
in the multi-stage process of carcinogenesis, and for the question
1287
W.H.Fischer, P.E.Bebud and W.K.Lutz
whether the cells have the ability to replicate. Information on
the cell division kinetics in premalignant clones of cells might
be required for such a correlation to become apparent.
Biomonitoring and molecular epidemiology
Our data could have important consequences for the interpretation
of results from biomonitoring human exposure to carcinogens
by measuring DNA adduct levels. In such studies, it is very
tempting to use DNA adduct levels not only as an exposure
marker but also to interpret individual differences in terms of
different individual cancer risks. Our data indicate, however, that
adduct levels measured in a target tissue could even be negatively
correlated with the individual risk for cancer development,
probably because of differences in the rate of cell division acting
as a confounding factor.
Our data are strictly valid only for the skin-papilloma model
used with repeated administration of both initiating and promoting
agents and should be extrapolated to other situations with caution.
On the other hand, most human biomonitoring studies are based
on DNA from peripheral lymphocytes which rarely represent
target cells. It is concluded that DNA adduct levels measured
in human samples are unlikely to be of a general predictive value
for an individual cancer risk.
14.Cohen,S.M. and Ellwein.L.B. (1991) Genetic errors, cell proliferation and carcinogenesis. Cancer Res., 51, 6493-6505.
Received on February 8, 1993; revised on April 26, 1993; accepted on April 29, 1993
Acknowledgements
We thank Regula Candrian for excellent technical assistance and Dr Hansjorg Frei for advice with the statistical evaluation of the data. This work was supported by the Swiss League Against Cancer (P.E.B.).
References
l.Harris.C.C. (1991) Chemical and physical carcinogenesis: Advances and perspectives for the 1990s. Cancer Res., Suppl. 51, 5023s-5044s. 2.Beach,A.C. and Gupta,R.C. (1992) Human biomonitoring and the 32
P-postlabeling assay. Carcinogenesis, 13, 1053-1074.
3.Perera,F., Mayer,J., Jaretzki.A., Hearne,S., Brenner.O., Young,T.L., Pischman,H.K., Grimes.M., Grantham.S., Tang.M.X., Tsai,W.-Y. and Santella.R.M. (1989) Comparison of DNA adducts and sister chromatid exchange in lung cancer cases and controls. Cancer Res., 49, 4446-4451. 4.Edler,L., Schmidt,R., Weber.E., Rippmann,F. and Hecker,E. (1991) Biological assays for irritant, tumor-initiating and -promoting activities, m . Computer-assisted management and validation of biodata generated by standardized initiation/promotion protocols in skin of mice. J. Cancer Res.
CUn. Oncol., 117, 205-216.
5. Marrs.J.M. and Voorhees,J.J. (1971) A method for bioassay for an epidermal chalone-like inhibitor. J. Invest. Dermatology, 56, 174-181.
6.Gupta,R.C. (1984) Nonrandom binding of the carcinogen N-hydroxy-2-acetylaminofluorene to repetitive sequences of rat iver DNA in
vivo. Proc. Nail. Acad. Sd. USA, 81, 6943-6947.
7.Gupta,R.C, Reddy.M.V. and Randerath.K. (1982) 32P-Postlabeling analysis of non-radioactive aromatic carcinogen—DNA adducts. Carcinogenesis, 3, 1081-1092.
8.Reddy,M.V. and Randerath.K. (1986) Nuclease PI-mediated enhancement of sensitivity of 32P-postlabeling test for structurally diverse DNA adducts. Carcinogenesis, 7, 1543-1551.
9. Dietrich,D.R. and Swenberg.J.A. (1991) The presence of a 2u-globulin is necessary for d-limonene promotion of male rat kidney tumors. Cancer Res., 51, 3512-3521.
10.Vericat,J.A., Cheng,S.C. and Dipple.A. (1989) Absolute stereochemistry of the major 7,12-dimethylbenz[a]anthracene-DNA adducts formed in mouse cells. Carcinogenesis, 10, 567-570.
ll.Brown.K., Buchmann.A. and Balmain.A. (1990) Carcinogen-induced mutations in the mouse c-Ha-ras gene provide evidence of multiple pathways for tumor progression. Proc. NatL Acad. Sd. USA, 87, 538-542. 12. Quintanilla,M., Brown.K., Ramsden.M. and Balmain.A. (1986)
Carcinogen-specific mutation and amplification of Ha-ras during mouse skin carcinogenesis.
Nature, 322, 7 8 - 8 0 .
13. Clayson,D.B., Nera.E.A. and Lok,E. (1989) The potential for the use of cell proliferation studies in carcinogen risk assessment. ReguL Taxxcol Pharmacol,
9, 284-295.

![Mouse skin papilloma formation by chronic dermal application of 7, 12-dimethylbenz[a] anthracene is not reduced by diet restriction](data:image/gif;base64,R0lGODlhAQABAIAAAP///wAAACH5BAEAAAAALAAAAAABAAEAAAICRAEAOw==)