Publisher’s version / Version de l'éditeur:
Journal of Wood Science and Technology, 69, 4, pp. 619-631, 2011-12-01
READ THESE TERMS AND CONDITIONS CAREFULLY BEFORE USING THIS WEBSITE. https://nrc-publications.canada.ca/eng/copyright
Vous avez des questions? Nous pouvons vous aider. Pour communiquer directement avec un auteur, consultez la
première page de la revue dans laquelle son article a été publié afin de trouver ses coordonnées. Si vous n’arrivez pas à les repérer, communiquez avec nous à PublicationsArchive-ArchivesPublications@nrc-cnrc.gc.ca.
Questions? Contact the NRC Publications Archive team at
PublicationsArchive-ArchivesPublications@nrc-cnrc.gc.ca. If you wish to email the authors directly, please see the first page of the publication for their contact information.
NRC Publications Archive
Archives des publications du CNRC
This publication could be one of several versions: author’s original, accepted manuscript or the publisher’s version. / La version de cette publication peut être l’une des suivantes : la version prépublication de l’auteur, la version acceptée du manuscrit ou la version de l’éditeur.
For the publisher’s version, please access the DOI link below./ Pour consulter la version de l’éditeur, utilisez le lien DOI ci-dessous.
https://doi.org/10.1007/s00107-010-0508-9
Access and use of this website and the material on it are subject to the Terms and Conditions set forth at
Biological damage functions models for durability assessments of
wood and wood-based products in building envelopes
Nofal, M.; Kumaran, M. K.
https://publications-cnrc.canada.ca/fra/droits
L’accès à ce site Web et l’utilisation de son contenu sont assujettis aux conditions présentées dans le site LISEZ CES CONDITIONS ATTENTIVEMENT AVANT D’UTILISER CE SITE WEB.
NRC Publications Record / Notice d'Archives des publications de CNRC: https://nrc-publications.canada.ca/eng/view/object/?id=841eb115-fa2c-4c20-bab3-fb18696c9d1f https://publications-cnrc.canada.ca/fra/voir/objet/?id=841eb115-fa2c-4c20-bab3-fb18696c9d1f
Biological damage functions
models for durability
assessments of wood and
wood-based products in building
envelopes
Nofal, M.; Kumaran, M.K.
NRCC-43107
A version of this document is published in:
Journal of Wood Science and Technology, 69, (4), pp. 619-631, December-01-11
The material in this document is covered by the provisions of the Copyright Act, by Canadian laws, policies, regulations and international agreements. Such provisions serve to identify the information source and, in specific instances, to prohibit reproduction of materials without written permission. For more information visit http://laws.justice.gc.ca/en/showtdm/cs/C-42
Les renseignements dans ce document sont protégés par la Loi sur le droit d’auteur, par les lois, les politiques et les règlements du Canada et des accords internationaux. Ces dispositions permettent d’identifier la source de l’information et, dans certains cas, d’interdire la copie de documents sans permission écrite. Pour obtenir de plus amples renseignements : http://lois.justice.gc.ca/fr/showtdm/cs/C-42
BIOLOGICAL DAMAGE FUNCTIONS MODELS FOR
DURABILITY ASSESSMENTS OF WOOD AND WOOD-BASED
PRODUCTS IN BUILDING ENVELOPES.
1 2
Mostafa Nofal , and Kumar Kumaran Building Envelope and Structure Program
Institute for Research in Construction (IRC), National Research Council Canada (NRC)
ABSTRACT
A durability assessment system that links an advanced computer model for structural and
hygrothermal analysis with damage functions is currently being developed. The computational
system has different modules that calculate the different structural and hygrothermal responses of wall systems. Outputs of these modules are input to the module of damage function models to calculate damage, performance and service-life ofbuilding envelopes. Details ofbiological damage functions implemented in the damage function module ofiRC's durability assessment system are presented. The biological damage functions trace deterioration in wood materials subjected to hygrothermalloads that favor fungal growth. The developments of the models are based on recent biological experimental data from the literature. Equations to calculate
various parameters in the model are presented and the application of the developed models is
demonstrated using a worst case scenario of exfiltration of warm and humid indoor air in a typical wood-frame construction in Ottawa.
1 INTRODUCTION
In general, improper design and construction practices would reduce the service-life of buildings. The lack of long-term durability in building structures, however, is not only due to
1
Research Associate
2
over-stressing from mechanical loading. Other physical, biological, and chemical processes are also responsible for the onset of damages in building envelopes. In addition to mechanical loads, moisture and temperature fluctuations are the leading causes of the continuous degradation of building materials. About 90% of damages in houses results from temperature and moisture effects on the performance of construction materials (Zabel and Morrell 1992). Houses improperly designed for moisture loads may experience moisture-related damage within 3-10 years of service life. Damage prevention ofbuilding envelopes is the most cost-effective measure compared to repairing or replacing the whole envelope. Thus, improvements in the analysis, design, and damage predictions of hygrothermal performance of materials and structures can have great economic as well as safety implications.
Wood and wood based products (engineered wood- OSB) are widely used in most housing and low-rise residential and office buildings in North America and Nordic countries in Europe. Wood materials suffer different types of damage depending on the various environmental conditions. Water and favorable temperature (0°C - 40°C) are the essential elements for initiating physical, biological, and structural damage in wood. Damage due to biological action is the main mechanism that affects wood durability. A wide range of organisms including fungi, termites, carpenter ants, wood-boring beetles and marine borers can live in and consume wood. Specific types of organisms found in building envelopes worldwide depend on the material used, the geographic location and the microenvironment. In general, fungi that live in wood can be divided into four groups: mold, mildew, soft-rot, and wood-rotting fungi. Fungi damaging building envelopes are mainly mold, stain, and wood-rotting fungi (Zabel and Morrell 1992). Mold and stain fungi cause surface damage of a wide range of construction materials. On the other hand, wood-rotting fungi cause significant strength loss of wood materials in places of temperate climates such as those in Europe and North America.
Wood-destroying organisms damage untreated, sapwood, and second or third-growth wood much faster than treated or first-growth harvest. Despite this, the ever-increasing demand of
wood materials by the construction industry is cited as justification to use products made from
untreated and subsequent growth wood. Even products like oriented strand boards (OSB) which are made from less durable species such as aspen and poplar are currently being used in the envelopes of homes and low-rise wood frame constructions. Consequently, biological damage of wood materials is observed in relatively new constructions in European and North
American cities.
These consistent biological problems have led researchers to start identifYing the optimum conditions for the growth of specific fungi species in untreated, softwood or engineered wood materials (Viitanen 1995, Schmidt et al. 1983, Wilcox 1978). For example, Viitanen (1997a, 1997b) designed experiments to investigate the optimum conditions of growth rate of different mold- and wood-rot fungi species. Nofal and Kumaran (1999) summarized the typical growth conditions for these harmful European fungi species. Schmidt et al. (1983), on the other hand, investigated only the rotting behaviour of oriented strand board products due to fungal attacks.
Wilcox (1978) summarized all experimental work prior to 1976.
Finnish studies (Viitanen 1995, Viitanen 1997 b and Viitanen and Ritschko:ff 1991) have measured the damage of Scots pine and Norway spruce under the attack of some of the fungi species identified from a survey of European cities. Other fungal species could exist in North America because of differences in weather and residents' living habits. Morris (1998) has indicated that no extensive studies have been done to determine which wood-rot fungi species are the most prevalent in Canada. Duncan and Lombard (1965) identified Antrodia serialis,
Antrodia vaillantii, Coniophora puteana, Gloeophyllum trabeum, Meruliporia incrassata, Postia placenta, Sepula lacrymans, and Tapinella panuoides, as the fungi causing decay in
building materials in the United States of America. Morris (1998) has suggested that those fungi species identified from USA buildings might be also common to Canadian environments. However, a study should be conducted to identifY those potentially harmful wood-decay fungi in Canada.
The results of previous biological experiments are useful in understanding the deterioration mechanisms of wood materials under fungal attacks. The material behaviour and the process of incurred damage are often evaluated in these experiments by measuring certain quantities. For example, mold growth experiments measure the portion of the surface area covered by mold after a period of growth (Viitanen 1997a, Clarke et al. 1999). The reason for this is that mold growth is essentially a surface phenomenon. On the other hand, wood-rotting fungi consume wood for survival and growth. Thus, most of wood-rot decay experiments use the
criterion of weight loss as the basis upon which results from various experiments can be
compared. In some instances, strength loss, microscopical and chemical reagent can also be used. Weight loss, however, is easy and simple to monitor during testing. However, early
researchers have used weight loss as the damage index for brown-rot fungi to develop
mathematical models of damage accumulation (e.g. Viitanen 1995, Schmidt et al. 1983,
Wilcox 1978, etc.).
2 STUDY OBJECTIVE
It is extremely important to extend the results of these biological experiments to predict the damage
and performance of building envelopes due to fungal attack. Since the inter-dependent action of
moisture and temperature levels is critical for fungi growth, the experimental damage results should
be formulated in a suitable format for implementation in hygrothermal and/or structural computer models. The objective of this paper is to establish mathematical models of fungi-induced damage in wood materials and their implementation in hygrothermal models for prediction of
service-life. This paper enhances Hukka and Viitanen's (1997 b) mold index model for use in
hygrothermal computer models, and it also presents (based on existing information on European wood species; Scots pine and Norway spruce) the development of a new wood-rot damage model subjected to fluctuating moisture and temperature loading conditions. The damage models are written in a format suitable for computer implementations within a durability assessment system of building envelopes. A linkage between hygrothermal and the developed biological damage functions to obtain a system of durability and service-life assessments is also presented. The capability of the proposed models to predict long-term
performance of wall system will be illustrated using the results from hygrothermal analysis of a
typical wall built in the city of Ottawa subjected to a worst-case scenario of ex:filtration
(Ojanen et al. 1989).
3 DURABILITY ASSESSMENTS USING DAMAGE FUNCTIONS MODELS.
Current hygrothermal computer models are capable of predicting the distribution of the
moisture and temperature fields in wall systems (e.g. Hens 1996, Ojanen et al. 1996). The
results of these heat, air, and moisture transfer computer models are useful in designing and assessing the service conditions of the building envelope. However, damage and subsequently
durability assessments of building envelopes and components cannot be directly evaluated
using existing hygrothermal computer models. In order to extend the capabilities of these sophisticated models, one should include damage prediction capabilities due to different aging
processes and loading conditions.
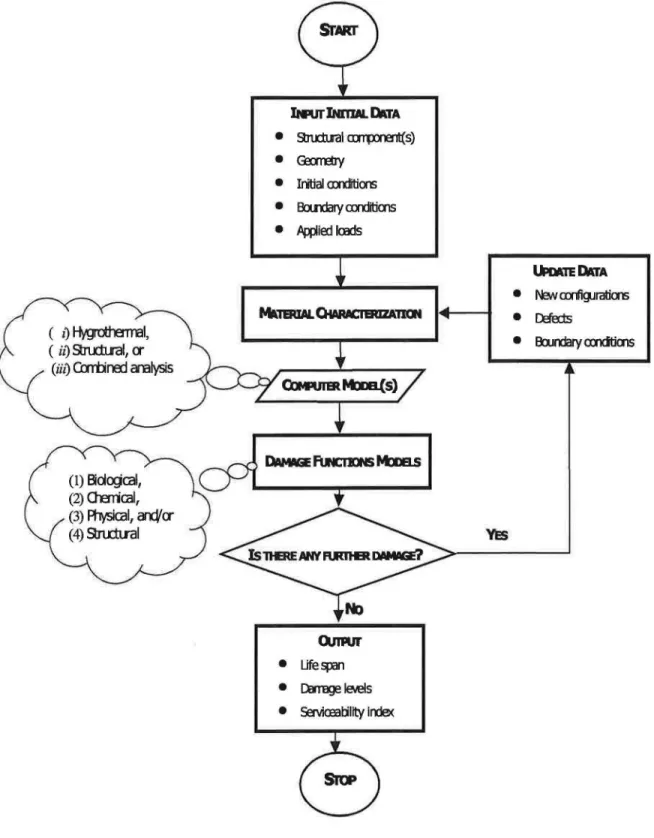
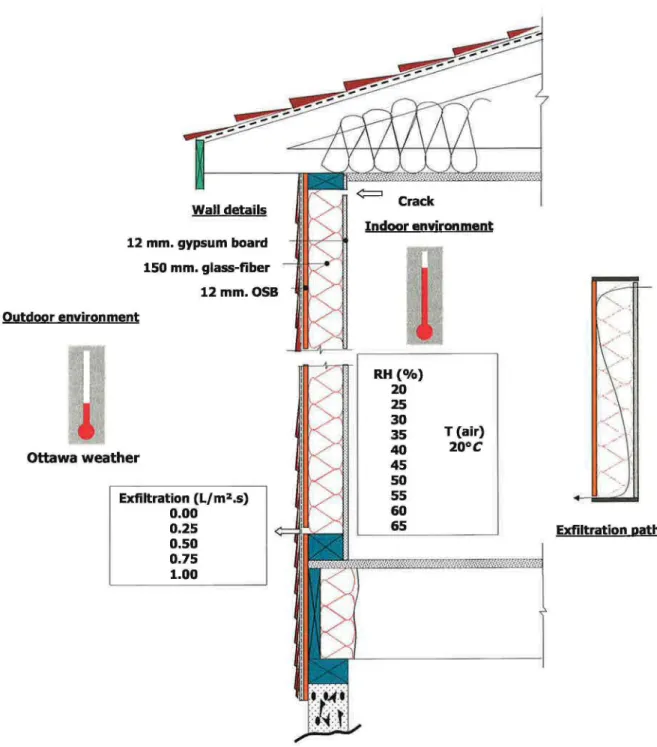
The Institute for Research in Construction (IRC) at the National Research Council Canada (NRCC) is currently developing a durability assessment system that links an advanced structural and hygrothermal analysis computer models with damage functions. The computational system has different modules that calculate the different structural and hygrothermal responses of wall systems. The outputs of these modules are input to the damage functions model module to calculate damage, performance and service-life of building envelopes. Figure 1 shows the flow chart of the proposed durability system. For the current paper, the TCCC2D two-dimensional heat, air, and moisture transfer model (Ojanen and Kumaran 1992, 1996) was used to analyze the wall system shown in Figure 2. Ojanen and Kumaran ( 1992, 1996) used this model to determine the effect of different exfiltration rates on the hygrothermal behavior of a typical wall system. In the work presented here, the same e:x:filtration case (worst-case scenario) was modeled where effect of different indoor relative humidity and varying rates of ex-filtration on the behaviour of a typical wall configuration of wood-frame construction was investigated for Ottawa weather. Figure 2 shows the range of recommended indoors relative humidity (ASHRAE 1995) that used in the current investigation.
4 DAMAGE FUNCTIONS
The development of robust damage models requires experimental data on the onset and progression of a specific damage type for a given material under the effect of different loading types (Nofall998). The different materials and components ofbuilding envelopes experience fluctuating conditions of heat, air, and moisture transport throughout the entire service life of the building. Experiments on damage progression should therefore simulate realistic scenarios that occur during the life of these materials and components. To date, however, biological experiments measuring different decay conditions in wood materials due to growth of fungi have been conducted under constant environmental conditions (e.g. Viitanen 1997 a, and 1997 b, Zabel and Morrell 1992, Schmidt et al. 1983, Wilcox 1978). Developments of recent damage function models ofwood materials (e.g. Clarke et al. 1999, Viitanen's 1997 a, and 1997 b, Schmidt et al. 1983, etc.) have also been based on the constant environments used during those experiments. These damage models have primarily been used to validate or
predict experimental results. However, these models could be useful in assessing damage in buildings in relation to their hygrothermal behaviour. These cases include walls that contain materials with low potential for drying. Damage models based on constant environments could also be useful in estimating damage resulting from some specific and severe moisture exposure. Actual moisture and thermal loading conditions require that damage models be able to capture the response and deterioration of building envelopes and components under fluctuating hygrothermalloading conditions. Huld:a and Viitanen (1998) extended Viitanen's (1997 a) constant mold index model to estimate mold growth in an experiment conducted using
fluctuating moisture and temperature. This mold index (damage) model will be further
developed in this paper to predict mold damage in walls subjected to varying environmental conditions.
4.1 ENHANCED MOLD DAMAGE MODEL OF HUKKA AND VIITANEN (1998).
Viitanen (1997 a) developed a mold index model based on the results of mold experiments on pine and spruce sapwoods. Nofal and Kumaran (1999) interpreted the mold index proposed by Viitanen (1997 a) as a damage rate. Viitanen's (1997 a, 1997 b) models are mathematical in nature and were developed to fit test results on mold growth under constant thermal and moisture conditions. The test samples were subjected to relative humidity in the range of75% to 100% and temperature varying from 5°C to 40°C. Hukka and Viitanen (1998) extended Viitanen's (1997 a) damage model to estimate mold growth under fluctuating moisture and
temperature conditions. The mold index can be calculated for any combination of applied
temperature, T , and relative humidity, RH , as
Mmax = 1 + 7(RHcnt- RH)- 2(RHcrtt -RH)2
RHcnt -100 RHcrtt -100 (1)
where Mmax is the mold index, which varies from 0 to 6 (Hukka and Viitanen 1998) depending
on the extent of mold growth on the material surface and RH is the test relative humidity.
RHcr;r is the critical relative humidity that defines the lower limit of relative humidity causing
mold growth. The critical relative humidity, RHcrlt , can be computed using the experimental
results ofViitanen (1997 a) as
RH = {-0.00267T3 + 0.160T2 - 3.13T + 100 T =:::; 20°C
crtt 80% T > 20°C (2)
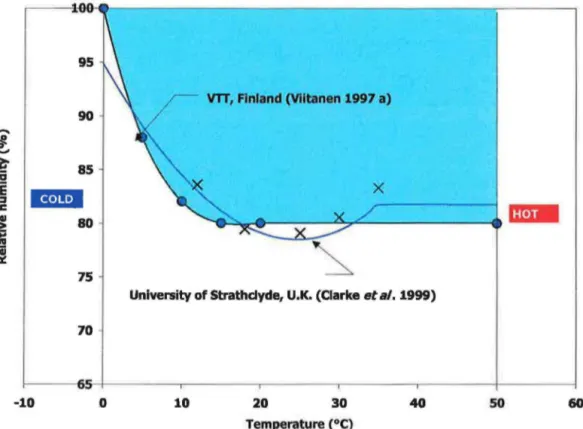
relative humidity, RHcrft, described by Equation (2) for different temperature conditions. Figure
3 shows also the model recently proposed by Clarke et al. (1999) as well as their experimental
results. The two sets of experimental results shown in Figure 3 indicate that mold fungi will not grow or develop for humid conditions below 80% RH regardless of temperature levels. If
the ambient relative humidity is maintained above the critical value, RHcrft, for a period, tm,
mold fungi will start their reproduction process.
Viitanen (1997 a) proposed an empirical formula to estimate the critical time, tm, (in weeks)
that is needed for initial response of mold fungi.
f = e-{).681n(T}-13.91n(RH}+0.14WS-0.33SQ+66.02
m (3)
in which
ws
and SQ are constants that take values either 0 or 1 to reflect the wood species(pine or spruce) and its surface quality, respectively. He also proposed a similar equation to calculate the time needed for visual detection of mold as
t = e-{).741n(T}-12.71n(RH}+0.06WS+61.50
v
where all coefficients are defined earlier.
(4)
For a level of mold index, M, at a given time, t, the rate of mold growth under favorable
conditions can be calculated using the critical time, tm, according to
dM = k1k2
dt 7tm (5)
in which k1 and k2 are constants depending on the growth rate level and can be calculated as
M < 1
(6)
M > 1
(7)
M"?-3
When the relative humidity levels are below the critical value, RHcrft , Hukka and Viitanen
(1998) proposed the following mathematical form for the retardation of mold growth rate.
{
- 0.032 t - tl :<::; 6 h
dM = 0.000 6 h :-::; t- t1 :-::; 24 h
dt - 0.016 t-tl > 24 h
where M represents the drying period and can be calculated according to
M = tc -tp (9)
in which tc and tP are the times corresponding to the current and previous moisture and
thermal conditions, respectively. It is noted that mold fungi cause damage in terms of discoloration, odor, and health but do not significantly affect the strength of wood (White
1995, 1996, Andersson eta/. 1997).
4.2 PROPOSED WOOD-ROTTING MODEL
Most wood-rot fungi species require optimal levels of free or unbound water, favorable temperature, oxygen and available digestible carbon compounds (Nofal and Kumaran 1999). However, the most critical element for fungal growth is the moisture content of the wood materials (Zabel and Morell1992). The minimum moisture content for wood-rot fungal growth in solid woods is about 20%. The optimum moisture content for wood-rot fungal growth in solid woods is not, however, known (Zabel and Morrell1992). Results of decay experiments by Viitanen (1997 b) on solid wood, however, have clearly established that the minimum relative humidity for any appreciable fungal growth is above 92.5% provided the experiments'
temperature, T, is above freezing. Schmidt et al. (1983) indicated that rotting of orinted
strand board (OSB) an engineered wood product would be initiated under a lower relative
humidity. However, all Schmidt's et al. (1983) experiments were conducted in soil jars or
pans. The exact levels of relative humidity at samples surfaces in these jars were not reported. Unlike mold fungi, wood-rot fungi are more enduring species when they are established. The simulation of the life cycle of wood-rot fungi and subsequently damage mechanism under fluctuating temperature and relative humidity can be divided into three different stages namely (1) initial response time, (2) critical growth conditions, and (3) survival conditions of wood-rot fungi. The initial stage is concerned with evaluating time needed for initiating wood-rot. The stage of critical growth calculates the growth of wood-rot during favorable temperature and relative humidity conditions. The third stage in the life cycle analysis of wood-rot fungi calculates the time and growth rate after dormant periods. Dormant periods are those periods where the applied relative humidity and temperature do not support any growth. The following sections give the details of the three stages and the necessary steps in implementing them in computer models.
4.2.1 INITIAL RESPONSE TIME
Once again, the lower limit of relative humidity that causes the growth wood-rot fungi must be defined. The following equation is proposed to calculate the critical relative humidity as a function of test temperature as
RH = { - 0.5T + 100
crft 92.5% (10)
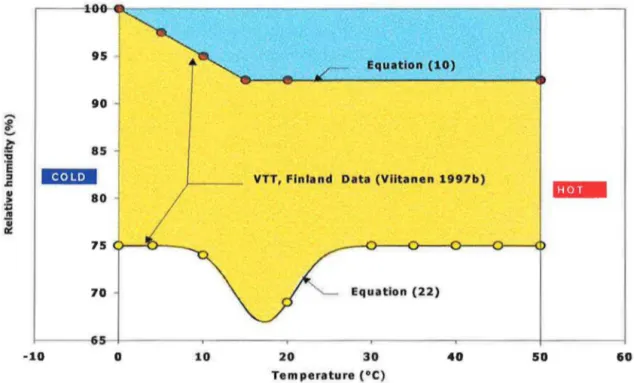
Data from the experiments ofViitanen (1995) and Viitanen and Ritschkoff (1991) are used to
drive the equation. Equation (1 0) is plotted in Figure 4, which defines the domain of combined
temperature and relative humidity necessary for growth. In the 0 °C-15 °C temperature range,
critical relative humidity, RHcnt, for wood-rot fungi is a straight-line relationship of test
temperature. Comparison of the relative humidity curves shown in Figures 3 and 4 indicates that growth of wood-rot fungi requires higher levels of moisture than those needed for the growth of mold fungi.
If the ambient relative humidity, RH, is maintained above the critical value, RHmt, for a period,
t, wood-rot fungi will start decaying the wood material. Unlike mold fungi, wood-rot fungi
cause weight and strength loss ofthe wood materials (Zabel and Morrell1992, Schmidt et al.
1983, Wilcox 1978). The weight loss,
w,,
of wood materials can be related to the exposuretime, t , temperature, T , and relative humidity, RH , as
w1 = f(T,RH,W)-t + g(T,RH,W) (11)
where the functions f and g depend on the wood species (Scots pine and Norway spruce in
this case) as well as the applied temperature and relative humidity. These functions can be written in a compact form as
f(T,RH,W)= 0.1384T + 0.4370RH-42.9450 + ws X (0.0340T-0.0210RH + 1.7210)
and
(12)
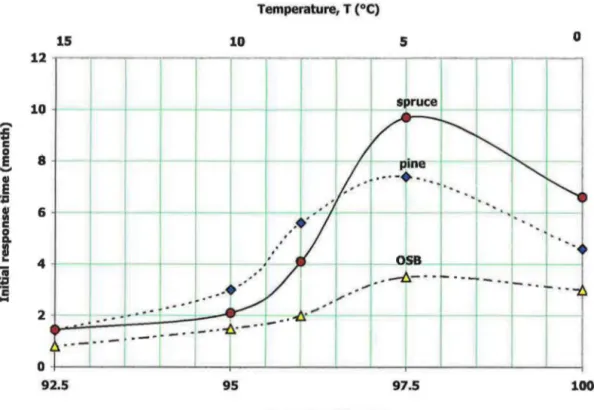
g(T,RH,W)= -2.227T-0.0347RH + 0.0244T X RH + ws X(-0.504T + 0.0096RH + 0.0047T X RH) (13) The initial response time for fungi to start deteriorating the wood fibers could be obtained from Equation (11) by making the weight loss equal to zero.
t- = _f!_
I f (14)
Equation (14) is shown in Figure 5 where, it could be noticed that the initial response time, ti,
varies from 3 weeks to 1 0 months depending on the combination of favorable temperature and relative humidity. These initial response time predictions are in accordance with different
experimental results (e.g. Viitanen 1997b, 1995, Viitanen and Ritschkoff 1991, Zabel and Morrell 1992, Schmidt et a/. 1983, and Wilcox 1978). Figure 5 also illustrates the strong dependence of the initial response time on temperature, especially in the range of0°C-5°C.
4.2.2 CRITICAL GROW1H CONDITIONS
If the applied conditions meet the condition given by Equation (10) for a period longer than that predicted by Equation (14), they would continue to decay the wood materials. The rate of weight loss can be obtained by differentiating Equation (11) with respect to exposure time, t, as
dw1 = f + af t + ag
dt at at
Equation (15) can be rewritten in incremental form as
!J.w1
=
fxM+IJ.fxt+IJ.g(15)
(16)
where the time increment, IJ.t, could be calculated using Equation (9). Functions M and IJ.g
are continuous functions of time, t, because temperature, T, and relative humidity, RH, are
also continuous functions of time. Hence, the increments of functions IJ.f or IJ.g can be
computed by
(17)
where (rc,RHc) and (rP,RHP) are the current and previous combinations of temperature and
relative humidity, respectively. These hygrothermal loads must be above the favorable
conditions defined by Equation (10) for growth to occur.
4.2.3 SURVIVAL CONDITIONS OF WOOD-ROT FUNGI
When the surrounding relative humidity levels are below those of Equation (10), wood-rot
fungi can survive for sometime, depending on the fungi species (Viitanen 1995). The
following relation is proposed to calculate the minimum relative humidity for survival of wood-rot fungi. ( 2 _ 0 5 T -17.2581 RHmln = 75 - 8.0703 e . 35527 ) (18)
Equation (18) is shown in Figure 4 where it has an excellent agreement with Viitanen (1995)
and Viitanen and Ritschkoff (1991) test data. Table 1 lists the conditions and the
corresponding duration time necessary for the survival of two dry rot fungi, Serpula /acrymans and Coniophora puteana (Viitanen 1995, Viitanen and Ritschkoff 1991). Table 1 assumes that
all spores would be viable after subjection to dry periods, エイセイケ@ • However some of the spores, not all, will become nonviable if the applied relative humidities are kept below the minimum values for periods longer than those described in Table 1. The following relationship is
proposed to estimate the percentage of viable spores,
vs ,
in terms of multiples, N セ@ 1 , of dryperiod, tdrr •
vs
= 2.258e-{)·7548N (19)Figure 6 shows the variation given by Equation (19). Thus, the damage rate of Equation (15) can be rewritten to include the effect of viable spores for wet conditions after drying period as
dw, =
vsx(r +at t+ ag)
dt at at (20)
The viable portion used in Equation (20) is only for a time period, tvs, that is needed for
establishing again the 1 00% viable spores. The time could be computed as follows
tvs = - (1-VS)x fl...
f (21)
Equation (21) indicates that the time needed to reestablish the revival of quiescent portion of spores again is the same as that used to establish the initial stages of incubation.
Wood materials are always hidden in the wall cavity. Therefore, it is important to predict damage from simple measurements of the enclosed wall system. Opening the envelope may also release viable and non-viable fungi spores in the air causing discomfort to occupant or the engineers assessing the envelope. Thus, it is more economical to use non-destructive testing measures to evaluate the state of damage in building envelopes. Different wall deformations can be simply measured with accuracy for any complex configuration of building envelope. Excessive deformations are the direct results of the loss in the material modulus of elasticity due to damage. Some decay experiments and actual field measurements (Zabel and Morrell 1992) also indicated that wood materials would lose appreciable portion of their strength and other mechanical properties prior to any noticeable change in their weight. Therefore, this paper further links the weight loss resulting from the damage caused by wood-rot fungi with the loss in the modulus of rupture ofthe wood materials.
Making use of experimental data of weight and strength loss ( Schmidt et al. 1983, Wilcox
1978), the following relationship between the loss in modulus of rupture, MOR , and weight
loss, w1 , can be written:
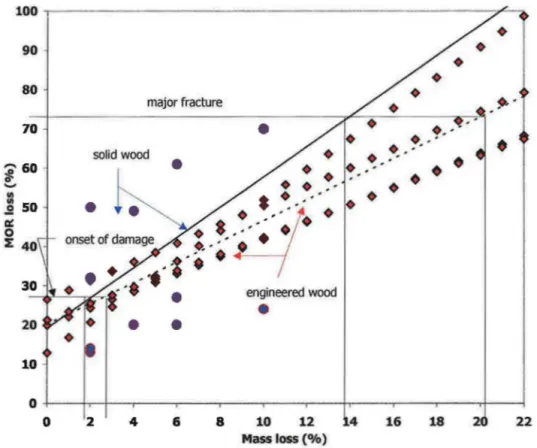
where the factor, NQ, reflects the natural quality of the wood material and is equal to 0 or 1 for engineered (OSB) and solid wood products, respectively. Figure 7 shows the prediction of Equation (14) for OSB (dashed line) and solid wood materials (solid line). The figure also shows the results of different experimental data of Viitanen (1997b, 1995), Schmidt et a/. (1983), and Wilcox (1978).
Making use of Equation (20) in Equation (22), and replacing the loss of the modulus of
rupture, MOR, by the damage rate, : , the following relationship is obtained
dw = (0.0265 + o.0121NQ) x vs x
(r
+at
t +ag)
+ C;dt at at (23)
where w is the damage index that theoretically varies from zero for virgin state to one for
completely fractured material. Constant, C; , reflects initial structural damage and depends
only on the natural quality (durability) of the wood. The Constant, C;, can be computed
according to
onset of damage
(24) subsequent damage
The mold index and proposed wood-rot damage models have successfully been implemented in
a computer program to predict mold and wood-rot damage in wood materials. The models
input is the history of relative humidity and temperature that could be either obtained from field
measurements or from the output of an advanced heat, air, and moisture transfer computer
model. The outputs of the damage function models presented earlier are the mold damage index and the damage rate due to wood-rot at any location of the building envelope. The
prediction capabilities of the developed tool of durability would be shown through an
illustrative example.
5 ILLUSTRATIVE EXAMPLE
The wall system shown in Figure 2 in a worst-case scenario of exfiltration was analyzed for Ottawa weather where various indoor relative humidity and different air leakage were employed. The TCCC2D two-dimensional heat, air, and moisture transfer model (Ojanen and Kumaran 1992, 1996) was used here as the hygrothermal computer model as shown in Figure 1. Properties of virgin materials only were used in the analysis and damage predictions.
5.1 DISCUSSION OF MOLD RESULTS
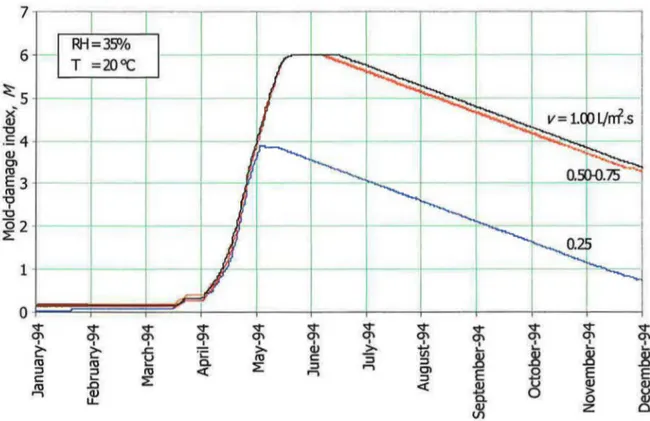
The analysis shows that for the type of exfiltration path illustrated by Figure 2 the bottom of the sheathing membrane would be susceptible to damage. Figure 8 shows the impact of air
leakage rate on the variation of the mold-damage index throughout a year of analysis. It is
clear that mold growth increases as the air leakage rate increases. Figures 8 shows that the damage decreases as the wall dries because mold is a surface phenomenon. Appropriate cleaning process could also eliminate the problem of mold. The descending branch of the
mold-damage index reflects the drying capability of the wall material. It is important to note
that the slope ofthe descending branch of Figures 8 and 9 equals to -0.016, which corresponds to the third case described by Equation (8). These predictions indicate that the mold damage model is successfully implemented in the computer model.
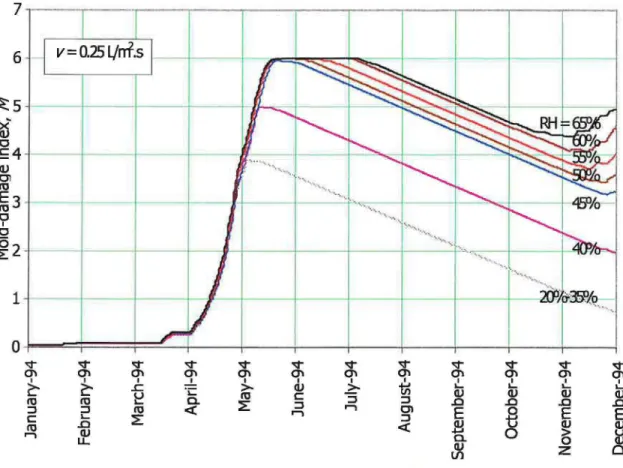
Figures 8 shows how the indoor relative humidity affects the amount of moisture transported through the wall components. Lower indoor relative humidity also permits drying of the wall material. Figure 9, on the other hand, shows that air leakage rate affects the amount of mold
growth on the wall materials. It can be observed from the latter figure that an indoor relative
humidity of20%-35% gives an identical damage pattern on the wall. A portion of only 40-mm height at the bottom of the wall was covered by mold for indoor relative humidities higher or equal to 35%. Increasing the levels of the indoor relative humidity increased the damage and decreased the potential of reducing the mold index, which indicates slower drying rates of the wall materials.
The results show that hygrothermal analysis cannot be used alone to assess performance and
durability. For example, the current result as depicted by Figure 8 indicates that exfilteration rates are extremely important in assessing mold growth. This is an important finding because Ojanen and Kumaran (1992) concluded that "the levels of moisture content and temperature of
indoor and outdoor air govern the hygrothermal behaviour of the cavities, while the rate of exfiltration is immaterial" based on their hygrothermal modeling. The results of the wood-rot
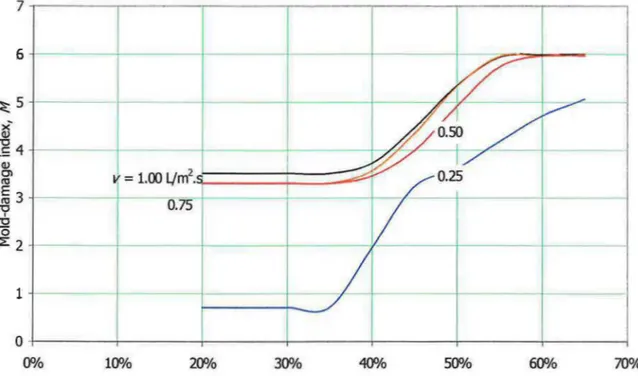
damage model shown later also indicate that the incorporation of damage functions in hygrothermal computer model extends their capability to predict durability and performance. Figure 10 shows the variation of the mold index with respect to the air leakage rate for different indoor relative humidities at the end of simulation period. The mold-index increases nonlinearly as a function of air leakage rate for all indoor relative humidity levels. Results of
Figure 10 show that mold growth commences for air leakage greater than 0.1L/m2
same results can be observed from Figure 11, which clearly shows that the mold-damage index
appreciably increases in the range of 40%-55%. This finding is in agreement with Ojanen and
Kumaran (1992) conclusion reported earlier. The results ofboth Figures 10 and 11 also show that when the indoor relative humidity is in the 20%-35% range, mold can not be identified by the naked eye (Note that the maximum mold index is 3).
5.2 DISCUSSION OF WOOD-ROT RESULTS
The wood-rot model has been developed for wood-based materials only, and it can be used to calculate the impact of details or cracks due to operating conditions on the building envelope service-life. The model has also been developed for specific wood species native to European countries, based on the reported performance of Scots pine and Norway spruce wood materials (Viitanen 1997b). The damage obtained from this model indicates loss in strength and microstructural changes.
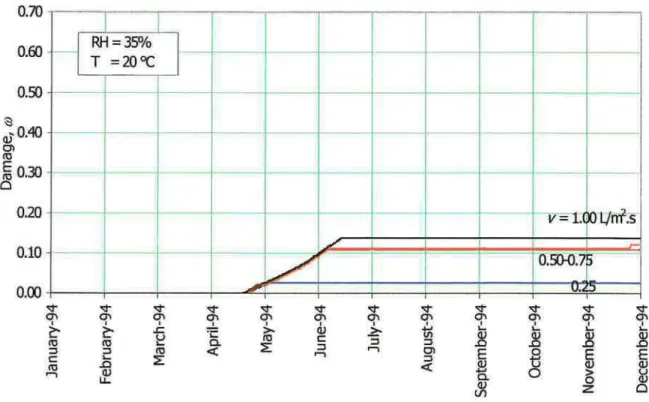
Figure 12 shows the damage variation caused by wood-rot fungi due to different air leakage for an indoor relative humidity of 35%, which represents the comfort level defined by ASHRAE (1995). Figure 13, on the other hand, shows incurred damage for higher indoor relative humidity of 50%, which can be found in some typical low-rise buildings such as gymnasiums and swimming pools. Figure 14 illustrates the effect of different indoor relative humidities on the accumulated wood rot for one case of exfiltration. Other case of exfiltration shows that damage increases as rate of air leakage increases inside the wall cavity. Once again, the wood-rot model shows the same levels of damage for indoor relative humidities in the range of20%-35%. These results are similar to those obtained from the mold damage function model.
However, the results ofFigures 12, 13, and 14 show that the accumulated wood-rot damage is permanent and will not decrease for any subsequent drying. This finding means that wood materials should not get wet and be maintained at levels that would initiate rotting, because
once it is has started it is an irreversible process.
Figure 15 shows that the rot damage function also varies nonlinearly with air leakage. The results presented for damage at the end of simulation period (December 1994). In this case,
however, air leakage as low as 0.1
L/
m2• s may cause wood rot. Therefore, design and
rehabilitation procedures should address air leakage in order to extend the service life of a given building envelope. Finally, Figure 16 shows the same trend of wood-rot damage function as that depicted by Figure 11 for mold damage.
6 CONCLUSIONS
An approach to link hygrothermal models with the damage concept has been presented. To
illustrate this approach, results from a well-established hygrothermal model (Ojanen and Kumaran 1992, 1996) have been combined with the two damage functions models presented here. The mold growth damage function model was based on mold index model reported in the literature (Hukka and Viitanen 1998). The paper presents the full details of wood-rot damage function model. All the experimental data are on Scots pine and Norway spruce wood species. The performance of the models was illustrated by an example case of exfiltration in wood-frame construction in Ottawa. Based on the results of the mold growth index and wood-rot models, the following conclusions may be drawn for worst-case scenario:
1. Damage analysis showed that the air leakage rate had an impact on the wall system performance.
2. The mold growth index depends on the indoor relative humidity.
3. The results of the mold-damage model indicate the importance of the drying potential of building envelopes and materials. Higher indoor relative humidities increase the damage rate. For the present case of exfiltration, mold growth will dominate at the bottom and the top of the wall. The remaining of the wall remained intact throughout the analysis.
4. The results of the wood-rot model, as applied to the exfiltration case presented here, showed that the wall would start rotting from the bottom upward.
5. The results of the wood-rot model show, on the other hand, the importance of keeping the wood below the fiber saturation point in order to keep the integrity of wood used in the construction.
The current study shows that hygrothermal computer models could be extended for use in
design and assessments of the performance of wall components. Service life can thus be estimated using the proposed damage function approach, which enables practitioners to consider the impact of different rehabilitation measures on the remaining life of damaged wall
systems. However, information similar to that on Norway spruce and Scots pine shall be
7 REFERENCES
Andersson, M.A., Nikulin, M., KOljalg, U., Andersson, M.C., Rainy, F., Reijula, K., Hintikka, E.L., and Salkinoja-Salonen, M. 1997. Bacteria, molds, and toxins in water-damaged building materials. Applied and Environmental Microbiology. American Society for Microbiology. Vol. 63, No.2, pp. 387-393
ASHRAE (1995) Heating, ventilating, and air-conditioning applications handbook. SI Edition, Chapter 3, pp. 3.1-3.13.
Clarke, J A; Johnstone, C M; Kelly, N J; McLean, R C; Anderson, J A; Rowan, and N J; Smith, J E A (1999) A technique for the prediction of the conditions leading to mould growth in buildings. Building and Environment Journal, Vol.34, No.4, pp.515-521. Duncan, C.G. (1967) Effect of light on the rate of decay of three wood-destroying fungi.
Phytopathology, Vol. 57, No. 10, pp. 1121-1125.
Duncan, C.G., Lombard, F.F. (1965) Fungi associated with principal decays in wood products in the United States, U.S. Forest Service Research paper W0-4. Department of Agriculture, Washington, D.C., pp. 30.
Fugler, D. (1996) Molds in finished basements. Final report prepared for the Canadian Mortgage and Housing Corporation (CMHC), Ottawa. pp. 1-14.
Hens, H., (1996) Heat, air, and moisture transfer in insulated envelope parts. Task 1: Modelling. Final report, International Energy Agency, Energy Conservation in Buildings and Community Systems, Annex 24 Heat, air, and moisture transfer in new and retrofitted building envelope parts (Hamtie ), pp. 1-90.
Hukka, A. and Viitanen, H.A. (1998) A mathematical model of mold growth in wooden material, accepted for publication in Journal of Wood science and Technology.
Karacabeyli, E., and Soltis, L. A. (1991) State-of-the-art report on duration of load research for lumber in North America. 1991 International Timber Engineering Conference, London. pp. 4.141-4.155.
Morris, P. (1998) Understanding biodeterioration of wood in structures. Internal report, Forintek Canada Corp., Vancouver, B.C., pp. 16.
Nofal, M. (1998) Hygrothermal damage ofbuilding materials and components: State-of-the-art report on studies of hygrothermal damage and proposed approach for damage assessments. Internal report No. 757, Institute for Research in Construction, National Research Council Canada, Ottawa, pp. 139.
Nofal, M. and Kumaran, M.K. (1999) Durability Assessments of Wood-Frame Construction Using the Concept of Damage-Functions. 8th International conference on durability of building materials and components, Vancouver, Canada. 1999.
Ojanen, T. and Kumaran, M.K. (1996) Effect of exfiltration on the hygrothermal behaviour of a residential wall assembly. Journal of Thermal Insulation and Building Envelopes, Vol. 19, No. 1, pp. 215-227.
Ojanen, T. and Kumaran, M.K. (1992) Thermal performance of the exterior envelopes of buildings V. Proceedings ofthe ASHRAE/DOE/BTECC Conference, Clearwater Beach, Florida, pp. 491-500.
Ojanen, T., Kohonen, R. and Kumaran, M.K. (1994) Modeling heat, air, and moisture transport through building materials and components. In Manual on Moisture Control in Buildings Manual. H.R. Trechsel (Ed.), ASTM Manual series MNL Vol. 18, No. 1, pp. 18-:34.
Scheffer, T.C. (1978) Microbiological degradation and the causal organism. In Wood deterioration and its prevention by preservative treatment, Volume 1: Degradation and
production of wood. D.D. Nicolas (Ed.), Syracuse University Press, Syracuse, New York.
Schmidt, E.L., Hall, H.J., g・イエェ・ェ。ョウ・セ@ R.O., Carll, C.G., and DeGrott, R.C. (1983) Biodeterioration and strength reduction in preservative treated aspen waferboard. Forest Products Journal. Forest Products Research Society. Vol. 33, No. 11122, pp. 45-53. vゥゥエ。ョ・セ@ H., (1997 a) Modeling the time factor in the development ofbrown-rot-decay in pine
and spruce sapwood - The effect of critical humidity and temperature conditions.
International Journal of the Biology, Chemistry, Physics and Technology of Wood. Vol. 51, No.2, pp. 99-106.
vゥゥエ。ョ・セ@ H. (1997 b) Modeling the time factor in the development of mold fungi- The effect of critical humidity and temperature conditions on pine and spruce sapwood.
International Journal of the Biology, Chemistry, Physics and Technology of Wood. Vol. 51, No. 1, pp. 6-14.
vゥゥエ。ョ・セ@ H., and Bjurman, J., (1995) Mold growth on wood at fluctuating humidity conditions. Materials and Structure Journal, Vol. 29, No. 1, pp. 27-46.
Viitanen, H., and Ritschkoff, A.C., (1991) Brown rot decay in wooden constructions: Effect of temperature, humidity and moisture. Swedish University of Agricultural Sciences, Departments of Forest Products, Report No. 222, pp. 57.
White, J.M. (1996) Additional analysis of Wallaceburg data. Final report prepared for the Canadian Mortgage and Housing Corporation (CMHC), Ottawa. Report No. 2962056.02, pp. 36.
White, J.M. (1995) Moldy houses: Why they are & why we care. Final report prepared for the Canadian Mortgage and Housing Corporation (CMHC), Ottawa. Report No. 1952070.00, pp. 66.
Zabel, R.A., and Morrell, J.J. (1992) Wood microbiology: Decay and its prevention. Academic Press Inc., San Diego, California, USA, pp. 476.
( z) 1-tygrothemal,
( iz) S1:ructl.rcll, cr
(iiz) Cmt:Jina::l aralysis
(1) Bidogcal, (2) Oalical, (3) Physical, am,tcr ( 4) Sln..cttral • Sbu:b.lal CXJTlX)rlEJll(s) • GmEtry • Iritial CD!Utions • Bollldary rorditiCJlS • Applied leads Qmlur • Ufespan • e&rage lev'els • Servicml:ility irdex
Figure 1: Flow chart of the proposed durability system
lAlln'EI:MTA • New mnfig.nalions • cerects
12 mm. gypsum board 150 mm. glass-fiber 12mm.OSB Outdoor environment Ottawa weather Exfiltration (L/mz.s) 0.00 0.25 0.50 0.75 1.00 RH(%) 20 25 30 35 T (air) 40 20°C 45 50 55 60 65
Figure 2: Details of wall system and boundary conditions.
90 ... '1-... セ@ 85 "a
·e
Ma.J!•i
:I .1: X u 80 > ·.;:; ..!! セ@ 75University of Strathdyde, U.K. (Clarke eta/. 1999) 70
--10 .0 10 20 30 40 50 60
Temperature (OC)
90 80 70 セVP@ 0 セ@
j
50 a: 0 ::E4Q 30 20 10 major fracture solid wood•
• •
•
•
•
••
•• •••
.
セ@...
-·
..
••
•
•
•
•
engineered wood•
•
•
P KMMMセKMセMMMLMMMMイMMMLMMMMNMMMイイMMMMNMMMNMMMセMMセ@ 0 2 4 6 8 10 12 4 16 18 2 22 Mass loss (%)Figure 7: Variation of the loss of modulus of rupture (MOR) versus weight loss of different wood products.
1 '""' 0.8 セ@ セ@
8.
0.6 IJl Q) :c m>
0.4 0.2 0I
· ---
·-0 1 - r- セM\
--""'
セ@
セ@
l
セ セ@ 2 3 4 5 6 Multiple of dry period (n)15 10 5 0 12
I
10...
fi c 0 8 E ... Gl E ·.a Nセ@ 6 c 0 ICL!
4 ii E c...
2 0 -- - I-- ·-
1 ___ spruce ·- ·-- _a,_ セ@!/ j
BMNセ@
-
-- --
__ L
1 -P.ine- · セ MI -· ... -• ...
.·· .. ·· I ·-- --. __
Mセ セ M
I
• ---f---.=--< , Mセ@ セ M l.
'.
.
M セ セ@.
'
o:SR
-'--. '--.'--.-1
I --6-·.-.--
-
..
-
..
セ M.
.....
. • -M[Aセ@.. . .
.-··v
.
.
セ Mセ セM
...
"( . セ@MMM セMMM イ ᄋ ᄋセ@
1 M セ@ -. I ! ·-· セセM M M L MᄋM i@ 92.5 95 97.5 100 r・ャセエヲカ・@ m.rnJc:fity (lifo)Figure 5: Favorable moisture and temperature conditions for initial response of wood-rot fungi.
90 -...
!
セ@ 85 "0·e
•.
,
..•
::J=
VTT, Finland Data (Viltanen 1997b)... 80 > :Q
"'
セ@ a: 75 70 Equation (22) セMMMM MF s M Q MM MM MMMMMMセMMMMMMMMセ MMMMMM MMNMMMMMMMMMセMMMMMM MMセMMMM MMMM セ@ -10 0 10 20 30 40 50 60 Temperature (°C )Figure 4: Regimes of favorable and survival moisture and temperature conditions for wood-rot fungi.
I
0 ¢ v ¢ ¢ ¢ ¢ ¢ ¢ ¢ ¢ ¢ ¢ 0'1 Icr
0'1cr
0'1cr
0'1 0'1 0'1 0'1 0'1 0'1 I I I I I L I I セ@ セ@ .r:. >- <l1 >- ti ,_ ,_ ,_ セ@ ·;::: R) c: "5 セ@1l
セ@ セ@ R) ro a. セ@ ::J,
::J ::J ::J ro <{,
01 Eg
E E c: .._ セ@ ::J ro .D <{ QJ <l1 QJ,
QJ 0. 0 > u LL. QJ 0 QJ z 0 UlFigure 8: Effect of air leakage rate on the variation of mold-damage index, M, for a given
I
6v
=
0.25ljrrf.s セU@x
Q) "0 .!:4- -
-Q) 01 ro E3 ro "0 I "0 セR@ 1 0"""
"""
"""
"""
"""
"""
"""
"""
"""
"""
"""
"""
0'1 I 0'1 I 0'1 I 0'1 0'1 0'1 0'1 0'1 0'1 0'1 0'1 0'1 ....!... I I I I I セ@ I I セ@ セ@ ..c >- Q) >- セ@....
.... .... セ@ ·c ro c Q) Q) Q) Q) ro ro a. セ@ ::J ::J ::J .0 .0 .0 .0 ::J ::J ro <(..,
C'l Eセ@
E E c....
セ@..,
::J ro .0 <( セ@ Q) Q)..,
Q) a. 0 セ@ u u.. Q) Q) z Cl UlFigure 9: Variation of mold-damage index, M, with respect to time for different indoor relative humidity and specific air leakage rate.
0.60 0.50 セ@ <1)0.40 01 ro セ@ 0.30 0 020 0.10 0.00
__
l
RH=35% T=200CI·
- - 1 - -- -セ@ セ@ セ@ C1' C1' C1' I I I セ@ セ@ .t::. u ro ro .... ::l ::l ro c:....
::E ro .0 ,..., (1) u..--
i - -·-
-- --
-·
v-n
ᄋセャャイイヲ セ ウ@ / l f-/
PセUPMPNWセ@ セ@ I I"·
セ@ セ@ セ@ <::I" セ@ セ@ セ@ セ@ セ@ C1' C1' C1' C1' C1'"'
C1' C1'"'
..!.. I I I I L L I I >- (1) セ@ tl .... .... ·;: ro c: セ@ セ@ セ@ セ@ 0. :2:: ::l ::l ::l <(,
01 Eセ@
セ@
E ,..., ::l <( (1) (1) 0. 0 > u 0 (1) セ@ z 0Figure 12: Variation of wood-rot damage, セ@ with respect to time for different air leakage
W セMMMMMMLMMMMMMMMイMMMMMMセMMMMMMMLイMMMMMMMセMMMMMMセMMMMMMセ@ 6 M MM M イM MセセM イ MセセMM Mエ MMセMMM
I=
1.00セセ R ᄋ BWM MMMKMMMM
0.75 1 P KMMM MM MMセMMMMMMセMMMMMMMT MMMMMM MMセMMMMMMKMMMMMMMセMM MMMM T@ 0% 10% 20% 300/o 40% 50% 60% 70%Irdoor relative humidity(%)
RH = 65% 0 0 0 P KᆪMMMMMMMMセMMMMMMMMMKMMMMMMMMMMイMMMMMMMMMセMMMMMMMMMイMMMMMMMMセ@ 0.00 0.20 0.40 0.60 2 Air leakage (L/m .s) 0.80 1.00 1.20
Figure 10: Variation of mold-damage index, M, with respect to time for different indoor
I
T =20°C RH=sa>/o--
- ·- · -- 1- ᄋセ@ -0.60 0.50 - - -セ N@ ·-セ@ a) 0.40 ltr E C3 0.30 - - r - --v=l.OO
1./rrttl;
-075v
r-=
-セ@
25I
セ@v
I
' 0.10 0.10 0;00 ¢ ¢ ¢ ¢ ¢ ¢ ¢ -.r -.r ¢ -.r -.r q> (1't q> q>t
q>t
(1't セ@ セ@ セ@ q> セ@ ' セ@-2
:c CIJ 4-' .... c '3.,
セ@ セ@ 1: 1: 10 10 0. セ@ :J :J :J :J 10 <( ... ... gi
g
EI
c .... セ@ 10 .0 <( CIJ ..., セ@ > 0 セ@ zFigure 13: Variation of wood-rot damage, セ@ with respect to time for different air leakage
0.60
-I
v = 0.25 L/m2.slセ QMMM
----t---
- - - + - - -t·- · 1 0.50 l 1 -\セ@ 0.40 Hijセ@ c:n 10 E セPNSP@ 0.20 0.10 --·-
-- · -- 1-- -- -- r-- -- --•-- -- --
1 -VV''I;o.f·· ..
···j· ... ᄋᄋᄋᄋᄋᄋᄋᄋᄋᄋ ᄋᄋᄋᄋᄋ ᄋᄋᄋ L ᄋᄋᄋᄋᄋᄋᄋᄋᄋᄋᄋᄋᄋᄋᄋᄋᄋᄋ セ PᄚOPZZSUセOj ᄋᄋᄋᄋᄋᄋᄋᄋᄋᄋᄋᄋᄋᄋᄋᄋᄋᄋ@ ··· PNPPKMM MKMMMMKMMMKMM セ KMMMMMKMMMMM KMMMKMMMセセセL⦅MMセMMMセ@ セ@ 3; v 3; v '<t '<t v 3; c:n 0'1 c:n 0'1 c:n :c >. Q., >.t:
セ@ .!.. .:...セ@
10 c 3 (IJ .8 2l 0. セ@ ::I ... ::1 .Q <t .... 0> Eg
E E ::J <t 2 (IJセ@
> g. 0 Ill 2:Figure 14: Variation of wood-rot damage セキゥエィ@ respect to time for different indoor relative humidity.
0.60 0.50 -セ@ 0.40 Q)' en ttl E セ@ 0.30 0.20 -0.10 RH
=
65% 60% _ _ _ 50% 20%-35% 0.00 Nェ[エゥ セ セ]]]]]ZZZ]M MM MMMMKMM MM MQM M MMMMKM MMM MMMKM MM MQ@o.oo
0.20 0.40 0.60 0.80 1.00 1.20 Air leakage (L./m2 .s)rot fungi (Viitanen 1997 b) Temperature
C'C)
+4 +10 +20 +30 Relative humidity RH(%) 61, 76, 88 61, 76, 88 61, 76, 88 61, 76, 88Survival time, tdry (month)
serpula Conlophora 6 --- 181 > 24 18 > 24 <6 > 24 <6 < 6 -- 122 1
Survival time was dependent on the humidjty: at the lowest humjdity the survival time was lowest.
2
(a) (b ) 0 1 2 3 4 5 6 7 January February March April May June July August September October November December Mold-growth index, M v = 1. 00 Li tre/ m 2 .s 0. 25 R H = 35% T = 20 o C 0. 50 -0. 75 0 1 2 3 4 5 6 7 January February March April May June July August September October November December Mold-growth index, M 4 0 % R H = 65% 20% -35% 45% 50% 55% 60% v = 0. 25 Li tre/ m 2 .s
0 10 20 30 40 50 60 70 80 90 100 0 2 4 6 8 10 12 14 16 18 20 22 MO R l os s ( % ) Mass loss (%) onset of damage major fracture solid wood engineered wood
0.0 0.2 0.4 0.6 0.8 1.0 1.2 0 1 2 3 4 5 6 V iabl e s por es ( V S )
0 2 4 6 8 10 12 92.5 95 97.5 100 Ini ti al r es pons e ti m e ( m ont h) Relative humidity (%) 15 10 5 0 spruce pine OSB
65 70 75 80 85 90 95 -10 0 10 20 30 40 50 60 R el at iv e hum idi ty ( % ) Temperature (°C) HOT COLD Equation (22)
VTT, Finland Data (Viitanen 1997b) Equation (10)
65 70 75 80 85 90 95 -10 0 10 20 30 40 50 60 R el at iv e hum idi ty ( % ) Temperature (°C) HOT COLD
University of Strathclyde, U.K. (Clarke et al. 1999) VTT, Finland (Viitanen 1997 a)
Domain of mold growth
Indoor environment
Outdoor environment
Ottawa weather
Crack
Air leakage (Litre/m².s) 0.00 0.25 0.50 0.75 1.00 RH (%) 20 25 30 35 40 45 50 55 60 65 T (air) 20°C 12 mm. gypsum board 150 mm. glass-fiber 12 mm. OSB Wall details Exfiltration path
C COOMMPPUUTTEERRMMOODDEELL((SS)) M MAATTEERRIIAALLCCHHAARRAACCTTEERRIIZZAATTIIOONN I INNPPUUTTIINNIITTIIAALLDDAATTAA