HAL Id: hal-01193904
https://hal.archives-ouvertes.fr/hal-01193904
Submitted on 3 Jun 2020HAL is a multi-disciplinary open access archive for the deposit and dissemination of sci-entific research documents, whether they are pub-lished or not. The documents may come from teaching and research institutions in France or abroad, or from public or private research centers.
L’archive ouverte pluridisciplinaire HAL, est destinée au dépôt et à la diffusion de documents scientifiques de niveau recherche, publiés ou non, émanant des établissements d’enseignement et de recherche français ou étrangers, des laboratoires publics ou privés.
infra-red thermography in laying hens exposed to high
temperature conditions
Sandrine Grasteau, Utlwanang Moreri, Julien Fablet, Michele
Tixier-Boichard, Jérémie David, Marie-Helene Pinard - van der Laan, T.B.
Rodenburg, Tatiana Zerjal
To cite this version:
Sandrine Grasteau, Utlwanang Moreri, Julien Fablet, Michele Tixier-Boichard, Jérémie David, et al.. Heritability of body surface temperature measured by infra-red thermography in laying hens exposed to high temperature conditions. 14. European Poultry Conference, Jun 2014, Stavanger, Norway. �hal-01193904�
S139 Heritability of body surface temperature measured by infrared thermography in laying hens exposed to high temperature conditions
S. Mignon-Grasteau1*, U. Moreri1,2,3, J. Fablet4, M. Tixier-Boichard5, J. David1,6, M.-H. Pinard-van der Laan5, T.B. Rodenburg7, T. Zerjal5
1
UR083 Recherches Avicoles, INRA, 37380 Nouzilly, France
2
WUR Animal Breeding and Genomics Centre, P.O. Box 338, 6700 AH, Wageningen, The Netherlands
3
AgroParisTech UFR Génétique Elevage et Reproduction, 75231 Paris cedex 05, France
4
Institut de Sélection Animale S.A.S., Hendrix Genetics,1 rue Jean Rostand, Zoopôle, P.O. Box 23, 22440 Ploufragan Cedex, France
5
UMR1313 GABI, INRA, Domaine de Vilvert, F-78352 Jouy-en-Josas cedex, France
6
UMR1019 UNH Unité de Nutrition Humaine, INRA, 63122 Saint-Genès-Champanelle, France
7
WUR Behavioural Ecology Group, P.O. Box 338, 6700 AH, Wageningen, The Netherlands
* corresponding author: sandrine.grasteau@tours.inra.fr
Summary
Improving the adaptation of poultry to heat stress by selection requires having measures that are easy to obtain and that are heritable. Internal body temperature is used to quantify heat stress but is long to obtain and lacks precision. We tested the possibility of infrared
thermography to record body temperature (B) in two commercial lines of laying hens
between 28 and 72 wk, submitted cyclically to periods at neutral or high ambient temperatures (19.6°C and 28.4°C, resp.). Mean BT were estimated for the wing, comb and shank areas (N=4465-4481 in line A, 7279-7311 in line B, depending on the trait). During hot periods, mean BT increased by 29.5-32.6% on the wing, by 20.6-22.5% on the shank and by 28.9-29.8% on the comb. Heritability of the mean BT was estimated in both lines. It was very low for the wing (0.03) consistently with the fact that wing BT is mainly linked to environmental temperature and to feather coverage. Heritability of the shank and the comb BT was also low but significantly different from zero (0.08-0.14), which indicates that the capacity of animals to dissipate heat is partly under genetic control. Heritability of the shank BT was the most consistent between the two lines, probably reflecting a higher precision of the measure of this part, the easiest to distinguish from environment. Using infrared thermography in chicken experimentation seems promising but a higher degree of precision is required in order to increase the heritability of these traits.
Keywords: heat, genetics, thermography, stress, laying hens
Introduction
The past decade was the warmest on record and Earth has been growing warmer over the last 50 years (Blunden et al., 2011). The European Environment Agency estimated that the temperature in Europe will continue to increase by 0.75 to 2.00°C between 2020 and 2050, and that the number of warm days per year will increase by 6 to 10 d every decade
(http://www.eea.europa.eu). Animals will thus have to adapt to these higher rearing temperatures. The animal ability to maintain their body temperature within normal range depends on the balance between the thermogenesis and the rate of heat dissipation. Birds respond to high ambient temperatures by reducing their feed consumption to limit feed induced thermogenesis, by increasing evaporative heat loss through panting and by sensible heat loss through convection and radiation (Mount and Monteith, 1974). The latter has the
lowest energetic cost and consequently a lower impact on production. It would thus be interesting to check whether some birds have a better capacity to dissipate heat through sensible heat loss associated with non-evaporative cooling at high temperatures. The goal of our project was to study the genetic basis of adaptation of laying hens to moderate heat stress. In this talk, we will discuss how thermography could be used to estimate the genetic ability of hens to adapt to heat, by estimating genetic parameters of surface temperature, a key
component of sensible heat loss, in two lines of laying hens exposed cyclically to moderate heat and/or feed stress during the whole production cycle.
Materials and methods
Animals and rearing conditions
Two pure lines used in a 4 way cross of commercial laying hens were used in this study. At 15 weeks of age, each line was dispatched among 6 floor pens of 200 birds. From 28 weeks to 77 weeks of age, half of the pens were submitted to 3 successive cycles of stress, interposed to recovery periods at standard conditions (neutral ambient temperature and commercial
feed).The other half of the pens were kept at standard conditions throughout the whole
production period. Each cycle of stress was composed of three phases: i) 24 d of “feed stress” (i.e. suboptimal diet), followed by 24 d of recovery; ii) 12 d of “heat stress” followed by 12 d of recovery; iii) 24 d of combined feed and heat stress factors (i.e. 12 d of diet change and 12 d with both diet change and heat stress) followed by 24 d of recovery. Ambient
temperature and relative air humidity were on average 28.4°C and 46.9% during heat stress periods (HS) and 19.6°C and 68.8% during thermoneutral periods (TN).
Measures
Thermal pictures of birds were taken at the beginning of the experiment (at 28 wks), at the end of each stress period (at 32, 37, 42, 54, 67and 72 wks) and at the end of each recovery period (at 35, 39, 45, 52, 56, 63 and 70 wks) on all birds for 2 pens per line and on a sample of 50 birds per pen for the remaining 4 pens per line. To take the pictures, birds were placed side-on in a wooden box. When the comb was not clearly visible, a second picture was taken zoomed in on the comb (Figure 1). We used a FLIR B35 camera1, providing a thermal
sensitivity of 0.05°C and an accuracy of 2%. Images were then analyzed with the ThermaCam Pro 2.10 software (© 1997-2010 FLIR systems AB, Sweden). The comb, wing and shank areas were drawn manually, and their mean temperature calculated. Emissivity was set at 0.980 for comb and shank areas and at 0.896 for wing area.
Statistical analyses
Analyses were performed separately for each line. Summary statistics were obtained using PROC MEANS of SAS. An analysis of variance was then performed with PROC GLM of SAS to check which factors were significant. The genetic parameters were estimated using the
REML method implemented in the VCE 6.0.2 (Neumaier and Groeneveld, 1998; Groeneveld
et al., 2008). Taking into account the result of the GLM analysis, two different models were
fitted depending on the trait. Model 1 was used for all traits except for comb area in line A which was analyzed with model 2.
(1)
(2) where yijkl is the body temperature of animal l (N=4465-4481 in line A, 7279-7311 in line B), µ the general mean, Pi the fixed effect of pen i (N=1 to 6 for each line), HSj the fixed effect of heat stress treatment j (j= submitted or not submitted to cycles of heat stress), A the covariate
of age, AT the covariate of ambient temperature in the pen, RH the covariate of relative air humidity in the pen, 1, 2 and 3 the regression coefficients corresponding to the 3
covariates, NPk the fixed effect of the number of pictures taken per bird (N=1 without extra picture comb, 2 with extra picture comb), al the random direct genetic effect of animal l (N=990 and 1485 for lines A and B, resp.), and eijkl the residual effect pertaining to animal j.
Results and discussion
Table 1 shows that under HS, temperatures of all areas increased in the same proportions in both lines, the increase being larger for the wing and the comb (+28.9 to +32.6%) than for the shank (+20.6 to +22.5%). It is to note that the increase of temperature in each zone during HS is strongly dependent on the temperature at TN, the former being higher when the latter is lower. At the contrary, variability was reduced under HS, especially for the shank (CV from 10.4 to 11.4% at 19°C, from 3.3 to 3.6% at 29°C). Heritability of surface temperature was close to zero for the wing area, and low but significantly different from zero for the shank and the comb. These values are consistent with previously estimated heritabilities of body
temperature (0.06-0.19) or of surface temperature of the comb (0.02-0.21) in broilers and adult layers at TN for body temperature (Tixier-Boichard et al., 1995; Loyau et al., 2013; de Verdal et al., 2013). A low heritability for wing area could be expected as this zone is isolated by feathers and plays a less important role in heat dissipation than unfeathered zones.
Moreover, as hens aged, their feather coverage deteriorated, and wing surface temperature was a mix of feather and bare skin zones, which makes the measure less reliable. Tixier-Boichard et al. (1995) found a much higher heritability of temperature in adult males than in females (0.49 vs 0.19), which suggests that the measure of the temperature in adult females can be disturbed by the daily variations due to the ovulatory cycle. In our study, measures of temperatures have been done during the whole day, i.e. at different moments of the ovulatory cycle for females measured in the morning or in the afternoon, which probably introduced an additional noise in the measure. There was also a large variability between birds for the comb size, which might lead to differences in the capacity of birds to dissipate heat through this body part. In our study, the shank was the most suitable area to measure accurately on a large number of animals, as required for genetic studies. The genetic correlation between shank and comb temperatures is moderately positive, indicating that, even if they play the same role in heat dissipation, their genetic control is partly different. For the future, standardizing the measure as proposed by Yahav and Giloh (2012) would probably reduce the noise in the measure and would probably lead to higher values of heritability, compatible with selection requirements. Analysis of the remaining pictures will also enable us to have enough data under HS to be able to analyze TN and HS temperatures as different traits and then to assess whether genetic control of surface temperature under HS or under TN are the same.
References
BLUNDEN, J., ARNDT, D.S. and BARINGER, M.O. (2011) State of the climate in 2010.
Bulletin of American Meteorological Society 92: S1-S236.
DE VERDAL, H., NARCY, A., BASTIANELLI, D., MEME, N., URVOIX, S., COLLIN, A., LE BIHAN-DUVAL, E. and MIGNON-GRASTEAU, S. (2013) Genetic variability of
metabolic characteristics in chickens selected for their ability to digest wheat. Journal of
Animal Science 91:2605-2615.
GROENEVELD, E., KOVAC, M. and MIELENZ, N. (2008)VCE User’s Guide and Reference Manual Version 6.0, 125 pp.
LOYAU, T., BERRI, C., BEDRANI, L., MÉTAYER-COUSTARD, S., PRAUD, C.,
DUCLOS, M.J., TESSERAUD, S., RIDEAU, N., EVERAERT, N., YAHAV, S., MIGNON-GRASTEAU S. and COLLIN, A., 2013. Thermal manipulation of the embryo modifies the
physiology and body composition of broiler chickens reared in floor pens without affecting breast meat processing quality. Journal of Animal Science 91: 3674-3685.
MOUNT, L.E. and MONTEITH, J.L. (1974) The concept of thermal neutrality heat loss from animals and man. Butterworths, London, UK, 425-439.
NEUMAIER, A. and GROENEVELD, E. (1998) Restricted maximum likelihood estimation of covariances in sparse linear models . Genetics Selection Evolution 1:3–26.
TIXIER-BOICHARD, M., BOICHARD, D., GROENEVELD, E. and BORDAS, A. (1995) Restricted maximum likelihood estimates of genetic parameters of adult male and female Rhode Island Red chickens divergently selected for residual feed consumption. Poultry
Science 74: 1245-1252.
YAHAV, S. and GILOH, M. (2012) Infrared thermography –Applications in poultry biological research, Dr. Raghu V Prakash (Ed.), InTech, 93-116.
Table 1. Summary statistics of wing, comb and shank temperature. Line Temperature
Zone
Wing Comb Shank
N Mean + STD N Mean + STD N Mean + STD
A 18°C 3853 26.08+1.47 3841 28.35+3.05 3846 31.51+3.51 29°C 628 33.77+1.53 624 36.79+2.75 628 38.00+1.24 All 4481 27.15+3.05 4465 29.53+4.20 4474 32.42+3.98 B 18°C 6484 25.86+1.56 6452 28.78+3.24 6478 31.02+3.22 29°C 827 34.30+1.28 827 37.11+2.65 827 38.00+1.37 All 7311 26.82+3.08 7279 29.73+4.13 7305 31.81+3.78
Table 2. Genetic parameters of wing, comb, and shank temperature (+ SE). Heritability estimates are on the diagonal, genetic correlations above the diagonal.
Line A Line B
Area Wing Comb Shank Wing Comb Shank
Wing 0.03 + 0.01 0.09 + 0.16 -0.09 + 0.16 0.03 + 0.01 0.36 + 0.12 0.48 + 0.10
Comb 0.08 + 0.01 0.55 + 0.08 0.14 + 0.02 0.46 + 0.07
Shank 0.12 + 0.02 0.14 + 0.01
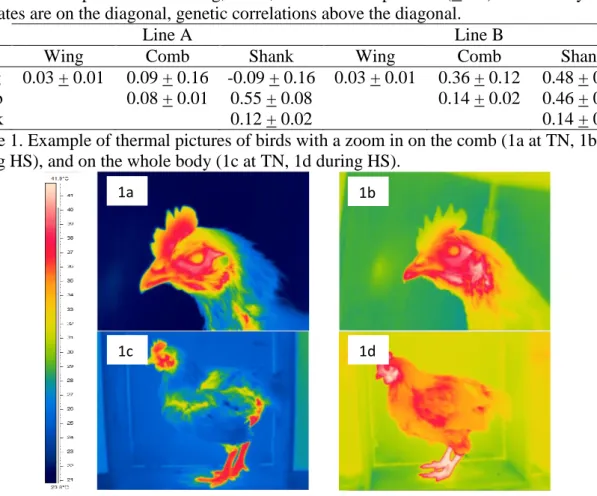
Figure 1. Example of thermal pictures of birds with a zoom in on the comb (1a at TN, 1b during HS), and on the whole body (1c at TN, 1d during HS).
1a 1b