Publisher’s version / Version de l'éditeur:
Vous avez des questions? Nous pouvons vous aider. Pour communiquer directement avec un auteur, consultez la
première page de la revue dans laquelle son article a été publié afin de trouver ses coordonnées. Si vous n’arrivez
Questions? Contact the NRC Publications Archive team at
PublicationsArchive-ArchivesPublications@nrc-cnrc.gc.ca. If you wish to email the authors directly, please see the first page of the publication for their contact information.
https://publications-cnrc.canada.ca/fra/droits
L’accès à ce site Web et l’utilisation de son contenu sont assujettis aux conditions présentées dans le site LISEZ CES CONDITIONS ATTENTIVEMENT AVANT D’UTILISER CE SITE WEB.
Client Report (National Research Council of Canada. Institute for Research in Construction), 2010-05-26
READ THESE TERMS AND CONDITIONS CAREFULLY BEFORE USING THIS WEBSITE.
https://nrc-publications.canada.ca/eng/copyright
NRC Publications Archive Record / Notice des Archives des publications du CNRC :
https://nrc-publications.canada.ca/eng/view/object/?id=b5dea9fe-48ba-4299-abd5-a29ee0347de1 https://publications-cnrc.canada.ca/fra/voir/objet/?id=b5dea9fe-48ba-4299-abd5-a29ee0347de1
NRC Publications Archive
Archives des publications du CNRC
For the publisher’s version, please access the DOI link below./ Pour consulter la version de l’éditeur, utilisez le lien DOI ci-dessous.
https://doi.org/10.4224/20374095
Access and use of this website and the material on it are subject to the Terms and Conditions set forth at
Leakage Management for Water Distribution Infrastructure: Results of DMA Experiments in Ottawa, ON
N a t i o n a l R e s e a r c h C o u n c i l C a n a d a
Le a k a ge M a na ge m e nt for Wat e r Dist ribut ion
I nfra st ruc t ure – Re por t 2 : Re sult s of DM A
Ex pe rim e nt s in Ot t a w a , ON
O s a m a H u n a i d i
EXECUTIVE SUMMARY
Leakage in municipal water pipe networks is a significant problem that has economic, environmental, legal, social and political consequences. Most
municipalities need to manage leakage in their pipe networks. The need to do so became more urgent in recent years due to water shortages caused by recent draughts; increasing demand; environmental, social and political pressures; escalating energy cost and looming regulatory requirements.
Leakage management generally involves water audits, leak detection or monitoring, pressure control, and leak location and repair. In extreme cases, it may involve pipe rehabilitation or replacement. Water audit procedures are well
established, e.g., the IWA standard audit which was implemented for Regina in this study using a GIS-based software system. Pressure reduction is rarely used for leakage management in Canada. This will likely not change, at least in the near future, because of concerns about meeting fire fighting requirements; potential revenue loss; high maintenance of pressure control equipment and long-term effectiveness of pressure control. Municipalities are able to locate most leaks successfully using acoustic equipment, e.g., electronic listening devices and correlators that advanced dramatically in recent years.
Most municipalities in Canada that have active leak detection policies utilize periodic acoustic surveys to detect leakage in pipe networks; very few municipalities use district-metered areas (or DMAs) to detect or monitor leakage. In recent years, encouraged by the widespread use and success of DMAs in the United Kingdom, an increasing number of municipalities are considering DMAs. However, it’s not known if present DMA practice is directly applicable to municipal water pipe networks in Canada.
Several important components currently used in DMA flow analysis were based on data collected primarily from water pipe networks in the U.K. and Germany and their applicability to Canadian networks was uncertain. Pipes in Canada are larger in diameter and therefore are expected to have different background losses,
leak frequencies and flow rates. In addition, patterns of night water demand in Canada are believed to be different from European patterns due to differences in population life style and residential plumbing.
The objective of this study was to develop enhanced leakage management methods for municipal water pipe infrastructure in Canada, with emphases on the district metered-area method. The study involved extensive fieldwork in Ottawa and Regina under controlled conditions to determine residential night demand,
background and recoverable leakage rates, and effect of pipe pressure on leakage; and to evaluate analytical procedure(s) for component identification of DMA night flow. Planned fieldwork in Halifax could not be performed due to administrative difficulties at NRC.
Experimental DMAs were set up in two areas in Ottawa that were
representative of the city’s dominant pipe types. These included: (i) an ~1850 service connections ductile iron pipe DMA in the Orleans area in the eastern part of the city, and (ii) an ~900 service connections cast iron pipe DMA in the high pressure
Meadowlands area in the western part of the city. Experimental fieldwork was carried out in 2006 and 2007. Following are the main findings and conclusions.
The best-fit power relationship between background leakage and pressure for
ductile iron pipes was 1.11
Background 0.0203 P
L = × , where leakage is in L/connection/h and
pressure is in psi. The N1 exponent of this power relationship is significantly lower
than the exponent of 1.5 used in current practice. For cast iron pipes, the best-fit power relationship between background leakage and pressure was
351 . 1
Background 0.0075 P
L = × .
There was significant variation in background leakage rate from night to night and sometimes over the same night that did not correspond to pressure stepping in the older Meadowlands area. Probably, this could be attributed to variable plumbing losses, especially toilet leakage in old homes. The best-fit power relationship
between the highest suspected toilet leakage was 1.43
Toilet 0.0103 P
formula underestimates toilet leakage since measurements were made over few nights only and subsequently the highest possible flow rate may have been missed.
Background leakage rates predicted by current practice with estimates at a reference pressure of 71 psi (50 metres) and N1 exponents obtained in this study
were reasonably close to rates based on the best-fit power relationship of measured rates. A better overall agreement, taking into account flow measurements in both Regina and Ottawa, was obtained by slightly adjusting constants in the equation used in current practice as follows:
(
)
N1 c p c m 71 P N L 15 C N B L A leakage background Night ⎟ ⎠ ⎞ ⎜ ⎝ ⎛ × × × ÷ + × + × = , in L/hwhere P is average pipe pressure in psi; N1 is equal to 0.55, 1.11, 1.35 and 1.5 for
asbestos cement, ductile iron, cast iron and PVC pipes respectively; Lm is total
length of distribution pipes in km; Nc is total number of service connections; Lp is
average length in metres of service connection pipes between curb stops and customer water meters; and A, B and C are constants equal to 24 L/km/h, 1. 5 L/connection/h and 0.4 L/connection/h corresponding to rates of leakage
components at 71 psi (50 metres) pressure in distribution mains, service connection pipes from mains to curbstops and 15-metre long service connection pipes after curbstops, respectively. N1 for PVC pipes was not measured in this study but was
based on current practice.
Difficulties were encountered in proving the boundaries of test areas used to measure background leakage rates and N1 exponents in the older Meadowlands
area. It was likely that some boundary valves were passing water but this could not be detected using acoustic listening equipment while the valves were subjected to a moderate pressure differential (zero-pressure tests were not permitted). It may be that the flow rate of passing water was too low to create detectable noise or that the gates of some valves were worn out and moved somehow after the valves were sounded. The latter could happen due to the removal of valve keys that rested on top of valve nuts during sounding or due to the change of differential pressure across valve gates after sounding, during pressure stepping.
Residential night demand was generally higher than the estimate of 1.7
L/household/h used in current practice. This was especially the case during the lawn-watering season, with demand being up to 5 times the currently used estimate.
Overall average residential night demand over the period 1:30-3:30 AM outside the lawn-watering season in the older Meadowlands test area was higher by about 1 L/household/h than demand in the newer Orleans area. Subsequently, it may be necessary to use DMA-specific residential night demand in order to accurately determine the rate of recoverable leakage based on analysis of DMA night flow. In the absence of DMA-specific data, it is proposed that analysis of night flow be based on DMA supply flow rate averaged over the period 1:30-3:30 AM or 2:00-3:00 AM (instead of using minimum 60-minute moving average) and an average residential demand of 3 and 2 L/household/h for older and newer areas, respectively.
There can be significant spurious recoverable leakage determined from the analysis of night flows during the lawn-watering season. Also, there can be
significant night-to-night variation in the rate of recoverable leakage. In one instance, recoverable leakage rate increased with decreasing pipe pressure. The significant spurious leakage and its variation are a result of the night use of lawn water
sprinklers. Results obtained in this season should be treated with caution. Outside the lawn-watering season, there can also be spurious recoverable leakage,
especially in areas with older homes, which are more likely to have leaking toilets. Detailed procedures were presented for setting up either temporary or permanent DMAs to estimate recoverable leakage rate, with or without automatic meter reading (AMR) systems.
Poor results were obtained for night flow components calculated analytically using a system of linear algebraic equations formulated using power exponents used in current practice or measured in this study and assuming constant residential night demand.
Fieldwork in Ottawa to compare different leak detection strategies could not be performed. Instead, description of different acoustic leak detection strategies, discussion of their pros and cons, and reported experiences with their performance were presented. In addition, interesting results emerged from acoustic listening and correlation surveys that were undertaken to determine the source of high leakage detected in the cast iron and asbestos-cement pipe DMAs in Ottawa and Regina, respectively.
TABLE OF CONTENTS Page EXECUTIVE SUMMARY ... i ACKNOWLEDGMENTS ... viii LIST OF TABLES ... ix LIST OF FIGURES ... x
LIST OF SYMBOLS ... xiii
1 INTRODUCTION ... 1
2 OBJECTIVE ... 4
3 SCOPE ... 4
4 OVERVIEW OF LEAKAGE MANAGEMENT ... 5
5 DESCRIPTION OF TESTS ... 8
Test Sites ... 8
Setup of DMAs ... 10
Instrumentation and Software ... 11
Test and Analysis Procedures ... 12
6 RESULTS AND OBSERVATIONS ... 15
Background Leakage ... 15
Ductile iron pipes ... 15
Cast iron pipes ... 18
Residential Night Demand ... 28
Recoverable Leakage ... 32
Leakage-Pressure Relationship ... 37
Analytical Identification of Flow Components ... 39
7 DISCUSSION ... 40
Implication of Equations 1 to 3 on UARL and ILI ... 48
Background Leakage ... 40
Recoverable Leakage ... 46
TABLE OF CONTENTS (CONT’D)
Page
8 SUGGESTED ESTIMATES AND PROCEDURES ... 53
Background Leakage ... 53
Residential Night Demand ... 53
Recoverable Leakage ... 54
9 CONCLUSIONS ... 62
REFERENCES ... 70
APPENDIX A: ACOUSTIC LEAK DETECTION STRATEGIES ... 124
APPENDIX B: A GIS-BASED SOFTWARE SYSTEM FOR IWA’S WATER BALANCE METHOD ... 141
APPENDIX C: CHARACTERISTICS OF DMAs ... 162
APPENDIX D: ANALYTICAL MODELLING OF MINIMUM NIGHT FLOW COMPONENTS ... 169
APPENDIX E: FLOW AND PRESSURE NIGHTLINES ... 172
APPENDIX F: THEORETICAL ECONOMIC MODELS OF LEAK DETECTION METHODS FOR WATER DISTRIBUTION SYSTEMS ... 225
ACKNOWLEDGMENTS
This study was carried out under collaborative research agreements between the Institute for Research in Construction of the National Research Council Canada (NRC-IRC), Communities of Tomorrow Inc. (CT), City of Regina; City of Ottawa, and Halifax Regional Water Commission. CT and NRC-IRC provided funding for the study and the cities contributed in kind.
Joseph Hannewyk, Martin Leclair and Shelley McDonald (City of Ottawa) and Alex Wang (NRC-IRC) participated in this part of the study – their help and
LIST OF TABLES
Page Table 1: Average residential demand (in L/household/h) based on supply flow
measurements in Orleans ductile iron sub-DMA ... 74
Table 2: Average residential demand (in L/household/h) based on supply ... 75
Table 3: Recoverable leakage rate in the ductile iron pipe DMA in Orleans ... 76
Table 4: Recoverable leakage rate in the cast iron pipe DMA in Meadowlands ... 77
Table 5: Background leakage rates based on Eq. (2) used in current and constants suggested by Lambert et al. (1999) but with power exponents obtained in this study versus best-fit power relationships obtained in this study for the ductile and cast iron pipe sub-DMAs in Ottawa and AC pipe sub-DMA in Regina ... 78
Table 6: Background leakage rates based on Eq. (2) but with coefficients A, B and C modified to 24 L/km/h, 1.5 L/connection/h and 0.4 L/connection/hour, respectively, and power exponents obtained in this study versus best-fit power relationships obtained in this study for the ductile and cast iron pipe sub-DMAs in Ottawa and AC pipe sub-DMA in Regina ... 79
Table 7: Effect of the exponent of the power relationship between Unavoidable Annual Real Losses (UARL), in L/connection/h, and pressure, in psi ... 80
LIST OF FIGURES
Page
Figure 1: Aerial view of ductile iron pipe DMA in Orleans ... 81
Figure 2: Boundaries of ductile iron pipe DMA in Orleans ... 82
Figure 3: Boundaries of ductile iron pipe sub-DMA in Orleans ... 83
Figure 4: Aerial view of cast iron pipe DMA in Meadowlands ... 84
Figure 5: Boundaries of cast iron pipe DMA in Meadowlands ... 85
Figure 6: Boundaries of cast iron pipe sub-DMA in Meadowlands ... 86
Figure 7: Bypass at DMA around a closed valve at DMA inlet ... 87
Figure 8: Aboveground flow meter and PRV rig ... 88
Figure 9: Listening for acoustic noise of passing water at DMA boundary valves ... 89
Figure 10: Flow nightline at 5-seconds interval for ductile iron sub-DMA in Orleans on night of 7 June 2006 ... 90
Figure 11: Flow nightline at 5-seconds interval for ductile iron sub-DMA in Orleans on night of 26 June 2006 ... 91
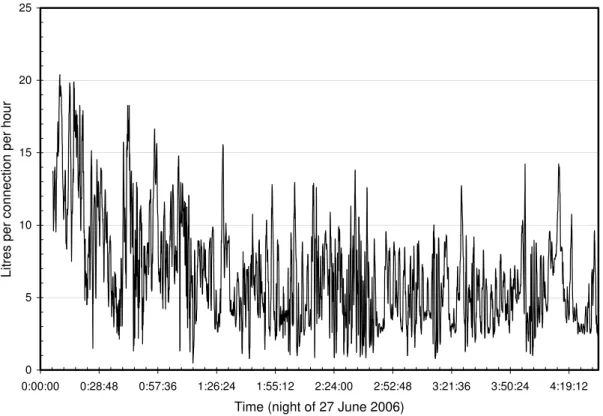
Figure 12: Flow nightline at 5-seconds interval for ductile iron sub-DMA in Orleans on night of 27 June 2006 ... 92
Figure 13: Flow nightline at 5-seconds interval for ductile iron sub-DMA in Orleans on night of 28 June 2006 ... 93
Figure 14: Flow nightline at 5-seconds interval for ductile iron sub-DMA in Orleans on night of 17 October 2006 ... 94
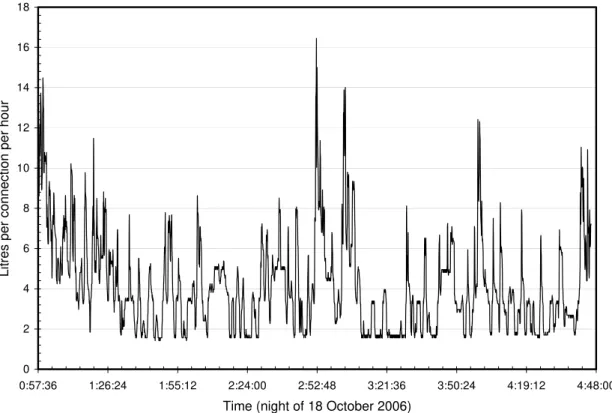
Figure 15: Flow nightline at 5-seconds interval for ductile iron sub-DMA in Orleans on 18 October 2006 ... 95
Figure 16: Flow nightline at 5-seconds interval for ductile iron sub-DMA in Orleans on night of 19 October 2006 ... 96
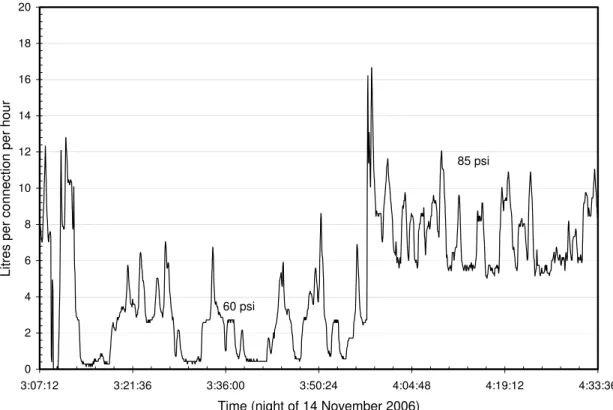
Figure 17: Flow nightline at 5-seconds interval for cast iron sub-DMA in Meadowlands on night of 14 November 2006 ... 97
Figure 18: Flow nightline at 5-seconds interval for cast iron sub-DMA in Meadowlands on night of 15 November 2006 ... 98
LIST OF FIGURES (CONT'D)
Page Figure 19: Flow nightline at 5-seconds interval for cast iron sub-DMA in
Meadowlands on night of 11 April 2007 ... 99
Figure 20: Flow nightline at 5-seconds interval for cast iron sub-DMA in
Meadowlands on night of 12 April 2007 ... 100
Figure 21: Flow nightline at 5-seconds interval for cast iron sub-DMA in
Meadowlands on night of 17 April 2007 ... 101
Figure 22: Flow nightline at 5-seconds interval for cast iron sub-DMA in
Meadowlands on night of 18 April 2007 ... 102
Figure 23: Flow nightline at 5-seconds interval for cast iron sub-DMA in
Meadowlands on night of 19 April 2007 ... 103
Figure 24: Flow nightline at 5-seconds interval for cast iron sub-DMA in
Meadowlands on night of 23 April 2007 ... 104
Figure 25: Flow nightline at 5-seconds interval for cast iron sub-DMA in
Meadowlands on night of 24 April 2007 ... 105
Figure 26: Flow nightline at 5-seconds interval for cast iron sub-DMA in
Meadowlands on night of 25 April 2007 ... 106
Figure 27: Flow nightline at 5-seconds interval for cast iron sub-DMA in
Meadowlands on night of 26 April 2007 ... 107
Figure 28: Moving 60-minute average residential night demand in the ductile
iron pipe sub-DMA in Orleans ... 108
Figure 29: Moving 60-minute average residential night demand in the cast
iron pipe sub-DMA in Meadowlands ... 109
Figure 30: Flow nightline in the cast iron pipe DMA in Meadowlands on 23
November 2006 ... 110
Figure 31: Zones used for flow step testing in the cast iron pipe DMA in
Meadowlands ... 111
Figure 32: Flow nightline of step test in the cast iron pipe DMA in
Meadowlands on 19 December 2006 ... 112
Figure 33: Background leakage rate versus pressure for ductile iron pipe
LIST OF FIGURES (CONT'D)
Page Figure 34: Background leakage rate versus pressure for cast iron pipe
sub-DMA in Meadowlands ... 114
Figure 35: Background leakage rate excluding toilet losses versus pressure
for cast iron pipe sub-DMA in Meadowlands ... 115
Figure 36: Background leakage rate including toilet losses versus pressure
for cast iron pipe sub-DMA in Meadowlands ... 116
Figure 37: Toilet leakage rate versus pressure for cast iron pipe sub-DMA in
Meadowlands ... 117
Figure 38: Recoverable leakage rate versus pressure for ductile iron pipe
DMA in Orleans ... 118
Figure 39: Discharge coefficient, Cd, versus Reynolds number for a 1-mm
diameter orifice (partly reproduced from Lambert, 2001) ... 119
Figure 40: N1 for best-fit power relationship between pressure and UARL calculated using N1 = 1.5 and 0.5 for background and
Unreported/reported leaks, respectively ... 120
Figure 41: Error in ILI due to the assumption of a linear pressure-UARL
relationship ... 121
Figure 42: N1 for best-fit power relationship between pressure and UARL calculated using N1 = 1.5 and 1 for background and
Unreported/reported leaks, respectively ... 122
Figure 43: Variation of infrastructure leakage index with pressure for a system having a service connection density of 80 connections/km and an average service pipe length of 15 metres from curbstops to customer
LIST OF SYMBOLS
° C Degrees Celsius
∅ Diameter
A Constant equal to 20 L/km/h, corresponding to rate of background leakage at 71 psi pressure in distribution mains
AC Asbestos Cement
AMR Automatic Metre Reading
AWWA American Water Works Association
B Constant equal to 1.25 L/connection/h, corresponding to rate of background leakage at 71 psi pressure in service connections to from mains to curbstops
c Marginal cost of lost water ($/m3)
C Constant equal 0.5 L/connection/h, corresponding to rate of background leakage at 71 psi pressure in 15-metre long service connection pipes between curbstops and customer water metres
CARL Current Annual Real Losses
DMA survey
C Cost in dollars of acoustically surveying a DMA
CI Cast Iron
DI Ductile Iron
DMA District Metered Area FFT Fast Fourier Transform
Fo Frequency of unreported leaks per km of pipe per year
GIS Geographic Information System
h Hour
Hz Hertz, unit of frequency defined as the number of cycles per second ILI Infrastructure Leakage Index
IWA International Water Association km Kilometre
L Litre
LBackground Background leakage
LDMA Total length of distribution mains in km in a DMA in km Lm Total length of distribution mains in km
Lp Average length of service connection pipes in metres between curbstops
LIST OF SYMBOLS (CONT’D)
Ls Total length of service connection pipes in metres between curbstops and
customer water metres
m Metre
N1 Exponent for power relationship between leakage and pressure
Nc Total number of service connections
P Pressure
PRV Pressure Reducing Valve
psi Pressure unit, pounds per square inch
PVC Polyvinyl Chloride
R Average volume of water lost in m3 per year per leak
sub-DMA A small area of a DMA
optimum I
T Theoretically optimum intervention period for acoustic leak surveys UARL Unavoidable Annual Real Losses
UKWIR United Kingdom Water Industry Research
1 INTRODUCTION
Municipal water pipe networks deteriorate naturally with time and subsequently lose their initial water tightness. Deterioration is caused by corrosive environment, soil movement, poor construction practices and workmanship, fluctuation of water pressure, and excessive traffic loads and vibration. Water is lost due to leakage in different components of the networks: transmission pipes, distribution pipes, service connection pipes, joints, valves, fire hydrants, and storage tanks and reservoirs. In addition to physical losses due to leakage, many pipe networks suffer from so called apparent losses. These are caused by customer meter under registration,
accounting errors, and unauthorized water use.
Water loss in municipal water pipe networks is a common problem in Canada. On average, about 20% of the water produced by municipalities in Canada is lost, mostly due to leakage in the pipe network (Environment Canada, 2004). Losses in the United States are reported to range from 15% to 25%, of which about 60% to 75% is recoverable leakage (Vickers, 1999).
Management of leakage in water pipe networks has several potential benefits. In addition to helping municipalities meet water demand, lowering of leakage helps to reduce water quality breaches that may result from the entry of contaminants via leaks. Also, reducing leakage helps to decrease the high cost of energy wasted on treatment and pumping of lost water (Colombo and Karney, 2002). The energy-wasting aspect of leakage is important as significant savings can be realized. Energy to supply water is the second largest cost after labour for water systems in
developed countries, and the cost may easily consume 50% of a municipality’s budget in the developing world (James et al., 2002).
Leakage in municipal water pipe networks has economic, environmental, legal, social and political consequences. Therefore, most municipalities need to manage leakage in their pipe networks. The need to do so became more urgent in recent years due to several factors including:
- Diminishing water resources and subsequent shortages caused by more frequent and prolonged droughts due to climate change. This problem is particularly serious in the Canadian Prairies, e.g., the 1999-2004 episode. The Prairies are likely to face a severe drought within the next couple of decades (CBC, 2006).
- Increasing demand for water due to population growth. - Escalating energy cost.
- Increasing awareness by customers of the environmental and social effects of water loss, e.g., effect on energy usage, contamination, and property damage and disruptions due to emergency repairs.
- Emergence of best practice guidelines and new technologies for effective management of leakage.
- The significant and sustained reduction in the rates of lost water realized by utilities, e.g., those in the U.K., which implemented best practices and new technologies to manage leakage.
- High water losses are being increasingly looked upon as an indicator of inadequate maintenance activity and ineffective utility management. - Looming regulatory requirements to manage leakage.
Leakage management involves water audits, leak detection or monitoring, pressure control, and leak location and repair. In extreme cases, it may involve pipe rehabilitation or replacement. Water audit procedures are well established, e.g., the IWA standard audit which was implemented for Regina in this study using a GIS-based software system. Pressure reduction is rarely used in Canada for leakage management and this will likely not change, at least in the near future. Municipalities are able to locate most leaks successfully using acoustic equipment, e.g., electronic listening devices and correlators that advanced dramatically in recent years.
Most municipalities in Canada that have active leak detection policies rely on periodic acoustic surveys to detect leakage; very few municipalities use
district-metered areas (or DMAs) to detect or monitor leakage. In recent years, encouraged by the widespread use and success of DMAs in the United Kingdom, an increasing number of municipalities are considering DMAs. However, it was not certain if current DMA practice is directly applicable to water pipe networks in Canada.
Several important components currently used in DMA flow analysis were based on data collected primarily from water pipe networks in the U.K. and Germany and their applicablity to Canadian networks was not certain. Pipes in Canada are larger in diameter and therefore are expected to have different background losses, leak frequencies and flow rates. In addition, patterns of night water demand in Canada are thought to be different from European patterns due to differences in population life style and residential plumbing. Accurate information about night residential demand, background leakage, and pressure effect is needed in order to reliably determine the rate of recoverable leakage in a DMA.
The following points can be further shortcomings of international leakage methods if applied to North American systems without proper modification: (i) IWA’s model for estimating Unavoidable Annual Real Losses (UARL) does not account for soil type, pipe burial depth and climate – these have significant effects for systems in Canada and Northern United States, (ii) the 500 litres per hour threshold for
technically undetectable leaks is dated – significant advances in acoustic leak detection equipment were made in recent years which dramatically lowered the threshold, and (iii) the UARL model does not account for different leak survey
procedures, e.g., acoustic mapping or correlation-based surveys can detect a larger number of leaks than simple listening surveys. Inaccurate UARL adversely impacts leakage management since it may lead, for example, to underestimates of
2 OBJECTIVE
The objective of this project was to develop enhanced leakage management methods for municipal water pipe networks in Canada. Emphases were on the district metered-area method and included:
(i) Determination of night residential demand.
(ii) Development of an empirical model for estimation of background leakage rates and/or development of analytical procedure(s) that can derive it directly, e.g., analytical modelling of night flow rates measured under different pipe pressures.
(iii) Derivation of relationships between leakage rate and pipe pressure. (iv) Comparison of the performance of different acoustic leak detection
methods.
3 SCOPE
The project involved extensive measurement and analysis of flow and pressure nightlines for several residential district metered areas at two municipal water pipe networks in Canada having different but typical regional characteristics. The selected networks were those of Ottawa and Regina. Planned fieldwork in Halifax could not be performed due to administrative difficulties at NRC. Two district-metered areas (DMAs) were created in each water pipe network. Experimental fieldwork was
performed under controlled conditions to: (i) measure night residential demand and if possible evaluate indirect statistical procedure(s) for calculation of residential
demand, (ii) measure background and recoverable leakage rates, (iii) establish leakage-pressure relationships, and (iv) evaluate analytical procedure(s) for component identification of night flow. Planned fieldwork in Ottawa to compare different acoustic leak detection strategies could not be performed because the city as a result of stretched resources and unexpected heavy workload could not provide
strategies, discussion of their pros and cons, and reported experiences with their performance are presented in Appendix A.
In this report, findings and conclusions based on fieldwork carried out in Ottawa are presented and discussed. Details of fieldwork; instrumentation and software; measurement and analysis procedures are also provided. First, however, an overview of leakage management is presented. Findings and conclusions based on fieldwork in Regina are presented in a companion report.
4 OVERVIEW OF LEAKAGE MANAGEMENT
Management of leakage consists of the following four main components: (i)
quantifying total water loss; (ii) detection or monitoring of leakage; (iii) locating and repairing leaks; and (iv) pipe pressure management. In extreme situations, leakage management may involve pipe rehabilitation or replacement but this is not
considered here.
The total amount of lost water is quantified by conducting a system-wide water audit, known internationally as water balance. Procedures for conducting water audits were published by the American Water Works Association (AWWA, 2009) and by the International Water Association (Alegre et al., 2000) and (Lambert, 2003).
Like financial audits that account for all the debits and credits of a business, water audits account for all water flowing into and out of a utility’s water delivery system. An audit can be performed over an arbitrary period, but normally is
computed annually over 12 months. Audits provide a valuable overall picture of the various components of consumption and loss, which is necessary for assessing a utility’s efficiency regarding water delivery, finances, and maintenance operations. In addition, water audits are necessary for planning other leakage management
components.
In Regina, the IWA standard water balance was implemented in this study in a GIS-based software system, presented in Appendix B. This system integrates data
from the water network asset inventory, water supply supervisory control and data acquisition (SCADA) records, automated meter reading system (AMR), and other water use data to automatically generate water balance reports, quantify water loss and recoverable leakage, and calculate key water loss performance indicators, including the infrastructure leakage index (ILI).
Leak detection can be achieved using district-metered areas. This involves dividing the pipe network into well-defined areas and monitoring water flow supplied to each area. The boundaries of DMAs can sometimes occur naturally but generally have to be created by closing appropriate valves. The size of a typical DMA can be between 500 and 3000 service connections (Hunaidi & Brothers, 2007a). Night flow rates of DMAs are monitored on quarterly, monthly or continuous basis if data loggers connected to DMA flow meters are equipped with remote communication devices (e.g., cellular modems). Guidelines for setting up, maintaining, and
monitoring the leakage of DMAs were published by UKWIR (1999) and IWA (2007). Leakage in a DMA is suspected if the minimum night flow rate exceeds a certain threshold. The latter is determined as the sum of the flow rate of water used by all nighttime commercial and industrial users in the district, flow rate of water used by all residences based on an estimate of average night flow rate per household, and background leakage rate. DMAs make it possible to quickly and efficiently identify areas of pipe networks that suffer from excessive leakage, which are then targeted for acoustic leakage detection and localization operations. Analysis of night water flow can also be used to refine (or check) the accuracy of water audits.
District metered areas are not commonly used in Canada. Most municipalities that have active leak detection policies rely on periodic acoustic surveys to detect leakage. In these surveys, the water pipe network is checked for leaks from end to end either by listening to or by correlating acoustic noise induced by leaks at various contact points with pipes. All areas of the pipe network are surveyed whether or not leakage is suspected. Municipalities that have active leak detection policies usually survey their pipe networks at a frequency of about two years.
An alternative to periodic acoustic listening or correlation surveys, especially in noisy parts of cities, is the use of acoustic noise loggers. These are compact units composed of a vibration sensor (or hydrophone) and a programmable data logger. Noise loggers are deployed in groups of six or more at adjacent pipe fittings (e.g., fire hydrants and valves 200 to 500 m apart) and left overnight. The units are normally programmed to collect pipe noise data between 2:00 and 4:00 AM. They are collected the following day and recorded data is downloaded to a personal computer before the loggers are deployed at the following location. The data is analyzed statistically, e.g., frequency analysis of leak noise levels, to detect the presence of leaks. Recent models of acoustic noise loggers can be deployed permanently. Leak noise is measured nightly and processed using on-board electronics, the result is stored in memory for later transmission wirelessly to a roaming vehicle or a permanent receiver.
The economic viability and leak detection effectiveness of temporarily or permanently deployed noise loggers is questionable. Van der Klejj and Stephenson (2002) found that both permanently and temporarily deployed loggers are not an economical alternative to skilled and well-equipped leak inspectors. For network-wide coverage, permanent loggers had a minimum payback period of 25 years. When the loggers were used in temporary mode (i.e., moved from one survey area to the next), they were three times less efficient than acoustic surveys. Van der Klejj and Stephenson also reported that the number of leaks found by noise loggers and by general listening surveys were similar; however, the loggers failed to detect approximately 40% of leaks found by detailed listening surveys.
The exact position of a leak is commonly pinpointed using ground microphones and leak noise correlators and sometimes by using non-acoustic methods, such as thermography, ground-penetrating radar, and tracer gas (Hunaidi et al., 2000). Pinpointing leaks can be time consuming. Therefore, in the case of DMAs, leak areas are narrowed down to a few pipe sections before pinpointing them. A procedure known as “step testing” can be used to achieve this. Step testing involves the monitoring of the district meter’s flow rate while successively closing
valves within the DMA, starting with the valve farthest away from the meter. A significant reduction in the flow rate is an indication of leakage in the last shut-off section. Step testing has to be performed at night and can be time consuming and dangerous. Also, closing/opening of valves may lead to water quality problems and sudden pressure fluctuation. In recent years, its use has dwindled in favour of acoustic surveys using noise loggers, acoustic listening tools, or leak noise correlators.
Pipe pressure affects leakage in a number of ways and a substantial reduction in leakage can be realized by pressure reduction (Report 26, 1980) and (Thornton, 2003). Theoretically, the flow rate of a fluid through an opening is proportional to the square root of the pressure differential across the opening,
provided the dimensions of the opening remain fixed. However, the effective area of the opening may enlarge with pressure. Therefore, much greater reductions in
leakage may be realized than predicted by the square root relationship, especially for small leaks from joints and fittings in most pipe types and large leaks in plastic pipes (Lambert, 2001). A linear relationship between pipe pressure and leakage rate is widely used by leakage management practitioners.
Pressure reduction is rarely used in Canada for leakage management and this will likely not change, at least in the near future. Municipalities are usually concerned about meeting fire fighting requirements; potential revenue loss; high maintenance of pressure control equipment and long-term effectiveness of pressure control.
5 DESCRIPTION OF TESTS
Test Sites
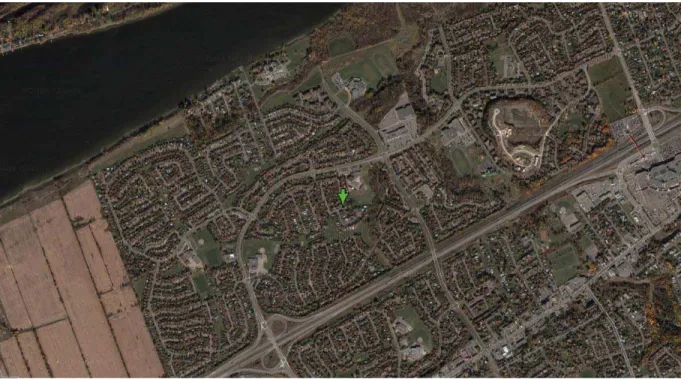
Measurements of night flow and pressure were performed in summer and fall 2006 and spring 2007 at two specially created DMAs in Ottawa, each having a different pipe type. The first DMA was in the Orleans area in the eastern part of the city (see Figure 1 for aerial view). The DMA has 21.74 km of distribution pipes constructed in the late 1960s, 1970s and 1980s, of which 84.8% is ductile iron (DI), 7% is polyvinyl
chloride (PVC), and 8.2% is undefined pipes. The DMA has 1834 service
connections, the majority of which are residential except for 2 schools and a large retirement home (see APPENDIX C for further information). The DMA includes a large residential complex comprising 240 apartments. The number of boundary valves that were needed to completely isolate this DMA was 5 (Figure 2). The size of this DMA is close to that of typical DMAs, which normally have 2000 service
connections.
Flow and pressure were also measured in a small sub-area (sub-DMA) of ductile iron pipe DMA. The small area consisted of ~2.33 km of distribution pipes (almost all is ductile iron) and 298 service connections, all of which are residential except for two schools. The number of boundary valves that were needed to
completely isolate this DMA was 6 (Figure 3). Total pipe length was suspected to be short; actual length was re-read from DMA plan and was ~3.2 km (used in this report.)
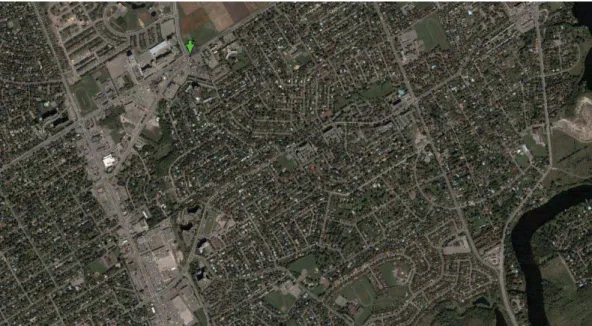
The second DMA was in the Meadowlands area in the western part of the city (Figure 4). This is a high-pressure area and is known to have pipe breakage and leakage problems. The DMA has 15.31 km of distribution pipes constructed in the 1960s, 70s and 80s, of which 66.6% is cast iron (CI), 15.6% is ductile iron (DI), 10.2% is polyvinyl chloride (PVC), and 7.2% is undefined pipes. The DMA also has 909 service connections, most of which are residential except for 4 schools and 25 small commercial outlets (see APPENDIX C for further information). The DMA includes 2 large residential buildings comprised of 447 apartments. The number of boundary valves that were needed to completely isolate this DMA was 2 in addition to 20 permanently closed valves for the pressure zone (Figure 5).
Flow and pressure were also measured in an initial sub-area of the cast iron pipe DMA (tests conducted in November 2006) that consisted of ~2 km of distribution pipes and 220 service connections, all of which is residential. The number of
boundary valves that were needed to completely isolate this DMA was 17 (Figure 6). In subsequent tests in spring 2007, flow and pressure were also measured in a
sub-DMA (purple zone) that consisted of 3.6 km of mostly cast iron pipes and 181 service connections, all of which are residential except for two small commercial outlets and a school (no apartment buildings). This sub-DMA was later enlarged (purple and blue zones) to an area comprised of 5.75 km of distribution pipes of which 73.1% is CI, 7.7% is DI and 19.2 is PVC. Total number of services in the enlarged sub-DMA was 392 all of which is residential except for two small commercial outlets and a school (no apartment buildings).
The above DMAs are representative of pipe types and conditions commonly found in Ottawa. The city’s water pipe network is comprised of about 2391 km of distribution pipes, of which 39% are cast iron, 34% are ductile iron, and 26% are PVC. The network has 178,704 service connections and it services 765,000 people. Average pipe pressure in the network is 70 psi (47.6 m). Average volume of water pumped into the network is 368 ML/day and the marginal cost of water is ¢4.6/m3. The infrastructure is assumed to be in good condition and current leakage
management strategy is passive.
Setup of DMAs
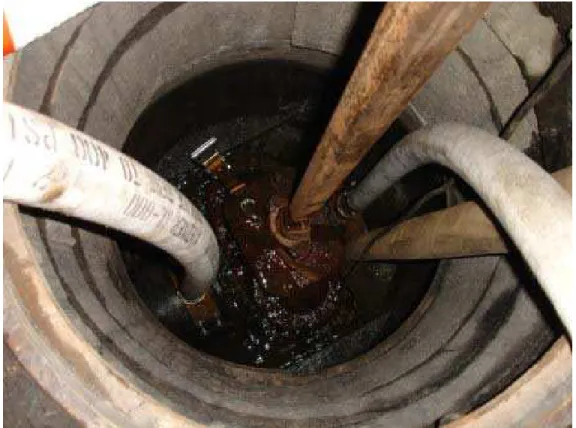
District metered areas were isolated at night by temporarily closing all boundary valves of the area between approximately 11:00 PM and 5:00 AM. Water was
supplied to isolated areas via an above ground bypass by running a short 2-inch fire hose (~10 m) connected to taps on either side of a boundary valve inside a manhole (Figure 7). Above ground, fire hoses were connected to a portable rig that included a flow meter, pressure reducing valve (PRV) and a pressure gauge (Figure 8). Pipe pressure was recorded at the DMA inlet as well as at a fire hydrant near a point where pressure was equal to the average value of pressure in the whole DMA. Pressure was corrected by adding 4 psi to account for a pipe depth of 2.75 m below the pressure sensor attached to the hydrant.
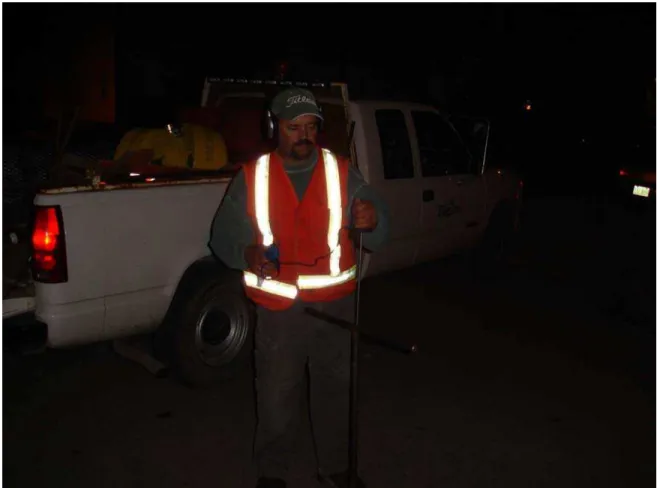
The integrity of boundary valves, i.e., their water tightness, was checked nightly prior to flow measurements. To do this, pressure inside DMAs was reduced
creates a hissing sound under differential pressure. The integrity of valves was checked by listening for flow noise using an acoustic listening device on a solid key that rested on the valve (Figure 9). Initially, few valves were found to be passing in each DMA. Tight seating of most passing valves was restored by either exercising them several times before closing them tightly. If this did not help, in some cases simply turning valves backward a couple of turns restored proper seating. If none of this helped, the boundary of the DMA was adjusted to exclude passing valves. Following the initial check, only valves that were reopened between night measurements were re-checked.
The register of the inlet flow meter was read manually at the beginning and end of the period over which flow information was recorded. Totals based on flows acquired by data loggers and manual readings were compared as an accuracy check. Differences were always negligible.
Instrumentation and Software
All instrumentation and software used for measuring, recording and analyzing flow and pressure were off-the-shelf and commercially available. Water flow into DMAs was measured using one or more of the following flow meters:
- 3/4-inch Neptune T-10 positive displacement flow meter having a pulse factor of 17.07 pulses per litre; low flow rate of 1 litre per minute at 95% accuracy; and normal operating range between 2.8 and 114 litres per minute at 100% accuracy (±1.5%)
- 2-inch Neptune T-10 positive displacement flow meter having a pulse factor of 1.98 pulses per litre; low flow rate of 3.83 litres per minute at 95% accuracy; and normal operating range between 9.5 and 606 litres per minute at 100% accuracy (±1.5%)
- 3-inch Neptune Trident turbine flow meter having a pulse factor of 0.0352 pulses per litre; normal operating range between 19 and 1703 litres per
minute at 100% accuracy (±1.5%); and maximum intermittent flow rate of 2120 litres per second
Calibration of flow meters was checked at the city’s meter shop by city staff prior to field measurements.
Magnetic drive signals of flow meters were digitized and recorded using Neptune FloSearch II transmitter inserted between the flow meter and its register and MeterMaster data logger model 100. For comparison, magnetic drive signals were also digitized and recorded using MeterMaster Model 50 strap-on magnetic sensor and Radcom model LoLogLL Vista data logger. The MeterMaster logger operates in pulse-count mode only while the Radcom logger can operate in both pulse-count and pulse-interval-timing (PIT) mode. PIT overcomes accuracy problems suffered by simple pulse counting for measuring low flow with meters having
insufficient pulse output. Data files were exported from loggers to Microsoft Excel spreadsheets for analysis and display.
A Singer model 106-PR pressure reducing valve (1 ½ inch in 2006 and a 1 inch in 2007) with a low flow stabilizer model 26 was used to control pipe pressures in DMAs.
Test and Analysis Procedures
Residential night water demand and background leakage rates were established based on collective measurement of water use by a group of 200 to 400 residences. Initially, it was planned to perform flow measurements for the sub-DMAs while residential curb-stops were open and then closed. However, closing curb stops was unfeasible because of operational constraints.
Flow measurements for the ductile iron pipe sub-DMA in Orleans were performed in summer and fall 2006 on several nights between approximately 11:30 PM and 5:00 AM. Initial measurements were undertaken in the cast iron pipe sub-DMA in Meadowlands in fall 2006 and further measurements were undertaken in
carried out and all detected leaks were repaired. Only one fire hydrant leak was detected in the Orleans sub-DMA and repaired prior to flow measurement.
Because of the small number of residences in the Orleans and Meadowlands sub-DMAs, it’s very likely that there would be several short intervals with no water being consumed by residences (except for plumbing losses). Therefore, background leakage rate was considered to correspond to the minimum measured flow rate. Average residential night water demand was estimated as the average hourly flow rate (calculated over a 1- or 2-hour period) minus the minimum flow rate divided by the number of residences in the sub-DMA. Average residential night demand based on these measurements excludes losses from residential plumbing.
Water loss due to leakage in DMAs was evaluated as average flow rate of water supplied to DMA minus average flow rate due residential demand based. Both minimum moving 60-minute average supply flow rate and average flow over a fixed period were used.
Residential night water demand could be estimated indirectly by statistical analysis of 1-week long (or more) high-resolution measurements of DMA flow nightlines. The principle behind this method is that unless there are significant fluctuations in pressure, water demand due to leakage in DMAs remains almost constant at night. Therefore, fluctuations in the flow nightline of a DMA will be fully attributable to demand from residences in the district (assuming commercial and industrial use is insignificant or can be accounted for entirely). In this statistical method (Creasey et al., 1996), residential demand is assumed to be dominated by a known short fixed-volume event, e.g., toilette flush, and that the average total
demand is constant.
The measurement period is divided into equal short intervals 1 to 5 minutes in length and measurement period should be long enough to have at least 250 intervals (preferably 500). Total flow volume measured in each interval is converted into an equivalent number by dividing it by the average volume of a toilette flush (or
each interval is assumed to follow a Poisson distribution. The mean of this type of distribution is equal to its variance.
Since night flow fluctuation is attributed to residential demand only, the mean number of events corresponding to the latter is taken equal to the variance of the total flow expressed in number of events per interval. Residential night demand is equal to the mean number of events multiplied by the average event volume.
Leakage level is estimated by subtracting mean residential demand from mean total demand. This analysis was not possible in Ottawa because resources were directed to higher priority measurements. Measurements required for the statistical analysis are excessive and staff time allocated to the project was limited.
Background and recoverable leakage rates and residential night demand could be determined analytically from DMA night flow measurements under significantly different pipe pressures. Background and recoverable leakage components respond differently to variation in pressure and assuming that residential night demand is not dependent on pipe pressure (e.g., due to fixed
volume toilette flushes), a model could be established to separate these components (APPENDIX D).
The relationship between leakage rate and pipe pressure were derived from DMA night-time flow measurements during at least 3 different pipe pressures (e.g., 80, 60, 40, psi), before and after leak detection and repair.
Water flow and pipe pressure were recorded at 5-second long intervals
between approximately 11:30 PM and 5:00 AM. Recorded flow information was used to determine minimum, average and maximum flow rates for stationary 1-mintute long intervals. A 60-minute moving average was also determined based on 1-minute averages. Recorded pressure information was averaged over stationary 1-minute long intervals. All recorded flow and pressure nightlines are presented in
6 RESULTS AND OBSERVATIONS
Background Leakage Ductile iron pipes
As can be seen from the flow nightline obtained from a preliminary flow
measurement in the ductile iron pipe sub-DMA in Orleans on 7 June 2006 (Figure 10), there were short periods over which the 1-minute minimum flow remained almost constant. This was considered to indicate that there was no residential demand during these periods and subsequently the minimum flow rate was indicative of background leakage rate. Background leakage rates of ~6 L/connection/h were obtained at pipe pressures of ~53 and 59 psi, and ~8
L/connection/h at ~77 psi. These rates are about 3 times the rate estimated using current practice for a system in good condition.
Background leakage rate is estimated in current practice using the following equation based on background leakage at 71 psi (50 metres) reference pipe
pressure (Lambert et al., 1999) and a power leakage-pressure relationship with exponent equal to 1.5 (Lambert, 2001):
Eq. (1):
(
)
1 N c p c m 71 P N L 15 C N B L A leakage background Night ⎟ ⎠ ⎞ ⎜ ⎝ ⎛ × × × ÷ + × + × = , in L/h, or Eq. (2): 1 N s d 71 P L 15 C B c A level leakage Background ⎟ ⎠ ⎞ ⎜ ⎝ ⎛ × ⎟⎟ ⎠ ⎞ ⎜⎜ ⎝ ⎛ × ÷ + + = , in L/connection/hwhere P is average pipe pressure in psi; N1 is 1.5, Lm is total length of distribution
mains in km; Nc is total number of service connections; cd is connection density in
number of connections per km of distribution main; Lp is average length of service
connection pipes in metres between curbstops and customer water metres; Ls is total
length of service connection pipes in metres between curbstops and customer water metres and A, B and C are constants corresponding to rates of background leakage components at 71 psi pressure in distribution mains, service connections to from
mains to curbstops and 15-metre long service connection pipes between curbstops and customer water metres equal to 20 L/km/h, 1.25 L/connection/h and 0.5
L/connection/h, respectively.
If diurnal pressure fluctuation is insignificant, i.e. head losses are small which is the case for a distribution system with large pipes, the daily background leakage rate is equal to:
Eq. (3):
(
)
1 N c p c m 71 P N L 15 C N B L A 24 leakage Background ⎟ ⎠ ⎞ ⎜ ⎝ ⎛ × × × ÷ + × + × × = , in L/dayFor systems in average and poor conditions, background leakage rates estimated using current practice are two and three times that estimated for a system in good condition, respectively.
The high rate of background leakage measured during the night of 7 June 2006 could be due to a running lawn-watering sprinkler in the sub-DMA. A single sprinkler may consume ~30 litre per minute at 77 psi pressure, which could spuriously raise background leakage by ~6 L/connection/h. Based on this, actual background leakage may be equal to 2 L/connection/h, which is close to the value predicted by Eq. (2) for a system in good condition. However, this is mere
speculation.
Significant flow oscillation was observed in the flow nightline obtained from preliminary flow measurements in the ductile iron pipe sub-DMA in Orleans during the night of 7 June 2006 (Figure 10). It was suspected that this was due to PRV hunting under low flows. To investigate this, flow in the ductile iron pipe sub-DMA in Orleans was re-measured on 26 June 2006 but with the PRV bypassed. During this flow measurement, it was observed that the telltale of the flow meter sometimes rotated backwards (for up to 5 seconds). This indicates backflow from the sub-DMA. Most likely, backflow was caused by sudden high demand in adjacent areas of the distribution pipe network. Therefore, minimum flow rates might not correspond to actual background leakage rates.
As can be seen from Figure 11, there were several minima below 1 L/connection/h but they did not last for more than 5 seconds. Therefore, for the purpose of estimating background leakage rate, minimum flow rates that did not last for a period of at least 30 seconds were not considered. Close inspection of Figure 11, indicates that there were three such long periods at 1:57, 2:01 and 2:45 AM. There was slight fluctuation in minima over these periods but the average value was consistently equal to ~3.2 L/connection/h, compared to the rate of 2.9 L/connection/h obtained from Eq. (2) used in current practice for estimating background leakage for distribution pipe networks in good condition.
To prevent backflow from the ductile iron pipe sub-DMA in Orleans, flow was re-measured on 27 June 2006 while passing through a fully open PRV to introduce some head loss. The telltale of the flow meter at the inlet of the sub-DMA never turned backwards; however, on several occasions it almost came to a complete stop. Clearly, the PRV acted as a backflow preventer. Also, as can be seen from the flow nightline in Figure 12, there were two or more long enough periods over which minimum flow rate, corresponding to background leakage, relatively remained constant at 2.9 L/connection/h. Average pressure in the sub-DMA during these measurements was ~92.5 psi.
Flow in the ductile iron pipe sub-DMA in Orleans was also re-measured on 28 June 2006 while passing through a check valve and bypassing the PRV. As can be seen from Figure 13, the flow came to a complete stop on several occasions for no more than 5 seconds. However, it can also be seen that there were two or more long enough periods over which minimum flow rate corresponding to background leakage relatively remained constant at ~2.9 L/connection/h. Average pressure in the sub-DMA during these measurements was ~92.5 psi. It’s interesting to observe that at 3:30 AM the flow increased suddenly by about 5 L/connection/h. This probably was to draw by a lawn water sprinkler.
Flow measurements in the Orleans ductile iron pipe sub-DMA to establish the relationship between background leakage rate and pressure were also performed in
late October 2006, outside the lawn-watering season. On 17 October, flow was measured under normal operating pressure of ~92 psi, bypassing the PRV. As during measurements in June 2006, it was observed that the telltale of the flow meter sometimes almost stopped or rotated backwards, indicating backflow from the sub-DMA. However, as can be seen from the flow nightline (Figure 14), there were two or more long enough periods over which minimum flow corresponding to background leakage almost remained constant at ~3.04 L/connection/h, e.g., between 3:04 and 3:08 AM. This leakage rate is close to the background leakage rates measured in June 2006 at similar pipe pressure.
Flow in the ductile iron pipe sub-DMA in Orleans was also measured on 18 and 19 October 2006 under reduced pressures of ~53 and 71.5 psi, respectively. As can be seen from flow nightlines (Figure 15 and Figure 16), there were several long enough periods over which minimum flow rate remained nearly constant. These rates were considered to correspond to background leakage and were equal to 1.65 and 2.26 L/connection/h at 53 and 71.5 psi, respectively. It should be noted that at these reduced pressures, oscillation over the constant flow periods was significantly less than that under normal operating pressure. The small oscillation at reduced pressure is mainly due to quantization error related to the limited pulse output of the flow meter. The higher the pulse output the lower the flow oscillation.
Cast iron pipes
Night flow was measured on preliminary basis in the cast iron pipe sub-DMA in Meadowlands on 14 November 2006. Sounding of boundary valves revealed 4 noisy valves. Exercising quietened valves V272 and V036 but V294 and V282 remained noisy. The latter valves were also noisy when fully open, which was considered to indicate that there was a leak nearby. This was confirmed in December; when it was also realized that for V294 to be tightly closed in order to stop water flow at the nearby leak it had to be turned down fully and then backward a couple of turns. However, this was not done during flow measurement on the night of 14 November 2006. Therefore, the corresponding flow nightline (Figure 17) of the cast iron pipe sub-DMA with V294 on its boundary may not be representative.
As can be seen from flow nightline in Figure 17, there were several long enough periods over which minimum flow rates, considered equal to background leakage rates almost remained constant at ~0.5 L/connection/h under a pressure of 60 psi and ~6.25 L/connection/h under a pressure of 85 psi (note: pressures were measured at the inlet only because gauges froze at other exposed locations). The minimum flow rate at ~85 psi is close to estimates obtained using current practice for distribution systems in average condition. However, unlike results obtained for the ductile iron pipe sub-DMA in Orleans, the above background leakage rates deviated substantially from the expected leakage-pressure power relationship. This was almost certainly caused by suspected passing valves V294 and V282.
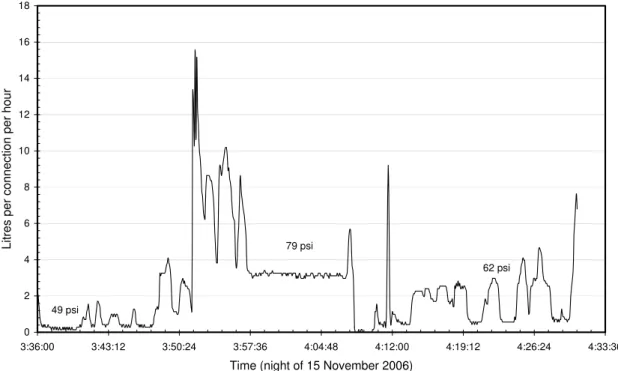
Subsequently the boundary of the sub-DMA was modified by adding valve V275 to the boundary to exclude valves V294 and V282. This reduced the number of service connections in the isolated area to 175. Flow was re-measured on 15
November 2006. As can be seen from the corresponding flow nightline in Figure 18, there were several long enough periods over which minimum flow corresponding to background leakage almost remained constant at ~0.24, 0.96 and 5.31
L/connection/h under inlet pressures of ~49, 62 and 79 psi. These rates are relatively close to the values obtained on 14 November. Hence, it appeared that the significant deviation from the expected leakage-pressure relationship was not only due to
suspected passing boundary valves V294 and V282. Additional flow measurements were undertaken in spring 2007 to investigate the cause.
Further measurements of night flow in the cast iron pipe sub-DMA in Meadowlands were performed starting on the night of 10 April 2007. This was exactly the same sub-DMA for which night flow was measured on 15 November 2006 (i.e., the purple area in Figure 31, excluding problematic valve No. V294). The sub-DMA was isolated by closing valves V137, 139, 036, 032, 129, 188, 190 and 275 in addition to permanently closed valves V136, 155, 174 and 202 on the
boundary of the Meadowlands high pressure zone. In total, there were 12 boundary valves.
Flow rate early in the night was ~15 L/minute and pressure at the inlet was ~90 psi. When the inlet PRV was adjusted to reduce pressure to 50 psi in order to check the tightness of boundary valves, the flow meter came to complete stop and inlet pressure after the PRV remained at 90 psi. This was considered to indicate a passing boundary valve(s). All boundary valves were then sounded using both an electronic listening device placed on top of a long solid valve key resting squarely on valve nuts. This exercise took all night to complete and at the end all boundary valves were deemed quiet. Passing valve(s) could not be detected probably due to the absence of a significant pressure differential across valves with the
high-pressure zone, which is needed to induce noise by passing valves.
On the night of 11 April 2007, pressure in the sub-DMA was reduced to 50 psi by drawing water from fire hydrant H017, near the inlet of the test area, at a high-enough flow rate while partially restricting flow at the inlet. Only boundary valves with the high-pressure zone were sounded. Noise was detected at valves V275, V129 and V036. These were then exercised and re-shut tightly. If noise persisted for a particular valve, it was turned back slightly (a fraction of a turn or more). This helped prevent water from passing over a noisy valve’s gate. Subsequently, no noise could be detected at the above valves and it became possible to reduce pressure in the test area to 50 psi via the inlet PRV.
Pressure was logged only at the inlet of the test area and it was monitored at the highest pointing in the test area (fire hydrant H080) using a dial gauge. When pressure was 90, 64 or 48 psi at the inlet, it was 80, 58 or 46 psi, respectively, at the highest point. The narrowing gap between pressures at the inlet and the highest point as the pressure in the test area became lower should have been taken as indication of a passing boundary valve(s). In later tests, after the boundary was altered and re-proved on 18 April 2007, the gap between pressures at the inlet and highest point remained nearly constant regardless of pressure. When pressure was 85, 64 or 50 psi at the inlet on 19, 24 and 23 April 2007, it was 72, 51 or 37 psi, respectively, at the highest point. Once pressure was set to a particular value, it varied insignificantly both at the inlet and the highest point, as water demand was
low and reasonably steady. As an approximation, average zone night pressure (AZNP) was taken as the average of pressures at fire hydrant H080 (highest point) and the inlet (lowest point), corrected for pipe depth from the elevation of pressure sensors (~3 metres). In other words, AZNP was determined as pressure recorded at the inlet minus 6.4 psi plus 4.4 psi.
Flow was measured between approximately 1:00 and 3:00 AM while average pressure was 51 psi and between 3:00 and 4:00 AM while pressure was 68 psi. As can be seen from the flow nightline in Figure 19, there were several long enough intervals over which minimum flow rate almost remained steady. The minimum rate (average value of the minima of several intervals) was 0.47 and 0.62 L/connection/h at 51 and 68 psi, respectively. As for rates measured in November 2006, these background leakage rates are much lower than the values of 1.31 and 2.02 L/connection/h at 51 and 68 psi, respectively, predicted by Eq. (2) for a system in good condition having a connection density of 50 connections per km and average service pipe length of 15 m. The N1 exponent for a power leakage-pressure
relationship based on the above measured background leakage rates was equal to 0.962, which is significantly lower than the 1.5 exponent used in current practice.
The large difference between predicted and measured background leakage rates may be due to truly low background leakage rate in the test area. Or it may be due to a valve(s) passing water into the test area from the Meadowlands
high-pressure zone at rates of 3.5 and 4.8 L/minute at high-pressures of 51 and 68 psi in the test area, respectively. This trend was contrary to the expectation that the rate at which water passes through a boundary valve into the test area would be inversely proportional to pressure in the test area (i.e., proportional to the differential of pressures inside and outside the test area). An explanation for this may be that the area of the valve opening through which water passed to the test area increased (i.e., the passing valve became less tight) as the pressure differential across the boundary decreased.
As usual, prior to measuring flow in the test area, all boundary valves were sounded after inducing a pressure differential (between 20 and 35 psi) across valve gates. Although it was certain that a boundary valve(s) was passing, no noise of passing water could be detected at any boundary valve. Possible reasons of this are discussed later.
On the night of 12 April 2007, flow was re-measured in the Meadowlands sub-DMA (purple area) at normal operating pressure and at a reduced pressure of 68 psi to determine if results obtained on the previous night were repeatable. Again,
pressure in the test area could not be lowered via the inlet PRV to create a pressure differential across boundary valves so that they could be sounded. Most likely, this was due to one or more boundary valves that were passing water at a significant rate. Subsequently, pressure was lowered to 50 psi by drawing water at fire hydrant H017 inside the of the test area while partially restricting flow at the inlet.
Valves at the boundary with the rest of the Meadowlands high-pressure area were sounded using electronic listening equipment attached to a solid valve key lowered onto valve nuts. Permanently closed valves were not sounded as they were already proved on the previous night. Noise was detected at valves V275 and V036 and it was eliminated by slightly turning the valves backwards (a fraction of a turn). Subsequently, water draw from hydrant H017 was stopped and pressure in the test area increased to an estimated AZNP of 87 psi. Flow was measured using a ¾-inch Neptune T-10 PD meter. The inlet PRV was bypassed, as water flow was high and led to significant pressure loss in the PRV. For comparison, pressure was reduced to an estimated AZNP of 68 psi at the end of the night from about 3:30 to 4:30 AM.
As can be seen from the flow nightline in Figure 20, there were several long enough periods that had a slightly fluctuating minimum value with an average of 3.6 L/connection/h at 87 psi. The slight fluctuation is believed to be due to minor
pressure transients in the network. Pressure fluctuation would have been
significantly reduced if pressure inside the test area were controlled via the inlet PRV. The above minimum night flow rate was relatively close to the background
leakage rate of 2.92 L/connection/h predicted by Eq. (2) for a connection density of 50 connections per km and average service pipe length of 15 m.
It can also be seen from Figure 20 that there were several long enough periods over which the minimum flow rate was steady at ~0.62 L/connection/h at 68 psi. This is the same as the value obtained at the same pressure on the previous night, and is significantly lower that the value of 2.02 predicted using Eq. (2). The N1
exponent corresponding to the above measured background leakage rates at 87 and 68 psi was 7.14, which is much higher than 1.5 exponent used in current practice. Unfortunately, the above results did not provide a consistent trend with results obtained on the night of 11 April 2007. Measured flow rates and the very high N1
exponent may be real; or one or more boundary valves were passing.
To further investigate underlying causes, the cast iron pipe test area was significantly enlarged to an area comprising the test area used on 11 and 12 April 2007 (purple area in Figure 31) and an area of similar size (blue area in Figure 31). The following valves were temporarily closed to isolate the enlarged sub-DMA: V087B, 137, 302, 287, 296, 294, 282, 190, 188, 141, 129, 036, 032. The following permanently closed valves were part of the boundary of the sub-DMA: V136, 138, 155, 174, 202, 266, 319 and 309. Total number of valves that formed the boundary of the enlarged sub-DMA was 21. Total pipe length was 5.75 km of which 19.2% was PVC, 7.7% was ductile iron and 73.1% was cast iron pipe. Total number of services was 392 and they included a restaurant, an office building and a school (all of which were unoccupied during flow measurements).
Flow was measured in the enlarged area on the night of 17 April 2007. It was not possible to reduce pressure in the enlarged sub-DMA using the inlet PRV. Suspecting that boundary valve V294 on Meadowlands Drive was passing, it was back turned two turns. Subsequently, it was possible to reduce pressure at the inlet of the sub-DMA to ~50 psi using the PRV. Only valves V294, 129, 302, 287, 137 and 296 were sounded. There was very faint noise at isolation valves V137 and 296 that was not believed to correspond to noise typically induced by passing water. Valves
V190, 188, 141, 032 and 036 were not sounded as they were always found to be quiet when sounded during the previous week. Permanently closed boundary valves of the blue zone V266, 309 and 319 were checked on 1 May 2007; no noise was detected.
Pressure in the sub-DMA was maintained at an estimated AZNP of 53 psi and flow was logged starting at 1:00 AM. It can be seen from the flow nightline in Figure 21 that between 1:00 and 2:00 AM there were several long enough periods having a steady minimum flow of ~0.23 L/connection/h. However, after that it was observed that pressure started to increase on its own and flow had stopped. In view of the faint noise heard earlier at isolation valves V137 and V296, it was suspected that check valves CV293 and CV138 had opened slightly and water started passing into the sub-DMA. V137 and 296 were sounded again but there was only very faint noise that again was not believed to correspond to noise typically induced by passing water. Just in case this was not so, valve V139 was closed to double isolate check valve CV138 but this did not help reduce pressure in the sub-DMA.
Unable to determine what happened, pressure in the sub-DMA was raised to operating level by slowly bypassing the PRV at the inlet. When the PRV was fully bypassed, AZNP reached an estimated value of ~90 psi. As can be seen from the flow nightline in Figure 21, there were a few long enough periods that had a slightly fluctuating minimum value with an average of ~4 L/connection/h. As with previous results obtained for the smaller sub-DMA, background leakage rate at AZNP of ~90 psi was much higher than that obtained at AZNP of 53 psi. In view of this, it’s very likely that the large unexpected difference between background leakage rates at different pressures was due to one or more passing valves. Most likely, while AZNP was ~53 psi, the gate of valve V294 moved somehow after it was adjusted prior to flow measurement, it started passing water again and subsequently pressure in the sub-DMA increased. This was confirmed at ~4:00 AM by the failure to reduce pressure in the test area below 82 psi via the inlet PRV. Valve V294 was then sounded and found noisy; it became quiet after it was back turned slightly.