Publisher’s version / Version de l'éditeur:
Vous avez des questions? Nous pouvons vous aider. Pour communiquer directement avec un auteur, consultez la première page de la revue dans laquelle son article a été publié afin de trouver ses coordonnées. Si vous n’arrivez Questions? Contact the NRC Publications Archive team at
[email protected]. If you wish to email the authors directly, please see the first page of the publication for their contact information.
https://publications-cnrc.canada.ca/fra/droits
L’accès à ce site Web et l’utilisation de son contenu sont assujettis aux conditions présentées dans le site LISEZ CES CONDITIONS ATTENTIVEMENT AVANT D’UTILISER CE SITE WEB.
Technical Report (National Research Council of Canada. Ocean, Coastal and
River Engineering); no. NRC-OCRE-2019-TR-041, 2019-11-29
READ THESE TERMS AND CONDITIONS CAREFULLY BEFORE USING THIS WEBSITE.
https://nrc-publications.canada.ca/eng/copyright
NRC Publications Archive Record / Notice des Archives des publications du CNRC : https://nrc-publications.canada.ca/eng/view/object/?id=46bba4e8-3ff1-41c7-a5c9-40d3a5f140e5 https://publications-cnrc.canada.ca/fra/voir/objet/?id=46bba4e8-3ff1-41c7-a5c9-40d3a5f140e5
NRC Publications Archive
Archives des publications du CNRC
For the publisher’s version, please access the DOI link below./ Pour consulter la version de l’éditeur, utilisez le lien DOI ci-dessous.
https://doi.org/10.4224/40002043
Access and use of this website and the material on it are subject to the Terms and Conditions set forth at
Methodology for estimating exposure time in Polar regions
Piercey, Caitli; Kennedy, Allison; Power, Jonathan
Choose sensitivity level
ANNEX
Methodology for Estimating Exposure Time in
Polar Regions
Report No.: NRC-OCRE-2019-TR-041
Prepared for: Nathalie Godin
Arctic and Large Vessels, Design and Equipment
Transport Canada
[email protected]
1-613-990-1534
Revision 1.0
Date: November 29, 2019
Author(s): Caitlin Piercey, M.A.
Allison Kennedy, P.Eng.
Jonathan Power, Ph.D.
Ocean, Coastal, and River Engineering
Research Centre
NRC.CANADA.CA
© (2019) Her Majesty the Queen in Right of Canada, as represented by the National Research Council Canada.
Paper: Cat. No.NR16-300/2019E ISBN 978-0-660-33318-2 PDF: Cat. No. NR16-300/2019E-PDF
ISBN 978-0-660-33317-5
Restriction on Disclosure
This document contains proprietary information, which may not be disclosed, duplicated, or used, in whole or in part, for any purpose other than for the specific purpose for which it was disclosed. At any time, and upon request by the National Research Council Canada, any physical or digital copies of this document must be destroyed and/or returned to the National Research Council Canada.
Revision History Documen
t Version Name Affiliation
Date of
Changes Comments
0.9 Caitlin Piercey NRC-OCRE Nov 22, 2019
Draft for review by Arctic Program Lead and Director of
Research 1.0 Caitlin Piercey NRC-OCRE Dec 2, 2019 Final Copy
Methodology for Estimating Exposure Time in Polar Regions iii Report Number: Program Arctic Technologies Project Number A1-016579 Publication Type Technical Report Title (and/or other title)
Methodology for Estimating Exposure Time in Marine Polar Regions
Author(s) – Please specify if necessary, corporate author(s) and Non-NRC author(s) Caitlin Piercey, Allison Kennedy, Jonathan Power
Client(s)
Transport Canada
Key Words ( 5 maximum)
Arctic, Polar, Exposure, Search, Rescue
Pages 33 Confidentiality Period Security Classification UNCLASSIFIED Distribution UNLIMITED
How long will the report be Classified/Protected? Limited Distribution List ( mandatory when distribution is Limited)
Date: VER # Description: Prepared
by:
Check by:
22/11/2019 0.9 Draft CP JP
29/11/2019 1.0 Final Copy CP AB and MR
Click here to enter a date.
X
Program Lead/Team Lead
X
Director of R & D
NRC – OCRE Addresses Ottawa
1200 Montreal Road, M-32 Ottawa, ON, K1A 0R6
St. John’s
P.O. Box 12093, 1 Arctic Avenue St. John’s, NL, A1B 3T5
Executive Summary
This report provides a methodology for estimating exposure time in Polar Regions. Using information provided by Canadian Search and Rescue (SAR) personnel and published by Kennedy et al. in 2013, a formula for calculating exposure time was developed and implemented in Python to estimate exposure time at any location in the Polar Regions. Variables considered in the calculation of exposure time include rescue craft speed, capacity, and range, proximity of bases and ports to the route of interest, the number of individuals awaiting rescue, and the number of survival crafts deployed. Other factors are related to SAR response, and include the time to deploy a task force, the time to receive communications, and search and rescue time. Presently, the International Maritime Organization’s International Code for Ships Operating in Polar Waters (2017, the Polar Code) stipulates that the maximum expected time of rescue in the event of a maritime emergency must be no less than five days; this means that all equipment must be functional for at least the maximum expected time of rescue. This report therefore compares a maximum expected time of rescue of no less than five days with the estimated exposure time.
The results indicate that, particularly as new and more remote routes open up in the Polar Regions, estimated exposure time may be in excess of a maximum expected time of rescue of no less than five days. Therefore, as the Polar Code requires that life-saving appliances (LSA) support human survival for the maximum expected time of rescue, individuals may find themselves awaiting rescue beyond the required functionality of this equipment.
The report therefore recommends:
1. Utilizing the suggested methods to determine exposure times along the route of interest, and thus determining the level of LSA required to ensure survivability in the event of a maritime emergency.
2. Further research into the areas of bathymetry, international SAR response standards, and communication delays in Polar Regions, in order to further refine the predictive model of exposure time.
Methodology for Estimating Exposure Time in Polar Regions v
Table of Contents
Executive Summary ...iv
1.
Introduction ... 7
1.1.
Literature Review ... 8
2.1.
Establishing Areas of Interest... 11
2.2.
Resource selection ... 12
2.2.1
Helicopter ... 12
2.2.2.
Fixed-Wing Aircraft ... 12
2.2.3.
Marine Vessels ... 13
2.2.4.
Resource location ... 13
3.
Methodology ... 13
3.1.
Determination of Variables ... 15
3.2.
Sources of Potential Delay ... 16
4.
Calculating Estimated Exposure Time ... 18
4.1.
Phase 1: Initial Communications ... 18
4.2.
Phase 2: Travel to Location ... 19
4.3.
Phase 3: Search Time ... 19
4.4.
Phase 4: Rescue Time ... 20
4.5.
Phase 5: Multiple Loads of Evacuees ... 21
4.6.
Total Exposure Time ... 23
5.
Sample Scenarios ... 24
5.1.
Scenario 1 ... 24
5.2.
Scenario 2 ... 27
5.3.
Discussion ... 32
6.1.
Limitations and Assumptions... 34
6.2.
Recommendations for Future Research ... 35
7.
Acknowledgements ... 36
9.
References ... 37
Appendix A ... 39
Appendix B ... 40
List of Figures
Figure 1: The eight locations studied by Kennedy et al. (2013). [5] ... 9
Figure 2: Factors, as ranked by Canadian SAR experts, affecting exposure time. [5] ... 9
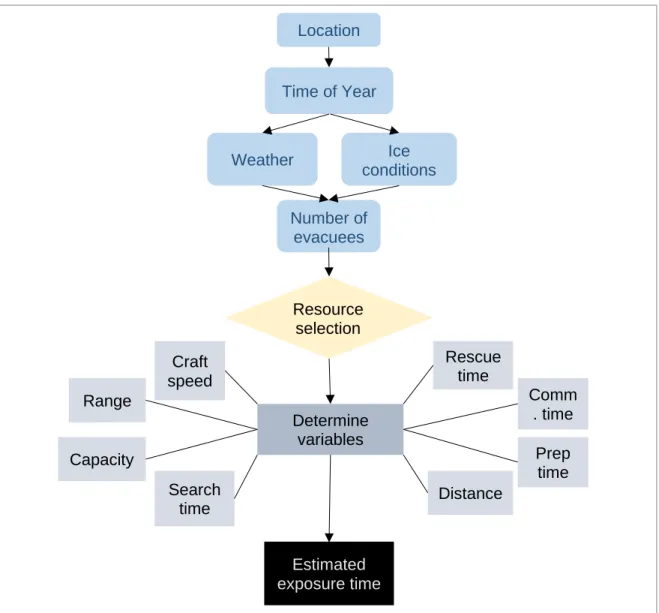
Figure 3: A flowchart demonstrating the methodology for estimating exposure time. ... 17
Figure 4: Flowchart showing basic phases of exposure time. ... 21
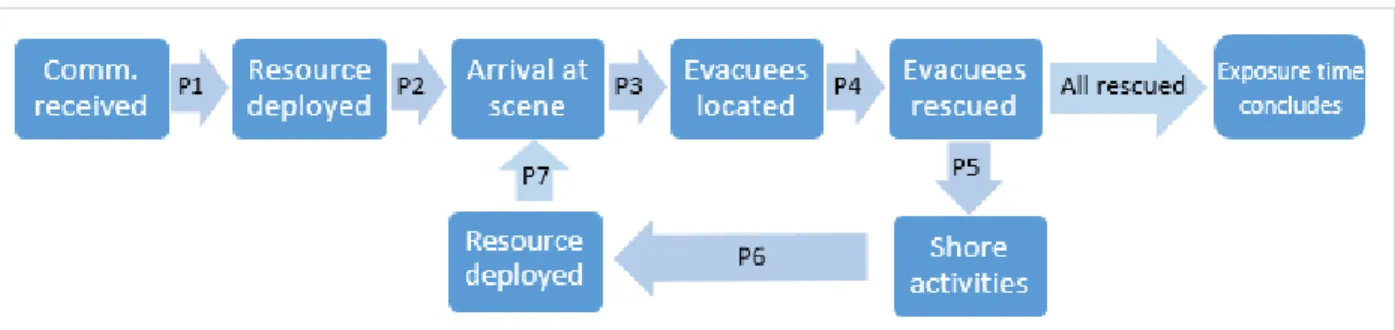
Figure 5: Flowchart showing phases of exposure time with multiple loads of evacuees. ... 22
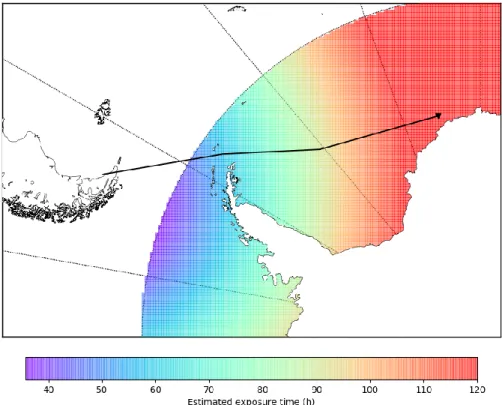
Figure 6: Route of the stricken vessel as well as the location of the incident. ... 24
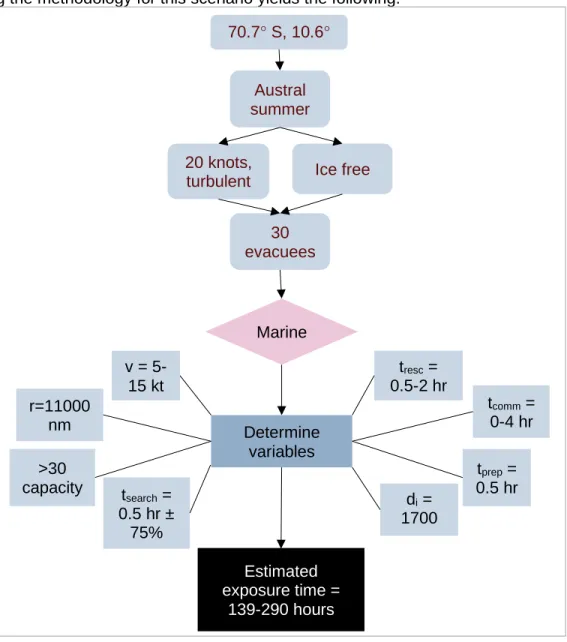
Figure 7: Flow chart determining resource and variables for scenario 1. ... 25
Figure 8: Flow chart for determining resources and variables for scenario 2 with air resource deployment. ... 27
Figure 9: Route of the vessel and the location of the incident, as well as the average exposure times along the route if an air asset were deployed. ... 29
Figure 10: Flow chart for determining resources and variables for scenario 2 when a marine resource is deployed. ... 30
Figure 11: Route of the vessel and the location of the incident, as well as the average exposure times along the route if a marine asset were deployed ... 32
Figure 11: The Arctic Region as defined by IMO [1]. ... 39
Figure 12: Antarctic Search and Rescue Regions [14] ... 40
Figure 13: Arctic Search and Rescue Regions [15]. ... 40
Figure 14. Wind speed and subsequent drift speed [16]. ... 41
List of Tables Table 1. Results from Kennedy et al., 2013 [5], giving estimated exposure time in hours.Error! Bookmark not defined. Table 2. Variables for scenario 1. = consultation with SAR personnel is recommended: ... Error! Bookmark not defined. Table 3. Variables for scenario 2 (air): = consultation with SAR personnel is recommended: .... Error! Bookmark not defined. Table 4. Variables for scenario 2 (marine): = consultation with SAR personnel is recommended: ... 31
1. Introduction
Recent years have witnessed an increase in marine traffic throughout the Polar Regions. As new opportunities for shipping and new technologies make travel through these hazard-prone areas more viable, the number of vessels and size of their complements in Arctic and Antarctic waters is growing. Accordingly, as human presence in Polar Regions increase, so too does the risk of a maritime emergency, and thus the demand on search and rescue (SAR) resources.
Due to the lack of infrastructure and overall remoteness at high latitudes, those who are forced to evacuate a stricken ship in Polar Regions may have to wait a considerable time for rescue. In 2017, the International Maritime Organization (IMO) brought into force the International Code for Ships Operating in Polar Waters (Polar Code) in response to the unique risks associated with polar travel. Amongst other things, the Polar Code stipulates that all life-saving appliances (LSA) must provide safe evacuation and be functional for the maximum expected time of rescue of not less than five days [1].
Multiple incidents of vessels in distress in Polar Regions are on record. Of note, in 2007, the MV Explorer struck an iceberg and sank off the coast of Antarctica. Passenger accounts suggest that survival was largely due to good weather and the nearby presence of another vessel [2]. Other incidents have had worse outcomes; the trawler Insung No. 1 sank off the coast of Antarctica in 2010, with only 20 of the 42 crew rescued from the cold waters [3]. 2010 also saw the grounding of the Clipper Adventurer near Kugluktuk, Nunavut resulting in risk to passengers as well as environmental costs [4].
In 2013, Kennedy et al. published a report outlining a methodology for estimating exposure time in the Canadian Arctic [5]. Exposure time indicates the total time that an evacuee or set of evacuees await rescue following a marine evacuation. Based on the results of Kennedy et al’s (2013) report, individuals in the Canadian Arctic may be awaiting rescue for far longer than the maximum expected time of rescue as set by the Polar Code. Thus, when estimated exposure time exceeds the five day minimum, evacuees may be at risk if LSA that support longer duration survival times are presently unavailable. On the other hand, it is worth noting that situations may also present themselves whereby the maximum expected time of rescue is indeed less than five days.
Through a generalization of the work first presented by Kennedy et al. (2013), in order to apply it more broadly to the Polar Regions, this report will present a methodology upon which guidelines for estimating exposure times in these areas can be calculated. This methodology is in response to section 5.9.2 of IMO SSE 6/18, where interested Member States were invited to submit work on how to determine the maximum expected time of rescue [6]. The methodology will lead to a final equation to calculate estimated exposure time, using variables of craft speed, distance travelled, proximity to fuelling locations, capacity of rescue craft, number of evacuees, rescue craft range, number of survival crafts, and other variables. Finally, using this equation and a computer program developed in using the programming language Python, the estimated exposure time along given routes will be determined. The estimated exposure time will denote the maximum expected time of rescue for the route.
1.1.
Literature Review
Kennedy et al.’s (2013) “Evaluating Exposure Time until Recovery by Location” report used a qualitative analysis with contributions from Canadian SAR experts to help establish an estimated exposure time for eight predetermined locations in the Canadian Arctic. The study included the responses from multiple Canadian SAR experts on the impact of different factors, such as ice concentration, weather conditions, bathymetry, and crew experience, on exposure time. The results were then discussed amongst the 14 workshop participants representing SAR resources throughout Canada to elaborate on and help quantify the impact of these factors. Using these results, Kennedy et al. (2013) established low and high estimates for exposure time, for situations wherein a stricken ship is awaiting help by both marine and air resources.
For the purposes of their report, Kennedy et al. (2013) described a scenario wherein a ship with 18 persons on board (POB) requires assistance in the Canadian Arctic. The 18 individuals evacuate into two lifeboats, and are considered to be awaiting rescue. Applying this scenario to the eight locations chosen for the report, a methodology to estimate total exposure time was derived using contributions from Canadian SAR experts in an equation to determine the high and low estimate for both marine and air resources. The results are summarized in the table below, and the eight locations studied, chosen based on maritime traffic, are indicated in Figure 1.
Table 1. Results from Kennedy et al., 2013 [5], giving estimated exposure time in hours.
Exposure (h) Location 1 2 3 4 5 6 7 8 Marine Low 26 26 13 14 26 13 13 7 High 202 222 145 88 123 71 132 33 Air Low 18 17 16 14 11 10 12 11 High 26 25 25 21 18 17 19 17
Figure 1: The eight locations studied by Kennedy et al. (2013). [5]
To determine this estimated exposure time, Kennedy et al. (2013) developed an exposure timeline, which focuses on four main phases of a SAR event: initial communications, travel to location, search period, and rescue activities [5]. Furthermore, Canadian SAR experts (marine and air) ranked several listed factors in terms of their impact on exposure time.
Four variables were established based on Canadian SAR response and used in calculating exposure time. These variables were communication time, transit time, search time, and rescue time, and were quantified and used to calculate total exposure time, including the potential increases and decreases in exposure time due to the above listed factors. Kennedy et al. (2013) concluded the following in regard to the four variables used in calculating exposure time [5]:
1. Communication time: There may be significant delay in communications, particularly at extreme latitudes, due to ionospheric and geographical interference with radio waves [7]. Canadian SAR experts indicated that communication time could take up to four hours and, in extreme circumstance, up to 12 hours.
2. Transit time:
a. There was a near-universal consensus among Canadian marine SAR responders that poor bathymetric data could increase transit time by over 20%, with only one location of those given with an increase in time of less than 5%, when a marine SAR resource is deployed. While further research would be required to determine the appropriate delay for Polar Regions outside of the Canadian Arctic, it is important to note that poor bathymetric data can have a significant impact on exposure time. The quality of bathymetric data available in a given region should therefore be considered. b. For every location listed, an increase in transit time of over 20% in the case of harsh weather when a marine SAR resource is deployed was estimated. As above, further research could indicate more precise delays in other regions.
c. There was, for every location listed, a potential increase in transit time of over 20% in the case of crew and captain inexperience when a marine SAR resource is deployed. Again, this number may vary in different regions, and can be estimated through consultations with SAR personnel of those regions. 3. Search time: Search time was estimated using drift speed and quantifying the effect of inclement weather, poor visibility, poor bathymetric data, limited communications capabilities, and limited crew experience.
4. Rescue time: Rescue time was estimated using Canadian SAR contributions, and was considered as being impacted by weather. The time taken to rescue a complement of persons from a lifeboat was estimated at 1-2 hours for a marine resource, while the estimated time to winch an individual to a rescue helicopter was taken from ten minutes to greater than twenty.
2. Generalization of Methodology
The following section sets out to establish a methodology for estimating exposure time in Polar Regions, based on a generalization of the work completed by Kennedy et al. (2013), which focused exclusively on the Canadian Arctic. This methodology will begin with a discussion on establishing areas of interest, followed by considerations in resource selection, determination of variables, and a final calculation providing a range of estimated exposure times. Following this methodology, a simple model has been developed to calculate a low and high estimated exposure time based on user input. To describe the methodology, some key terms must first be established: Exposure time: Exposure time is taken to be the total time that an individual or individuals are exposed to the elements following a marine evacuation, including time spent inside a survival craft. For the purposes of this report, the exposure period will be considered to begin when the stricken ship sends its first signal of distress1. Exposure time concludes with the rescue of the
final evacuee.
Polar Regions: For the purposes of this report, the Polar Regions consist of regions in both the Arctic and Antarctic waters. The Arctic region consists of the area surrounding the Arctic Circle (illustrated in Appendix A) and the Antarctic region consists of the waters surrounding the continent below 60°S [1].
Vessel of opportunity: A vessel of opportunity is any ship that may be called upon and diverted to assist with a maritime emergency.
Ice conditions: Ice conditions refers to both the concentration of ice in an area (X/10ths) and the type/thickness of the ice.
2.1. Establishing Areas of Interest
Prior to the voyage, a vessel operator will have established the route their ship will take, and during what time of year it will transit. Therefore, from the perspective of the vessel operator, this pre-planned route can be considered their respective area of interest.
A vessel operator will establish the known route of their vessel as the area of interest, and will thus assess the estimated exposure time along the known route.
In the event of no known route, areas of interest may be based on marine routes commonly taken in the region considered, and can be determined from patterns of historical marine traffic. Further to this, potential new routes, or exploration in new regions may also be considered potential areas of interest. For example, Kennedy et al. (2013) considered the receding sea ice in the Canadian Arctic during location selection [5], and thus determined a potential increase in popularity in routes in the high Arctic, such as routes extending beyond 80°N. Increased interest in new routes on account of a reduction in sea ice extent and thickness is a growing possibility
1 A distress signal is considered to be a mayday call, an automated signal such as an Emergency
Position-Indicating Radio Beacon (EPIRB) signal, or any other means of signalling immediate distress. A pan-pan signal does not indicate immediate distress and is therefore not considered as initiating exposure time.
within the expedition cruise industry, coupled with the development of more advanced icebreaking cruise ships, and perhaps a corresponding interest for cargo traffic up and over a North Pole route.
Information regarding the chosen area will contribute to the estimation of exposure time. Patterns of marine traffic will differ when comparing different types of ships, and thus this must be considered; there are regions in which it is very unlikely to see a cruise ship, for example, and therefore there is unlikely to be a ship with a large number of potential evacuees. However, other regions, such as the Antarctic Peninsula or the North Pole, are becoming increasingly popular among cruise ships despite their remote nature, and their complements can range from 100 to several hundred. Therefore, the area of interest will indicate the potential types of vessels likely to require help.
Search and Rescue Regions (SRRs) should also be considered when determining areas of interest, as SRRs dictate which nation is responsible for coordinating SAR efforts in the area. Global SRRs are displayed in Appendix A. Furthermore, special consideration must be paid for routes travelling through particularly remote locations, such as to the North Pole or, generally speaking, to the waters surrounding Antarctica. These areas, particularly Antarctica, have very little infrastructure nearby and may pose a higher risk of long exposure times.
2.2. Resource selection
The type of resource deployed will have a significant impact on exposure time. There are several factors to consider in the selection of the resource to be deployed; these are elaborated on below. The main types of resources likely to respond in the event of a maritime emergency are as follows:
2.2.1
Helicopter
Helicopters travel relatively quickly, and are particularly useful in SAR missions for their ability to hover in place under the control of a pilot while lifting evacuees from the water or survival craft. Helicopters deployed in SAR missions generally have relatively low passenger capacity and range; they are, however, fast when compared to marine resources. They are also not limited by areas of high ice concentration.
Helicopters are generally unsafe to fly at high levels of turbulence. As well, if a maritime emergency is a significant distance from shore, and there is no fuelling station nearby, the range of a helicopter may render it unable to assist. The Cormorant helicopter used by the Canadian Coast Guard, for example, has a range of approximately 500 nm [8]; distances approaching this, unless fuel is nearby, may not be accessible by helicopter. Due to the lack of infrastructure in the Polar Regions, fuelling locations are remote and may cause an issue for helicopter usage.
2.2.2. Fixed-Wing Aircraft
Fixed-wing aircraft can be useful in SAR missions for searching for and dropping emergency supplies to evacuees. Those fixed-wing aircrafts in SAR fleets are generally unable
to assist in picking up evacuees; however, due to their speed, they can effectively begin searching for evacuees and can communicate this information to helicopters or vessels. Other fixed wing aircraft may be able to land on ice or open water; however, these are not considered as primary resources in this report, which considers helicopters as the main responding air resource.
2.2.3. Marine Vessels
Marine resources come in a variety of sizes, but generally have a larger capacity than aircraft and may therefore be able to assist larger numbers of evacuees at one time. They are, however, far slower than air resources, and, in remote areas, can take days to transit to the location of the incident.
2.2.4. Resource location
Air resources are generally predictable in their location. This methodology assumes that helicopters are available at their respective bases, and that fuel is readily available at stations which generally supply fuel.
Marine resources, however, are less predictable, as a ship may be in port or on patrol; thus, if a marine SAR asset is tasked to an emergency, its initial location will be determined at the time of tasking. Thus, for the purposes of estimating exposure time, marine resources are assumed to be deployed from port, as one cannot confidently assume another initial location.
Exposure time can be greatly reduced with the assistance of a nearby vessel of opportunity (VOO). A vessel of opportunity is a nearby ship that can be diverted to assist another vessel in need. Some Polar locations (i.e. Svalbard or the Antarctic Peninsula) will see higher traffic than other locations in the same region, but traffic is generally lower than in non-Polar locations. Due to the unpredictability of the presence of VOOs in Polar Regions, this methodology does not take VOOs into consideration as a factor that could decrease exposure time. In the event of a VOO responding to a maritime emergency, it will decrease exposure time, and therefore using the potential location of a VOO to estimate exposure time may offer an overly optimistic estimate.
A number of volunteer organizations in several Polar Nations are dedicated to an involvement in the SAR process. Some of these organizations, such as the Canadian Coast Guard Auxiliary, rely on volunteers to respond with their vessels in the event of an emergency. These vessels, however, are not considered a primary resource, as they may not be required to be on standby, unlike official SAR teams, and thus the response is less predictable and quantifiable.
The methodology for determining exposure time requires first considering the following factors, which have an impact on the SAR resource deployed to the scene, which will affect exposure time. In some cases, both air and marine resources may be able to respond. However, there are some limitations to both resources, and thus the following factors can help determine which resource may be preferable. In the event where either resource can respond, exposure time should be calculated for both types of resources, and the greater exposure time should be assumed as the total exposure time.
1. Area of interest/route: The first factor to consider is the given route of the vessel. Once the transit route has been determined (either from the vessel operator planning the voyage, or selecting an area based on marine traffic), the following can be identified:
a. Expected weather: The expected weather of the locations along the route may dictate the type of resource available for the SAR mission. For example, if a location is prone to turbulent winds, a helicopter may not be able to access the area. Therefore, the resources chosen would be limited to marine.
b. Ice conditions: Similar to weather, the ice conditions of the region may render a resource unable to access the area, or may dictate that a marine resource can only access the area with the assistance of an icebreaker.
c. Distance to SAR resource: The distance from the emergency site to the nearest viable SAR resource can be calculated from the distance to a base or port. This distance will be used to calculate the transit time to the scene.
d. Distance from shore/fuelling station: The range of a helicopter may dictate that it is unable to travel a great distance away from shore without requiring refuelling; in Polar Regions, locations for refuelling are few, and thus a helicopter may not be able to safely participate in SAR efforts in certain locations. Though helicopter ranges vary, a SAR helicopter generally can fly within the range of 130 – 730 nm [9]. If the distance to the emergency location and back to shore exceeds this, a helicopter is not a viable resource, unless a ship with a helipad is assisting. Therefore, the location may automatically determine what resources are likely to respond. If, for example, the location of the incident is a significant distance from shore, a helicopter may not have the range to be a viable option. Further, some regions may be prone to weather or ice conditions that would render a type of resource inutile.
2. Time of year: Once location is known, the time of year should be determined. Certain months, where polar travel is not viable, may be excluded depending on vessel class. The following factors are influenced by time of year:
a. Weather: As determined by location, the expected weather can be further clarified by the time of year. This may eliminate potential SAR resources as not viable for the region.
b. Ice conditions: As above, ice conditions will be further clarified by specifying time of year, and may eliminate specific SAR resources.
If a required resource is not determined by location and time of year (and, subsequently, weather and ice conditions), other factors may be considered:
3. Number of evacuees: The number of evacuees awaiting rescue may impact the choice of SAR resource, as air resources may have much lower capacities than marine resources. Thus, if a cruise ship with hundreds or even thousands of evacuees requires assistance, rescuing them via helicopter would require many loads and thus a significant period of time. However, this is a secondary factor: if weather or ice dictates that only one type of resource can operate safely, then the resource is limited by those factors regardless of the number of evacuees.
3.1. Determination of Variables
Following the consideration of the above factors, the resource most likely to respond to an emergency scenario can be determined. From this, the following variables can be identified, which will be used in estimating exposure time:
1. Cruising speed (v): The cruising speed of the resource chosen, in knots. The low and high velocity range varies among different rescue crafts.
2. Range (r): The distance a resource can travel without needing to refuel, in nm. 3. Capacity (cap): The number of evacuees a resource is able to take on board at one
time.
a. Loads (ℓ): Based on capacity of the resource and the number of evacuees, the number of loads of rescued persons can be determined.
4. Refuelling time (tfuel): The time it takes to refuel the resource, in h.
5. Launch time (tprep): The time it takes to deploy the resource, in h.
Further, the location and time of year, as well as the resource chosen, will influence the following potential delays in rescue or dictate time required in different phases of the rescue:
1. Initial distance (di): The initial distance consists of the distance travelled by the rescue
resource to reach the location of the emergency (in nm).
2. Distance to safe port (d): This distance is the distance from the location of the emergency to the nearest point where a rescue resource could drop evacuees and refuel (in nm).
3. Communication time (tcomm): The communication time consists of the time elapsed
between sending and receiving a signal for help. At high latitudes, this time may be longer. Consulting with SAR personnel can give an estimate of this time (in h). Canadian SAR estimated a communication time range of 0-4 hours [5].
4. Preparation time (tprep): This time (in h) consists of the time elapsed during the
preparation and deployment phase of SAR personnel, and can be estimated via consultation with SAR personnel; this can vary based on time of day [5].
5. Search time (tsearch): The time (in h) spent searching for evacuees upon arrival at the
emergency location is affected by weather, ice, and resources deployed. Consulting with SAR personnel can give an estimate of the general time spent searching for evacuees. This report considers the time spent searching for a survival craft containing evacuees rather than searching the water for evacuees in the water, as survival time in Polar waters is likely to be short [10]. Kennedy et al. (2013) estimated search time based on initial distance travelled and drift speed of the survival craft [5].
6. Rescue time (tresc): The time (in h) spent affecting the rescue of evacuees (from
locating evacuees to when they are safely on board the rescue vessel) is impacted by weather, ice, and type of resource deployed, and can be estimated through discussions with SAR personnel. Canadian SAR estimated a rescue time of 1-2 hours per lifeboat for a marine resource, and 10 minutes to over 20 minutes per person for an air resource [5].
These are the main variables used in calculating an estimated exposure time.
3.2. Sources of Potential Delay
As indicated by Kennedy et al. (2013), there are numerous potential reasons for delays in rescue in Polar Regions. These delays will impact some of the variables determined above. To establish accurate values for these variables, consultation with SAR personnel is recommended.
Variables that may be affected are:
1. Cruising speed: Weather and ice conditions may slow a vessel. 2. Launch/prep time: Preparation time may be affected by poor weather.
3. Communication time: Locations in the Polar Regions, particularly closer to the poles (above 70°N, for example) may have ionospheric interference that decreases the effectiveness of a communication system. Communications can take up to several hours [5].
4. Search time: In poor weather, particularly due to precipitation or fog, or due to long periods of darkness, it may take longer to locate evacuees, thus increasing search time. Poor communication may also affect this variable.
5. Rescue time: The time to rescue the evacuees can increase due to ice conditions or poor weather, thus hindering the rescue process.
Figure 3: A flowchart demonstrating the methodology for estimating exposure time.
The definition of these variables, along with information about the emergency scenario, then allows for a calculation of estimated exposure time.
Location Time of Year Weather Ice conditions Number of evacuees Resource selection Determine variables Estimated exposure time Craft speed Range Capacity Search time Rescue time Comm . time Prep time Distance
4. Calculating Estimated Exposure Time
Calculating the estimated exposure time of evacuees requires calculating the time elapsed in each of the four phases set out by Kennedy et al.’s 2013 report. Using the above methodology, the rescue resource to be deployed is determined; using the specifications of this resource as well as other information about the area and scenario, the estimated exposure time can be calculated. A model was developed to allow for user inputs regarding location, number of evacuees, location of emergency response resources, number of survival crafts, rescue craft speed, rescue craft range, and SAR input regarding communication time, preparation time, rescue time, and search time periods. The model then calculates a low and high range of exposure time estimates.
4.1. Phase 1: Initial Communications
The initial phase includes the time elapsed between the sending and receiving of initial communications, as well as the time required for SAR resources to prepare and deploy. Communications near the poles may be delayed due to ionospheric and geographical interference [7]. Thus, if there is no predicted communication time available, the equation uses a range of between 0 and 4 hours to make a high and low end estimate of exposure time. This range is based on results from Kennedy et al. (2013) [5].2
Preparation time will be affected by the experience of the crew being deployed, as well as the readiness of the SAR resource being deployed, i.e. whether the responding SAR personnel are on 30 minute standby or longer, for example.
Therefore, the total time for phase 1 can be calculated from:
𝑡1= 𝑡𝑐𝑜𝑚𝑚+ 𝑡𝑝𝑟𝑒𝑝 Equation 1
Where:
t1 = the total time elapsed during phase 1 (h);
tcomm = the time elapsed between the stricken ship sending initial communication and
SAR personnel receiving it (h);
tprep = the time elapsed between receiving communication and deploying (h).
2 The estimated values for communication time, rescue time, and search time are taken from Kennedy et al.,
(2013), and apply specifically to the Canadian Arctic. These values can be adopted for an estimation of exposure time in any region, but it is recommended that a more precise estimate be calculated by obtaining values for a specified region from the appropriate experts or authorities.
4.2. Phase 2: Travel to Location
The second phase consists of the time elapsed while the SAR resource travels from its initial location to the site of the emergency. This phase does not consist of the time spent searching for evacuees, but rather ends upon arrival at the location of the emergency.
Distance can be calculated as a straight line distance using the haversine formula [11] and coordinates of the emergency location and nearest resource. This method works best for the distance travelled by air resources, as marine resources rarely travel in a straight line. The distance to be travelled by a marine resource should be determined from sea routes, to account for travelling around land mass and other obstacles.
In certain cases, the rescue resource may have to make stops along the initial distance; for example, a helicopter may require refueling and a crew change over long journeys. Thus, considering travel time and including stops with time spent relaunching the craft, preparation time, and refueling time, phase 2 is defined as:
𝑡2 = 𝑑𝑖
𝑣 + (𝑡𝑐𝑟𝑒𝑤+ 𝑡𝑓𝑢𝑒𝑙) × 𝛽 Equation 2
Where:
di = distance travelled from initial location (nm);
v = cruising speed of the rescue resource (kt).
tcrew = the time for the crew to switch and relaunch (h);
tfuel = the fueling time of the craft (h);
β = number of stops required.
To determine the number of stops required by a craft based on range, the following equation can be used. Note that the number of stops is rounded to the highest natural number (including and above 0).
𝛽 = ⌈𝑑𝑖
𝑟⌉ − 1, { 𝛽 ∈ ℕ} Equation 3
Where:
r = range of craft (nm).
4.3. Phase 3: Search Time
The search time consists of the time period from arrival at the scene to locating evacuees in need of rescue. This period is heavily affected by weather, visibility, and resource deployed. As stated previously, this phase does not consider the time to search for evacuees directly in the water, but rather to search for a survival craft, based on the assumption of a short survival time in Polar waters [10]. Kennedy et al. (2013) used drift speed of the survival craft and transit time to
the scene to estimate the search time, based on the movement of the survival craft away from the initial emergency location [5]:
𝑡𝑠𝑒𝑎𝑟𝑐ℎ =
(𝑡2) × 𝑣𝑑𝑟𝑖𝑓𝑡
𝑣𝑠𝑒𝑎𝑟𝑐ℎ Equation 4
Where:
vdrift = drift speed of survival craft (knots);
vsearch = search speed of rescue craft (knots).
Although different survival crafts have different drift speeds, Appendix B provides a figure from Kennedy et al. (2013) that supplies an estimation of drifts speeds for different life rafts. These figures can be used in the absence of figures specific to a given life raft. Furthermore, Kennedy et al. (2013) estimated that search time
Therefore, the time period of the third phase is simply:
𝑡3 = 𝑡𝑠𝑒𝑎𝑟𝑐ℎ× 𝑛ℓ Equation 5
Where:
tsearch = the time elapsed while searching for evacuees to rescue (h).
nℓ = number of lifeboats/life rafts containing evacuees.
4.4. Phase 4: Rescue Time
The rescue period consists of the time elapsed between locating evacuees in need of rescue and getting them safely aboard the rescue craft. For a marine resource, this may consist of pulling alongside the survival craft and transferring the evacuees to the main ship. For an air resource, this may consist of airlifting evacuees from lifeboats to the helicopter. It is worth noting that several factors can slow the rescue process, such as harsh weather, poor visibility, or injured evacuees. Other factors, such as calm weather or evacuees who are able-bodied and experienced, may speed up the rescue process.
Based on Kennedy et al. (2013), a low and high range of values for rescue time was determined. For an air resource, the estimated range of times is 10 minutes per person to approximately 30 minutes per person. For a marine resource, the range of rescue time is 1-2 hours per survival craft.
For a marine resource, the rescue time encompasses the time spent coming alongside a survival craft and rescuing the evacuees inside. For an air resource, the rescue time encompasses the time to winch each evacuee from the survival craft.
Therefore, for a marine resource:
Where:
tr = the time elapsed during a rescue (h);
tresc = total rescue time per rescue attempt (h).
For an air resource:
𝑡𝑟𝑒𝑠𝑐 = 𝑡𝑟−𝑎𝑖𝑟× 𝑐𝑎𝑝 Equation 6b
The total time for the rescue phase is therefore:
𝑡4 = 𝑡𝑟𝑒𝑠𝑐× 𝑛ℓ Equation 7
When all evacuees of the emergency are rescued, the rescue time and, in sum, the exposure time concludes.
4.5. Phase 5: Multiple Loads of Evacuees
In some situations, for example if air resources are deployed to help a stricken ship with a large number of evacuees, there may need to be multiple rescue resources and multiple loads of evacuees taken to safety. This can greatly increase the exposure time as evacuees may be forced to await turns. During the Viking Sky incident in 2019, for example, passengers were airlifted to multiple helicopters and brought to shore before the helicopters returned to collect more. The coordination of the SAR crews as well as the proximity to shore made this an efficient process; in the high Arctic, however, the safe base to deliver evacuees may be a significant distance away, or a marine resource may be required to coordinate with the helicopter for taking evacuees.
If this is the case, the additional trips must be accounted for when calculating estimated exposure time. Without considering multiple loads, the four phases of exposure time progress as shown in Figure 4:
Figure 4: Flowchart showing basic phases of exposure time.
However, considering the potential of multiple loads, the phases of exposure time progress as shown in Figure 5. Phase 5 occurs only when there are more evacuees awaiting rescue. If all evacuees have been rescued, the exposure time concludes.
Comm. sent Resource deployed Arrival at location Evacuees located Rescue complete P1 1 P2 1 P3 1 P4 1
Figure 5: Flowchart showing phases of exposure time with multiple loads of evacuees.
The number of loads of evacuees to be rescued can be determined thusly: ℓ = ⌈ 𝑛
𝑐𝑎𝑝⌉ , {ℓ ∈ ℕ} Equation 8
Where:
ℓ = number of loads; n = number of evacuees;
cap = total capacity of rescue resources.
The number of loads is rounded to the highest non-decimal number (0 and greater). Thus, if multiple aircraft are deployed, the total capacity is calculated as the sum of their capacities.
The time spent travelling from the emergency site to the safe base and back, and then rescuing the next load, can then be calculated as
𝑡5 = (𝑡4+ 2 × 𝑑
𝑣) × (ℓ − 1) Equation 9
Where:
d = distance to safe base to which evacuees are brought.
The final factor to be considered is the time spent on shore activities when depositing evacuees. This period may encompass dropping off evacuees, fueling the craft, switching crew members, and preparing for relaunch, and can be considered as:
𝑡6 = 𝑡𝑠ℎ𝑜𝑟𝑒
4.6. Total Exposure Time
Considering the total time elapsed during the four phases, the total estimated exposure time can be determined from the summation of the four phases. This summation yields:
𝑡 = 𝑡𝑖+ 𝑡2+ 𝑡3+ 𝑡4+ 𝑡5+ 𝑡6 Equation 10
Alternatively, combining the terms of each phase,
𝑡 = 𝑡𝑐𝑜𝑚𝑚+ 𝑡𝑝𝑟𝑒𝑝+
𝑑𝑖
𝑣 + (𝑡𝑐𝑟𝑒𝑤+ 𝑡𝑓𝑢𝑒𝑙) × 𝛽 + 𝑡𝑠𝑒𝑎𝑟𝑐ℎ× 𝑛ℓ+ 𝑡𝑟𝑒𝑠𝑐× ℓ + (𝑡𝑠ℎ𝑜𝑟𝑒+ 2 𝑑
5. Sample Scenarios
The follow scenarios illustrate how the methodology and calculation function. The variables of each scenario were used as inputs in a Python computer program to return the high, low, and average range of estimated exposure times, as well as maps indicating high, low, and average exposure times in the chosen region.
5.1. Scenario 1
A fishing vessel with 30 crew strikes ice off the coast of Antarctica while fishing, at 70.7° S, 10.6°W. The crew signals for help before evacuating into two life rafts. The ship itself sinks with all crew having successfully evacuated. At this location, the ship is approximately 1300 nm from the Antarctic Peninsula, which, based on tourism numbers from IAATO (International Association of Antarctica Tour Operators) is the busiest location on the continent in terms of marine traffic [12]. Due to the remoteness of the location, the Argentinian Joint Rescue Coordination Centre (JRCC) deploys a marine resource. Assuming no vessel of opportunity is nearby, the deployed resource will leave port at Ushuaia. It will travel approximately 1700 nm to reach the scene. It is the austral summer and therefore sea ice has receded enough to allow the marine resource to travel to the area at a relatively quick speed.
Following the methodology for this scenario yields the following:
Figure 7: Flow chart determining resource and variables for scenario 1.
The flow chart indicates that a marine resource is likely to be deployed. Notably, determining the number of evacuees is not relevant to final resource selection in this scenario, since the distance to the incident site exceeds the range of most helicopters. Furthermore, although some helicopters are stationed on the continent, at research stations, they are generally lower-range helicopters used for transportation rather than rescue operations.
The variables are listed in the table below.
70.7° S, 10.6° W Austral summer
20 knots,
turbulent Ice free
30 evacuees Marine Determine variables Estimated exposure time = 139-290 hours v = 5-15 kt r=11000 nm >30 capacity t search = 0.5 hr ± 75% tresc = 0.5-2 hr tcomm = 0-4 hr tprep = 0.5 hr di = 1700 nm
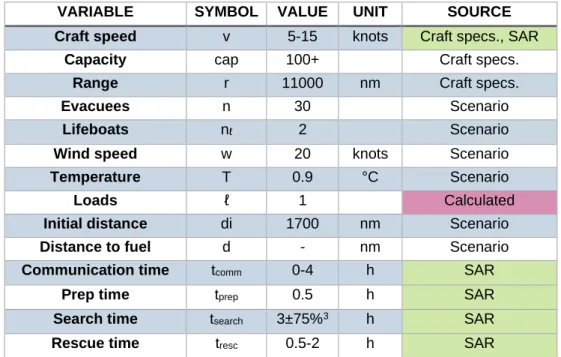
Table 2. Variables for scenario 1: = consultation with SAR personnel is recommended:
VARIABLE SYMBOL VALUE UNIT SOURCE
Craft speed v 5-15 knots Craft specs., SAR
Capacity cap 100+ Craft specs.
Range r 11000 nm Craft specs.
Evacuees n 30 Scenario
Lifeboats nℓ 2 Scenario
Wind speed w 20 knots Scenario
Temperature T 0.9 °C Scenario
Loads ℓ 1 Calculated
Initial distance di 1700 nm Scenario
Distance to fuel d - nm Scenario
Communication time tcomm 0-4 h SAR
Prep time tprep 0.5 h SAR
Search time tsearch 3±75%3 h SAR
Rescue time tresc 0.5-2 h SAR
As noted previously, the communication, prep, search, and rescue times are based on estimates given by Canadian SAR experts. Therefore, if estimating exposure time in an SRR not governed by Canada, SAR experts for the given SRR may be able to provide a more precise value.
Using equation 8 and the variables as determined from the methodology, the range of estimated exposure times for this scenario is 139-290 hours, which is above the five day minimum standard set by the Polar Code [1].
Alternatively, if an expedition vessel was visiting the Antarctic Peninsula at this time, and was able to be diverted to assist, the exposure time could be reduced to a little over 100 hours, depending on specific location. However, this variable is too uncertain to be reliable in estimating exposure time. Furthermore, potential expedition ship crew inexperience in rescue operations could actually prove dangerous in transferring persons from survival crafts to the ship. Similarly, another fishing vessel in the region may be able to assist, but this is again unreliable.
3 Search time is estimated from Kennedy et al. (2013) (see Appendix C) from a wind speed of 20 knots. At 20
knots, the survival crafts will drift at a speed of approximately 0.4 knots; during the transit phase of the rescue resource, the life raft drifts an additional approximate 45 nm, requiring approximately another 3 hours of transit for the vessel.
5.2. Scenario 2
The second scenario consists of a maritime emergency in Arctic waters. A ship with 450 persons on board is evacuated while travelling to the North Pole on an expedition cruise. The evacuees are in eight survival crafts (lifeboats and life rafts). Due to the high latitude of almost 80°N, communication time may be delayed. The expedition ship was en route further north when they required assistance; the ship has now sunk entirely. The weather is mild with a relatively warm temperature (approximately 0°C), and winds are relatively calm at 7.5 knots. The ice concentration is fairly high, and the expedition ship itself was an icebreaker.
In this scenario, either resource may be used (air or marine). Estimating exposure time for each resource can help determine the best course of action.
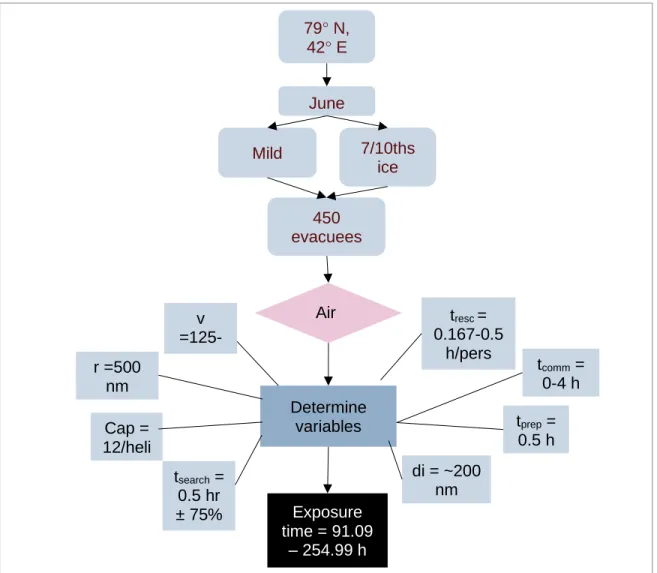
Figure 8: Flow chart for determining resources and variables for scenario 2 with air resource deployment.
79° N, 42° E June Mild 7/10ths ice 450 evacuees Air Determine variables Exposure time = 91.09 – 254.99 h v =125-175 r =500 nm Cap = 12/heli tsearch = 0.5 hr ± 75% tresc = 0.167-0.5 h/pers tcomm = 0-4 h tprep = 0.5 h di = ~200 nm
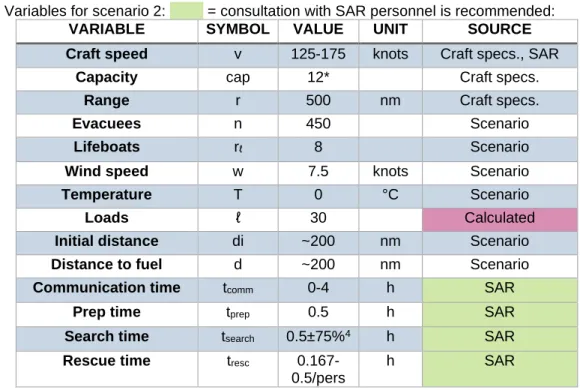
Table 3. Variables for scenario 2: = consultation with SAR personnel is recommended:
VARIABLE SYMBOL VALUE UNIT SOURCE
Craft speed v 125-175 knots Craft specs., SAR
Capacity cap 12* Craft specs.
Range r 500 nm Craft specs.
Evacuees n 450 Scenario
Lifeboats rℓ 8 Scenario
Wind speed w 7.5 knots Scenario
Temperature T 0 °C Scenario
Loads ℓ 30 Calculated
Initial distance di ~200 nm Scenario
Distance to fuel d ~200 nm Scenario
Communication time tcomm 0-4 h SAR
Prep time tprep 0.5 h SAR
Search time tsearch 0.5±75%4 h SAR
Rescue time tresc
0.167-0.5/pers
h SAR
The capacity of each helicopter is 12 passengers; however, six helicopters are deployed, and the total capacity of the rescue resources is therefore 72 passengers per load.
4 Search time is estimated from Kennedy et al. (2013) (see Appendix C) from a wind speed of 7.5 knots. At 7.5
knot wind speed, the survival crafts will drift at a speed of approximately 0.2 knots; during the transit phase of the rescue resource, the life raft drifts less than a nautical mile; thus, the extra search time is approximated as half an hour for searching time.
Figure 9: Route of the vessel and the location of the incident, as well as the average exposure times along the route if an air asset were deployed.
This scenario gives a very wide range of possible exposure times, from 91.09 to 254.99 hours, which is well over five days. This wide range can be explained by the variation in rescue time. As indicated by Kennedy et al. (2013), poor weather and crew inexperience can increase the standard winching time of ten minutes to greater than 20 minutes per person. Thus, depending on weather and crew, the rescue time can vary significantly, resulting in a wide range of values. Therefore, in the case of bad weather, for example, a ship may be a faster rescue resource. Deploying a marine resource for this same scenario yields the following result:
Figure 10: Flow chart for determining resources and variables for scenario 2 when a marine resource is deployed. 79° N, 42° E June Mild 7/10ths ice 450 evacuees Marine Determine variables Exposure time = 43.45 – 137.43 h v =5 – 15 kts r =11000 nm Cap = > 450 tsearch = 0.5 hr ± 75% tresc = 0.5 – 2 h/lifeboa t tcomm0-4 h = tprep = 0.5 h di = ~200 nm
Table 4. Variables for scenario 2 (marine): = consultation with SAR personnel is recommended:
VARIABLE SYMBOL VALUE UNIT SOURCE
Craft speed v 5-15 knots Craft specs., SAR
Capacity cap >450 Craft specs.
Range r 11000 nm Craft specs.
Evacuees n 450 Scenario
Lifeboats rℓ 8 Scenario
Wind speed w 7.5 knots Scenario
Temperature T 0 °C Scenario
Loads ℓ 1 Calculated
Initial distance di ~200 nm Scenario
Distance to fuel d n/a nm Scenario
Communication time tcomm 0-4 h SAR
Prep time tprep 0.5 h SAR
Search time tsearch 0.5±75%5 h SAR
Rescue time tresc 0.5-2 h SAR
5 Search time is estimated from Kennedy et al. (2013) (see Appendix C) from a wind speed of 7.5 knots. At 7.5
knot wind speed, the survival crafts will drift at a speed of approximately 0.2 knots; during the transit phase of the rescue resource, the life raft drifts less than a nautical mile; thus, the extra search time is approximated as half an hour for searching time.
Figure 11: Route of the vessel and the location of the incident, as well as the average exposure times along the route if a marine asset were deployed
It is evident from the model output that the exposure time is shorter if a marine resource is deployed in scenario 2. However, for the purposes of estimating exposure time, the longer exposure time (that of 91.09 – 254.99 hours) should be adopted as the exposure time range, as this represents the highest functional demand on LSA.
5.3. Discussion
The resulting range of exposure times in the scenarios presented above suggests that exposure time can vary widely depending on many factors, and can be less than, or in excess of, five days. Response by helicopter in particular has a wide range of exposure time values; under ideal circumstances, a helicopter can very quickly rescue the distressed individuals. However, under poor circumstances, such as inclement weather, exposure time can increase drastically due to increase rescue time, particularly if the number of evacuees is large.
Thus, in the event where either an air or marine resource can be deployed, both should be considered to determine which option will decrease exposure time. Ships carrying large complements, for example, may be better served by a marine resource, while helicopters are
generally faster to arrive on scene. All variables must be considered in the estimation of exposure time.
6. Conclusion
The example calculations suggest that, in certain remote locations, exposure times may exceed the minimum five days as set by the Polar Code under certain circumstances. This conclusion should be considered when selecting LSA, as those appliances may need to provide support for survival beyond the minimum recommended time of five days. By determining the regions in which a vessel is likely to travel and estimating the corresponding exposure time, a more accurate expectation of the LSA performance required for survival can be established.
6.1. Limitations and Assumptions
Several assumptions were made in the development of this methodology for estimating exposure time. It is assumed that all evacuees are able to evacuate into survival craft. This likely reduces the search time for SAR personnel, as searching for a life raft or lifeboat is simpler than searching for a single individual in the water. This assumption thus simplifies the calculation; however, it is not always reasonable to assume this. It is quite possible that individuals would require assistance from the water. During the Alaska Ranger disaster, for example, 25 individuals of the complement of 47 did not make it into life rafts, and were retrieved from the water; five of those in the water perished [13].
The model further assumes that the survival crafts do not necessarily drift in a pack, thus requiring searching for each survival craft. This assumption represents a high-end estimate, and accounts for potential separation of survival crafts, particularly if the type of crafts are different (i.e. a motor propelled lifeboat versus a life raft without propulsion).
It should also be considered that the estimate is based on a static scenario rather than a dynamic one, which would more accurately reflect reality. In an actual dynamic SAR scenario, different resources might be deployed at different times as availability or weather changes and makes new options available. This report estimates exposure time based on one initial assessment of the scenario, and does not account for changing variables. Therefore, for example, a marine incident in very turbulent winds may make the area too dangerous for a helicopter to assist, thus relying on marine resources. However, if the wind decreased, a helicopter may be able to join SAR efforts and thus decrease exposure time.
The given scenarios also assumed the mothership had sunk entirely, although this may not always be the case. This assumption was made to simplify the estimated search time due to the visual cue of a sinking ship.
Another limitation, as noted earlier in the report, was the lack of certainty regarding vessels of opportunity in Polar Regions. The sample calculations adopted a conservative approach and assumed vessels were being called from their respective ports when calculating exposure time. Furthermore, the type of vessel was limited to ice-capable vessels, in order to reflect the need for a rescue vessel to be able to traverse icy waters. Therefore, the assets of volunteer search and rescue organizations, such as the Canadian Coast Guard Auxiliary, were not included in this analysis, as the types of vessel responding as well as their initial locations (insofar as they may not be required to be on standby) are unpredictable. The inclusion of these
factors could result in an overly optimistic estimate of exposure time when their assistance is not a certainty. However, volunteer SAR teams offer a valuable resource to overall SAR efforts, and can certainly decrease overall exposure time with their assistance.
Finally, Canadian SAR estimates of communication, transit, search, and rescue times were used for the development of this equation. These numbers are reflective of marine emergencies occurring within the Canadian SRR: these values may differ for SRR’s of different nations, as they may have different equipment, deployment times, resources, or other differing factors. Thus, these numbers offer a potential range for these values. SAR experts for different SRRs, however, may be able to provide different values that more accurately reflect the impact their unique assets, and local environmental conditions, could have on estimating exposure time.
6.2. Recommendations for Future Research
Future research could refine the estimated exposure time estimation. Recommended areas of research are:
1. Bathymetric data: Improved bathymetric data for Polar waters would help refine SAR transit time to the scene of an emergency, by establishing preferred routes. 2. Standard SAR times: In order to establish concrete variables for communication,
preparation, search, and rescue times, further testing and research could examine SAR responses from the various Polar nations.
3.
Communications: Research has indicated delays in communication times due to ionospheric and geographical interference. However, testing specific to marine emergencies in both Arctic and Antarctic waters could establish a more precise communications time estimate.4.
Advances in technology:As technology develops, estimates of exposure time may change based on this new technology, which may result in improved communications, faster rescue times, improved search times, or other changes to the variables used in this calculation.7. Acknowledgements
The authors are grateful to Transport Canada for their financial assistance in supporting this work. The authors would like to thank Captain Jack Gallagher and Ms. Katie Aylward for their original work that contributed to the creation of this new methodology.
9. References
[1] International Maritime Organization, "International Code for Ships Operating in Polar Waters," IMO, 2017.
[2] A. White, "Report on the Sinking of the MS Explorer," Royal Institution of Naval Architects, 2008.
[3] Associated Press, "South Korean Trawler sinks in Antarctic, 22 feared dead," 13 December 2010. [Online]. Available: https://www.ctvnews.ca/south-korean-trawler-sinks-in-antarctic-22-feared-dead-1.585448. [Accessed 10 October 2019].
[4] G. Hinchey, "Arctic cruise ship owners ordered to pay $469K in costs for 2010 grounding,"
CBC News, 9 February 2017. [Online]. Available:
https://www.cbc.ca/news/canada/north/cruise-ship-clipper-adventurer-nunavut-judgement-1.3973937. [Accessed 29 October 2019].
[5] A. Kennedy, J. Gallagher and K. Aylward, "Evaluating Exposure Time until Recovery by Location, OCRE-TR-2013-036," National Research Council Canada, 2013.
[6] Sub-committee on Ship Systems and Equipment, "Report to the Maritime Safety Committee," in IMO SSE 6/18, London, 2019.
[7] C. T. d. Carvalho and H. T. Filho, "Radio wave propagation for mobile communication in high frequency," in IEEE Antennas and Propagation Society International Symposium , San Antonio, TX, 2002.
[8] "CH-149 Cormorant," Royal Canadian Air Force, 04 April 2019. [Online]. Available: http://www.rcaf-arc.forces.gc.ca/en/aircraft-current/ch-149.page. [Accessed 17 October 2019].
[9] Air Force Technology, "Sky rescue – the world’s best search and rescue helicopters," Air Force Technology, 19 March 2014. [Online]. Available: https://www.airforce-
technology.com/features/featuresky-rescue-the-worlds-best-search-and-rescue-helicopters-4199760/. [Accessed 20 November 2019].
[10] J. Power, A. Simões Ré, M. Barwood, P. Tikuisis and M. Tipton, "Reduction in predicted survival times in cold water due to wind and waves," Applied Ergonomics, vol. 49, pp. 18-24, 2015.
[11] N. R. Chopde and M. K. Nichat, "Landmark Based Shortest Path Detection by Using A* and Haversine Formula," International Journal of Innovative Research in Computer and Communication Engineering, vol. 1, no. 2, pp. 298-302, 2013.
[12] International Association of Antarctica Tour Operators, "IAATO Overview of Antarctic Tourism: 2018-19 Season and Preliminary Estimates for 2019-20 Season," in XLII Antarctic Treaty Consultative Meeting, Prague, 2019.
[13] National Transportation Safety Board, "Sinking of U.S. Fish Processing Vessel Alaska Ranger: Bering Sea, March 23, 2008," NTSB/MAR-09/05, Washington, D.C., 2008.
[14] COMNAP, "Search and Rescue in the Antarctic," in Antarctic Treaty Consultative Meeting, Kyiv, Ukraine, 2008.
[15] United States Coast Guard, "Arctic Search and Rescue," Department of Homeland Security, 2018.
[16] M. Olagnon and IFREMER, "Sar-Drift: Drifting at sea, whence and where to?," [Online]. Available: http://www.ifremer.fr/web-com/molagnon/divers/sardrift07.pdf. [Accessed 15 November 2019].
Appendix A
Appendix B
Figure 11: Antarctic Search and Rescue Regions [14]
Appendix C
Figure 135. Wind speed and subsequent drift speed [16].
![Table 1. Results from Kennedy et al., 2013 [5], giving estimated exposure time in hours](https://thumb-eu.123doks.com/thumbv2/123doknet/13999639.455833/9.918.110.835.577.725/table-results-from-kennedy-giving-estimated-exposure-hours.webp)
![Figure 2: Factors, as ranked by Canadian SAR experts, affecting exposure time. [5]](https://thumb-eu.123doks.com/thumbv2/123doknet/13999639.455833/10.918.124.793.653.1032/figure-factors-ranked-canadian-sar-experts-affecting-exposure.webp)