Publisher’s version / Version de l'éditeur:
PROTEOMICS - Clinical Applications, 3, 1, pp. 95-105, 2009-01
READ THESE TERMS AND CONDITIONS CAREFULLY BEFORE USING THIS WEBSITE. https://nrc-publications.canada.ca/eng/copyright
Vous avez des questions? Nous pouvons vous aider. Pour communiquer directement avec un auteur, consultez la première page de la revue dans laquelle son article a été publié afin de trouver ses coordonnées. Si vous n’arrivez pas à les repérer, communiquez avec nous à PublicationsArchive-ArchivesPublications@nrc-cnrc.gc.ca.
Questions? Contact the NRC Publications Archive team at
PublicationsArchive-ArchivesPublications@nrc-cnrc.gc.ca. If you wish to email the authors directly, please see the first page of the publication for their contact information.
NRC Publications Archive
Archives des publications du CNRC
This publication could be one of several versions: author’s original, accepted manuscript or the publisher’s version. / La version de cette publication peut être l’une des suivantes : la version prépublication de l’auteur, la version acceptée du manuscrit ou la version de l’éditeur.
For the publisher’s version, please access the DOI link below./ Pour consulter la version de l’éditeur, utilisez le lien DOI ci-dessous.
https://doi.org/10.1002/prca.200800019
Access and use of this website and the material on it are subject to the Terms and Conditions set forth at
A qualitative proteome investigation of the sediment portion of human
urine: implications in the biomarker discovery process
Mataija-Botelho, Diane; Murphy, Patrick; Pinto, Devanand M.; Maclellan,
Dawn L.; Langlois, Chantale; Doucette, Alan A.
https://publications-cnrc.canada.ca/fra/droits
L’accès à ce site Web et l’utilisation de son contenu sont assujettis aux conditions présentées dans le site LISEZ CES CONDITIONS ATTENTIVEMENT AVANT D’UTILISER CE SITE WEB.
NRC Publications Record / Notice d'Archives des publications de CNRC:
https://nrc-publications.canada.ca/eng/view/object/?id=bf0b7b8d-10bd-4e25-a078-2e367746c0e3
https://publications-cnrc.canada.ca/fra/voir/objet/?id=bf0b7b8d-10bd-4e25-a078-2e367746c0e3
R
ESEARCHA
RTICLEA qualitative proteome investigation of the sediment
portion of human urine: Implications in the biomarker
discovery process
Diane Mataija-Botelho
1, Patrick Murphy
2, Devanand M. Pinto
2,
Dawn L. MacLellan
3, Chantale Langlois
3and Alan A. Doucette
11Department of Chemistry, Dalhousie University, Halifax, NS, Canada
2National Research Council, Institute for Marine Biosciences, Halifax, NS, Canada 3Department of Urology, Division of Surgery, IWK Health Centre, Halifax, NS, Canada
Inherent to the biomarker discovery process is a comparative analysis of physiological states. It is therefore critical that the proteome detection protocol does not bias the analysis. With urine, the sediment portion, obtained upon thawing frozen urine, is routinely discarded prior to proteome analysis. However, our results demonstrate that such a practice inadvertently induces bias, hav-ing significant implications in the biomarker discovery process. We present the first proteome investigation of human urinary sediments, identifying 60 proteins in this phase by MS. Many sediment proteins were also detected in the urinary supernatant, indicating that several proteins partition between the two phases. This partitioning is dependant on the pH of the sample, as well as the degree of sample agitation. As a consequence of discarding the sediment portion of urine, the concentration of potential candidate biomarkers in the supernatant phase will be altered or, in other instances, may be completely removed from the sample. To minimize this, the pH of all samples should first be normalized, and the samples vigorously vortexed prior to discarding the sediments. For more comprehensive biomarker investigations, we suggest that urinary sedi-ments be analyzed along with the supernatant proteins.
Received: January 14, 2008 Revised: June 10, 2008 Accepted: June 24, 2008
Keywords:
Biomarker / Human urine / Mass spectrometry / Sediment analysis
1
Introduction
Among the human body fluids, urine has gained widespread popularity as a protein source for disease biomarker dis-covery [1]. Not only is sample collection noninvasive, but urine also contains an abundance of proteins; recent investi-gations suggest the presence of well over 1500 proteins in
urine [2]. Given the proximity to the kidneys, bladder, and urinary tract, urine is particularly suited as a source of can-didate biomarkers for genitourinary disorders, including inflammations [3], obstructions [4], and carcinomas of the bladder [5]. Moreover, as a product of blood filtration, urine provides an opportunity to survey proteins derived from essentially all organs of the body. Candidate protein bio-markers for lung cancer [6] as well as obstructive sleep apnea in children [7] have also been discovered through proteomic examinations of urine.
A variety of proteome detection protocols have been applied to urinalysis. Despite the analytical diversity, aspects of these protocols are universally accepted. For example, to preserve the proteome over extended periods, urine is frozen shortly after collection [8, 9]. Upon thawing, sediments from
Correspondence: Dr. Alan A. Doucette, Department of Chemistry,
Dalhousie University, 6274 Coburg Road, Halifax, Nova Scotia, Canada, B3H 4J3
E-mail: alan.doucette@dal.ca Fax: 11-902-494-1310
the sample are typically removed by filtration or centrifuga-tion, a necessary step in proteome visualization by gel elec-trophoresis [10]. This practice continues with modern gel and gel-free proteome analysis techniques, as it is assumed that the sediments may interfere with subsequent analysis.
Despite widespread acceptance, it was reported as early as 1986 that a thawed urine sample should be thoroughly vortexed but not centrifuged prior to SDS-PAGE, as this practice would lead to protein loss [11]. The identities of the so-called lost proteins were not discussed in this report. Furthermore, Zhou et al. [9] determined that the sediment phase of urine accounts for approximately 50% of the total protein content by mass and is primarily comprised of uro-modulin. Thus, as a simple prefractionation technique, removal of the sediment phase can be considered beneficial for the analysis of low-abundant protein components in urine supernatants [12]. However, Zhou et al. clearly demonstrated (through SDS-PAGE images) that several other proteins contribute to the sediment phase of urine; a comprehensive study to identify these proteins has yet to be conducted. Most recently, it has been shown that vortexing a urine sample aids in the solubilization of proteins from urinary exosomes [9]. Interestingly, although urinary sedi-ments are routinely analyzed through microscopy as a means of diagnosing physiological conditions [13], current proteome investigations focus only on the solubilized por-tion of the sample. Nonetheless, discarding the sediment phase undoubtedly removes other potentially important protein components from the sample.
It is also realized that any variation imposed by the ana-lytical procedure will result in a superfluous bias upon detection or quantitation of the proteome. A bias induced by a sample handling protocol may have significant implica-tions in the biomarker discovery process. For example, seemingly differentially expressed proteins may simply cor-relate to relative changes in protein solubility, induced by minor differences in the sample (e.g., pH, protein con-centration, extent of sample agitation). We believe a compre-hensive analysis of the urinary proteome, including urinary sediments, would lend the greatest probability of biomarker discovery and validation.
In this report we perform the first proteome analysis of human urinary sediments. We explore the effects of sample vortexing on the partitioning of proteins between the super-natant and sediments of urine. We also examine the effect of sample pH on the relative solubility of proteins in urine. The implications of our results toward the biomarker discovery process are discussed.
2
Materials and methods
2.1 Materials
Reagents for SDS-PAGE were purchased from BioRad (Mississauga, Canada). Solvents were of HPLC grade and
were obtained from Fisher (Ottawa, Canada). Protease inhibitor cocktail (cat. P2714-1BTL) was from Sigma (Oakville, Canada), along with trypsin, TPCK treated (cat. YSC2), and all other chemicals used in these experi-ments.
2.2 Urine collection
Urine samples were collected from healthy male and female donors with approval of the Dalhousie University Ethics Committee (ethics approval #2007-1520). Individ-uals were determined to be healthy from previous blood tests and had no indications of kidney abnormalities. Immediately following collection, protease inhibitors were added to the sample (10:1 v/v urine/cocktail) and frozen at 2207C.
2.3 Sample manipulations for qualitative analysis by MS
Four samples (50 mL/sample) from individual healthy donors (two male, two female) were thawed undisturbed at room temperature and centrifuged at 37166g to pellet the sediments. The supernatants were decanted and the sedi-ments washed with ,5 mL of ice-cold water. Each pellet was suspended in 0.5 mL of solubilizing buffer (50 mM DTT, 2 M thiourea, 8 M urea, 1% CHAPS). Of this, 50 mL was reserved for SDS-PAGE. The remaining ,450 mL from each of the sediment samples were pooled and brought to a total volume of 15.0 mL with solubilizing buffer, and subject to sIEF (Section 2.8).
The supernatant obtained from these samples were desalted and concentrated by SPE using a C18 cartridge (Varian, Palo Alto, CA). Briefly, ,50 mL of the supernatant was loaded on a SPE column, washed with 20% ACN/ water 1 0.1% formic acid, and eluted with 250 mL of 30% ACN, followed by 250 mL of 50% ACN, each in 0.1% formic acid/ water. All samples were then pooled, brought to a total volume of 8 mL with solubilizing buffer and subjected to sIEF (Section 2.8).
2.4 Effect of freezing on amount of sediment proteins Immediately upon collection, four 1 mL urine samples, obtained from four donors, were centrifuged (37166g, 6 min) to obtain the sediments present prior to freezing. The supernatant was removed and both the sediments and supernatants were frozen overnight at 2207C. Samples were thawed at room temperature and the sediments which accu-mulated in the solution fraction during the freeze–thaw cycle were again collected by centrifugation. Sediments obtained before and after freezing were individually solubilized in 60 mL of 16gel solubilization buffer (Section 2.7), heated for 5 min at 957C and 30 mL of each sample was subject to SDS-PAGE (Section 2.7).
2.5 Effect of vortexing on protein distribution between phases
Samples of urine, obtained from four donors (three male, one female), were thawed and aliquoted into 10 mL volumes, with gentle agitation to suspend the sediments between transfers. Samples were then either vortexed for 2 min at full power on a VWR mini vortexer (Equipland, Fremont, CA), or left undisturbed. The samples were then centrifuged at 37166g for 5 min, the supernatant decanted, and the pro-teins in this phase were acetone precipitated at 47C using a 3:1 ratio of acetone/ urine. All pellets (supernatant and sedi-ment) were then solubilized in 5 mL of PBS, and subjected to SDS-PAGE (Section 2.7).
2.6 Effect of pH on the partitioning of proteins between phases
Two urine samples (,50 mL/sample) from separate donors were thawed, vigorously vortexed for 5 min, pooled, and divided into ten equivalent 1 mL aliquots. Five of these ali-quots were used as controls (no pH adjustment) to assess the reproducibility of the visualization protocol. For the remain-ing five samples, the pH was adjusted over the range 0.5–8.0 through addition of 500 mL HCl or NaOH (prepared at dif-ferent concentrations). All samples were agitated on a vortex mixer, allowed to equilibrate for 15 min, and then cen-trifuged to pellet the insoluble material. The solution phase was carefully removed from the precipitate, and the proteins in these solutions were precipitated with cold acetone as described previously. Along with the original sediment frac-tion, the acetone-pelleted proteins were suspended in 10 mL of water and 20 mL of 56gel solubilization buffer (Section 2.7) for visualization by SDS-PAGE.
For quantitative analysis through iTRAQ, a urine sample obtained from a single donor was divided into 4650 mL portions immediately following collection. The pH was adjusted to 8.8 for one sample, pH 3.9 for another, and unaltered at pH 5.9 for the remaining two, through the addition of 2 mL of 1 M HCl, 1 M NaOH, or water, respec-tively. Samples were aliquoted into 10 mL fractions and fro-zen at 2207C. One fraction of each sample type was allowed to thaw at room temperature, and centrifuged at 37166g in order to collect the sediments. Sediments were suspended in 1 mL of 1 M urea with gentle heating at 307C to encourage solubilization. Proteins were digested with trypsin as de-scribed in Section 2.8. Digestion was stopped with 100 mL of 10% formic acid. Samples were then centrifuged to pellet any insoluble material, the soluble portion was evaporated to dryness, and subject to iTRAQ labeling, as described in Sec-tion 2.10.
2.7 Protein visualization by SDS-PAGE
If not already suspended in gel solubilization buffer, 40 mL of a processed urine protein sample was combined
with 10 mL of 56gel solubilization buffer (0.5 M Tris-HCl, pH 6.8, 10% w/v SDS, 0.5% w/v bromophenol blue, 26% glycerol). Following 5 min heating at 957C, 20 mL were loaded onto individual lanes of a 15% acrylamide gel, cast according to standard protocols [14]. The proteins were separated by electrophoresis and visualized with silver staining [15].
2.8 Solution IEF and protein digestion
Solution IEF was performed using a custom designed eight-chamber solution IEF device. Details on the appara-tus are provided elsewhere [16]. Prior to loading, 200 mL of carrier ampholytes (pI 3–10) were added per 4 mL of sam-ple. Four hundred microliters were loaded into each of the eight chambers, and the device was subject to 2 W constant power for 1.5 h to effect protein focusing. The eight resulting fractions were subject to protein precipitation with cold acetone (overnight, 47C). These fractions were then centrifuged at 37166g for 10 min to obtain the pro-tein pellets. Pellets were dissolved in 100 mL of water, adjusted to pH 8 with 1 M ammonium bicarbonate and digested with trypsin. Briefly, the proteins were reduced with 200 mM DTT, alkylated with 200 mM iodoacetamide, and digested at 377C overnight at an approximate 10:1 ratio of protein/ trypsin.
2.9 Qualitative LC-MS/MS and data analysis
Digested proteins were separated with a 1200 HPLC system (Agilent Technologies, Mississauga, Canada) using a Bio-basic-C18 column (Thermo Scientific, San Jose, CA). Sol-vent B consisted of 0.1% formic acid in ACN, while solSol-vent A was 0.1% formic acid in water. Following a 5 min initial hold at 2% B, the gradient consisted of a ramp from 2 to 40% B over 40 min, then to 80% B in 1 min. The injection volume was 1 mL with a constant flow rate of 2 mL/min. Nanospray MS was performed on an LTQ linear IT mass spectrometer (Thermo Scientific, San Jose, CA). Each frac-tion was analyzed twice (i.e., 261 mL injecfrac-tions with LC-MS/MS), the first run being performed with dynamic exclusion disabled, and in the second, with dynamic exclu-sion set to 1.5 min. Data were obtained in data-dependant mode (MS scan followed by MS/MS of top five ions). MS/ MS data were searched using the Bioworks Browser soft-ware package (Thermo Scientific) against human Uniprot database (14 804 entries). Criteria for positive protein iden-tification were as follows: for all peptides, DCn had to be at least 0.1 and Rsp had to be less than or equal to 4. For triply charged peptides, Xcorr had to be at least 3.75, doubly
charged at least 2.2, and singly charged at least 1.9. Peptides also had to have a peptide probability not greater than 0.05. Reversed database searches were performed on each of the runs using identical search criteria to obtain an assessment of false positive scores.
2.10 iTRAQ analysis of effect of pH on partitioning of proteins
The digested sediment proteins were first subject to RP col-umn cleanup on a Betasil C18 Dash HTS colcol-umn (2062.1 mm2, 5 mm particle size, Thermo Scientific). The
fractions containing peptides were pooled, evaporated, and subject to iTRAQ labeling according to the manufacturer’s instructions. Label 114 represented the acidified sample (pH 3.9), label 115 and 116 were the pH 5.9 samples, and 117 was the pH 8.8 sample. Following labeling, all samples were combined and again subject to RP cleanup as described above. Fractions were dissolved in 100 mL of strong cation exchange (SCX) mobile phase A (10 mM ammonium for-mate, 25% ACN, pH 3) and separated using a polysulfoethyl A 10062.1 mm2 column with 5 mm particle size (PolyLC,
Columbia, MD). The gradient was selected as follows: hold at 0% B for 5 min (600 mM ammonium formate, 25% ACN, pH 3), to 10% B at 20 min, 20% B at 30 min, 60% B at 40 min, hold to 45 min. The flow rate was 0.2 mL/min and fractions were collected in 2 min intervals from 0–45 min. SCX fractions 4–8 were selected for LC/MS/MS analysis, being the only fractions showing peaks in the UV chromato-gram.
The SCX fractions were dried down and resuspended in 30 mL 5% ACN/0.2% formic acid and subjected to RPLC-MS/ MS using a nanoAcquity UPLC system (Waters, Milford, MA) with a Q-TOF premier mass spectrometer (Waters) equipped with a nanospray source. The column used was a 1.7 mm BEH130 C18 75 mm6100 mm column (Waters, Mil-ford, MA). The injection volume was 6 mL and the gradient was as follows: 5% B (ACN/0.1% formic acid) to 40% B over 30 min followed by a ramp to 95% B over 2 min. Solvent A was water/0.1% formic acid. MS parameters were set to scan from m/z 450 to 1600 for the MS scan followed by MS/MS of the top three ions at a mass range of 100–1500. Data analysis was performed using the MASCOT search engine with Swiss-Prot-human database [17]. Peak lists were exported using ProteinLynx version 2.3 (Waters). Exported lists were then combined and searched using the MASCOT search engine. Search criteria was set using iTRAQ modifications for four labels, a peptide mass tolerance of 0.8 Da, fragment mass tolerance of 0.6 Da, and one missed cleavage. Quanti-tation of iTRAQ reporter ions was also performed using MASCOT. False positive rates were obtained by searching a reversed database using the exact same search criteria.
3
Results and discussion
3.1 Urinary sediments are variable and contain several proteins
With a high risk of proteolysis, urine is inevitably frozen upon collection to help preserve the sample. Although nec-essary, this manipulation step undesirably alters the native
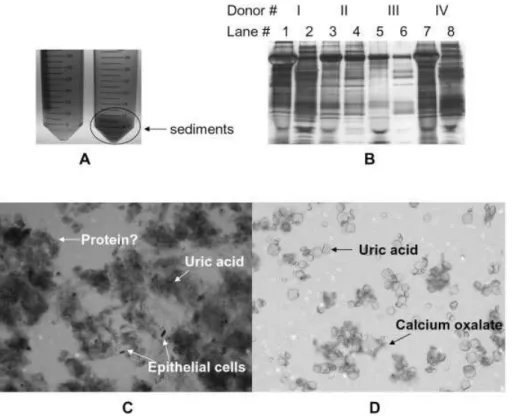
state of the sample. Indeed, Fig. 1A demonstrates that a simple freeze–thaw cycle significantly increases the content of the sediment portion of urine (up to 50-fold increase by mass, depending on the sample). The sediment portion of urine collected before freezing, along with those which result from a freeze–thaw cycle were subject to SDS-PAGE for protein visualization. It can be seen from Fig. 1B that many proteins are present in the sediment phase of urine prior to freezing the sample. Perhaps more significantly, however, is that additional proteins are observed in the sediment portion of urine following a freeze–thaw cycle, despite having removed the sediments obtained immediately following col-lection of the sample. Such proteins represent those which are not intrinsic to the sediment portion of urine, but are rather induced by the freeze–thaw cycle. Moreover, it can be seen from the gel image that the sediment proteins vary greatly according to the individual, both before and after a freeze–thaw cycle. As we demonstrate here, the sediment portion of urine contains a significant number of urinary proteins, which are easily detected following proper solubili-zation.
Urinary sediments correspond to the solid portion of urine that can be isolated from the urine supernatant via low-speed centrifugation or through filtration. The sediments comprise numerous species including epithelial cells, salt crystals, leukocytes, and protein casts primarily composed of Tamm–Horsfall protein (uromodulin) and serum albumin [9, 13]. Figure 1C displays a sample photomicrograph (256magnification, crystal violet stained) of the urinary sediments isolated from frozen urine via low-speed cen-trifugation. As expected, the photomicrograph provides evi-dence of sloughed epithelial cells, calcium oxalate crystals, uric acid crystals, mucus, and many other clumps, which are speculated to contain protein. Compared to the suspected protein in the precipitate, epithelial cells contribute very little to the total mass of proteins in the sediment phase. This observation is consistent with Fig. 1A, as well as the newly precipitated proteins observed in the gel image of Fig. 1B. Since much of the precipitated material was obtained as a result of a freeze–thaw cycle, we attempted to resolubilize the material, using PBS at a volume equal to the original volume of the urine sample. The majority of the sediments dissolved, and upon microscopic analysis of the sediment that remained, essentially only salt crystals were observed (Fig. 1D).
Urinary sediments from four individual donors were subject to SDS-PAGE to provide a qualitative look at the protein content present in these samples. The sediments obtained following a freeze–thaw cycle from ,50 mL of urine varied from as little as 3 mg to as much as 120 mg. Consistent with Fig. 1B, the gel image shown in Fig. 2 shows extremely variable protein profiles from the urinary sedi-ments of the four donors. Here, samples were normalized by volume, with the most concentrated protein lanes corre-sponding to the sample with a larger portion of sediments by mass. It is apparent that the differences in these gel lanes
Figure 1. (A) Photograph
show-ing human urine before beshow-ing frozen at 2207C (left tube) and after being frozen and thawed (right tube). (B) 1-D gel image shows sediment proteins from four donors (I-IV) before versus after a freeze–thaw cycle. Lanes 1, 3, 5, and 7 are sediments obtained before freezing, while lanes 2, 4, 6, and 8 are sediments exclusively induced from the freeze–thaw cycle. (C) Also shown is a photomicrograph at 256magnification of the sedi-ments isolated from human urine prior to solubilization and (D) after solubilization in PBS.
cannot be accounted for by simple variations in sample loading. Individual protein bands have significant variability in intensity, indicating that the sediment portion of urine, much like its soluble counterpart, varies according to the donor. We have also observed considerable variation in the protein content of urinary sediment obtained from the same individual donor, collected at different times (results not shown). Although the gel image of Fig. 2 provides only a qualitative view of the urinary sediments proteome, it firmly establishes that the sediment portion of urine is highly vari-able. This suggests that discarding it will bias the urinary proteome prior to analysis.
3.2 Analysis of the sediment proteome has implications for biomarker discovery
MS analysis was conducted on urinary proteins recovered from the sediment and supernatant of a urine sample, pooled from four donors. Table 1 provides a comprehensive listing of all proteins identified in the sediment portion of the pooled urine sample. Further details on the number of pep-tides identified and associated probability scores are provided as Table S1 of Supporting Information. A similar MS inves-tigation was conducted using the supernatant portion of urine (sediments discarded), and the complete results are also provided as Table S2 of Supporting Information and summarized in Fig. 3. Briefly, 60 individual proteins were identified from urine sediments, of which 44 of these were common to the supernatant. As a point of reference, we
Figure 2. 1-D gel image showing sediment proteins isolated from
a constant volume of urine from four healthy donors (I–IV).
identified 160 proteins from the urinary supernatant. Reversed database searches revealed a false positive rate of 5% for peptides of the sediments and 9% for peptides of the supernatant.
The fact that a large percentage of sediment proteins (73%) were also observed in the supernatant phase is not surprising. As we have shown, the freeze-thaw cycle causes
Table 1. Proteins identified by LC-MS/MS from the sediment phase of a pooled urine sample, with references indicating potential
bio-marker significance of the proteins Access.
no.
Protein name Num. peptide
Unique to sediment?
Tissue specificity
Biomarker significance Refs.
P02763 a-1 Acid glycoprotein precursor 3 No – Metastatic melanoma, Hodgkin’s disease [18, 19] P02768 Serum albumin 9 No – Hodgkin’s disease, idiopathic normal
pressure hydrocephalus
[19, 27] P04264 Keratin type 2 cytoskeletal 31 No – – – P01042 Kinninogen 4 No – Hodgkin’s disease [19, 22] P13645 Keratin type 1 cytoskeletal 14 No – – – P35908 Keratin type 2 cytoskeletal 13 No – – – P10451 Oteopontin 1 No – Focal segmental glomerulosclerosis,
inflammatory liver disease, mesothelioma
[28–30] P19652 a-1-Acid glycoprotein 2 No – Neuroblastoma, spontaneous preterm birth [31, 32] P41222 Prostaglandin-H2-Disomerase 4 No – Proliferative diabetic retinopathy [20]
P04259 Keratin type 2 cytoskeletal 5 Yes Epithelia – – P07911 Uromodulin 25 No – Fanconi syndrome [33] P02533 Keratin type 1 cytoskeletal 4 no – – – P02533 Keratin type 1 cytoskeletal 1 No – – – P13647 Keratin type 2 cytoskeletal 6 No – – – P02760 a-1 -Microglobulin 3 No – Hodgkin’s, diabetic nephropathy, IgA
nephropathy, ossification of posterior longitudinal ligament, renal damage, urinary tract infections, idiopathic normal pressure hydrocephalus
[19, 27, 34–38]
P13646 Keratin type 1 cytoskeletal 13 5 No – – –
P28799 Granulins 1 No – – –
P08779 Keratin type 1 cytoskeletal 7 Yes Squamous epithelia
– –
P01857 Immunoglobulin g 1 chain 1 No – – – O75594 Peptidoglycan recognition protein 1 No – – – P05109 Protein S100-A8 1 Yes Urinary stone
protein
– –
P13987 CD59 glycoprotein 1 No – – – P05090 Apolipoprotein D 1 No – Idiopathic normal pressure hydrocephalus [27] P01834 Immunoglobulin k chain 1 No – – –
P06870 Kallikrein-1 1 No – – –
P07477 Trypsin-1 -precursor 2 No – – – P62380 TATA box binding protein 1 Yes Ubiquitous – – Q14624 Inter-a trypsin inhibitor 1 No – Hodgkin’s disease, pancreatic cancer [19, 39] P01842 Immunoglobulin l chain 1 No – Autoimmune disease [40]
Q9GZM5 Protein YIPF3 1 No – – –
Q9UI46 Dynein intermediate chain 1 1 Yes Testis/sperm – – Q9BZK7 F box like/WD repeat containing protein 1 Yes Ubiquitous – – O15297 Protein phosphatase 1-D 1 Yes Skin – – P11137 Microtubule associated protein 1 Yes Epithelium – – Q53H12 Acylglycerol kinase 1 No – Prostate cancer [41] P51512 Matrix metalloproteinase 1 No – Type 1 diabetes [42] Q5XUX0 F-box only protein 1 Yes Testis – – P01833 Polymeric immunoglobulin receptor 1 No – – – P25311 Zinc-a-2 glycoprotein 4 No – Liver fibrosis, bladder cancer, prostate
cancer
[21, 23, 43] Q14508 WAP four disulfide core domain protein 2 No – – – P10153 Nonsecretory ribonuclease 1 No – – – Q7Z5L0 Vitellin membrane outer layer protein 1 No – – – O43653 Prostate stem cell antigen 1 No – Urogenital cancer [44] Q8WZ75 Roundabout homolog 1 No – – –
P55290 Cadherin 13 2 No – – –
Table 1. Continued
Access. no.
Protein name Num. peptide
Unique to sediment?
Tissue specificity
Biomarker significance Refs.
P02765 a-2-HS-glycoprotein 1 No – Proliferative diabetic retinopathy [20] Q8IWU5 Extracellular sulfatase 2 No – – – P16070 CD44 antigen 2 No – Gynecologic malignancies [45] P07602 Proactivator polypeptide 1 No – – – P05451 Lithostathine 1-a 1 No – Transposed intestinal segments [46] O95998 Interleukin-18 binding protein 2 Yes Leukocyte HIV-1 [47] Q6ISS4 Leukocyte-associated immunoglobulin 1 Yes Leukocyte
associated
– –
Q96GW7 Brevican core protein 1 Yes Brain – – P61221 ATP binding cassette sub familiy 1 Yes Duodenem/
uterus
– –
Q14184 Double C2-like domain containing protein 1 Yes High levels in kidney
– –
Q8IWG1 WD repeat containing protein 1 Yes Testis/brain – – P67809 Nuclease sensitive element binding
protein
1 Yes High levels in kidney
– –
Q9BZJ0 Crooked neck-like protein 1 No – – – P35527 Keratin type 1 cytoskeletal 10 No – – –
Figure 3. A Venn diagram summarizing the MS results of
pro-teins identified in the supernatant and sediments of a pooled sample from four healthy donors. The diagram also illustrates the proteins that were common to both phases of the sample.
proteins to partition between the solution and sediment phases. Some proteins undoubtedly precipitate to a larger extent than others. The proteins which were exclusively observed in the sediment portion of the sample do not pro-vide direct epro-vidence that they completely partitioned to this phase, but may be taken as an indication that their relative concentration is perhaps highest in this phase. This illus-trates the importance of analyzing both portions of the sam-ple for a more comprehensive investigation of the urinary proteome as well as for reliable biomarker discovery and validation.
Upon closer examination of the unique sediment proteins (Table 1), it can be seen that several of these originate from squamous epithelia, leukocytes, or aggregate on urinary stones. This is consistent with the type of proteins one would
expect to find in the sediments. In addition, the larger portion of keratins in the sediment phase is consistent with sloughed tissues. Given the type of proteins found in this sample, sedi-ment proteins should be considered part of the urinary pro-teome. These proteins may prove important for the survey of various disorders involving the entire body, or in particular, the urinary tract, which could ultimately be used as an addi-tional source of candidate protein biomarkers.
Many of the proteins identified in the sediments have been reported in the literature as potential biomarkers for various physiological disorders. For example, 1-acid glycoprotein, a-1-microglobulin, prostaglandin-H2-D-isomerase, inter-a
tryp-sin inhibitor, kinninogen and zinc-a-2-glycoprotein were all identified in the sediments, and have been reported in the lit-erature as biomarkers for various diseases [18–23]. These dis-eases range from liver fibrosis, bladder cancer, prostate cancer, and Hodgkin’s disease to urinary tract infections and more. A detailed list of the potential biomarker capabilities of the sedi-ment proteins identified is listed in Table 1.
Urinary sediments contain potential biomarkers and, therefore, should be combined with the supernatant or ana-lyzed in parallel with the supernatant. This is particularly important when doing comparative biomarker studies since one sample may have a larger portion of sediments than another, resulting in apparent differences in protein con-centration that result from variations in the degree of pre-cipitation induced by a freeze–thaw cycle rather than a pathogenic process. It is realized however, that the con-sequence of discarding the sediments may vary depending on the analytical protocol. For example, using the ligand library bead method, as described by Castagna et al. [24], less
emphasis is placed on protein concentration, and thus dis-carding the sediments may not significantly alter the result-ing protein profile. However, discardresult-ing the sediments while using this method may still impose consequences with respect to unique sediment proteins since these would ulti-mately be discarded.
3.3 Vortexing a urine sample prior to analysis resolubilizes some sediment proteins
In some instances of the proteome sample workup, it may be impractical to analyze the urinary sediments. In such a case, it is critical to minimize any sample bias induced by dis-carding the sediment portion of urine. Figure 4 displays a silver stained 1-D gel image of proteins from the urine of four different healthy donors (denoted as I-IV) isolated from the (A) sediment and (B) supernatant phases when the sam-ple was either vortexed or not vortexed prior to separation of the two phases. As would be expected, the vortexed samples from each donor show a decrease in protein intensity from the sediment portion and a corresponding increase in inten-sity from the supernatant. This implies that some of the sediment proteins were solubilized upon vortexing. The extent of sample agitation imposed as urine is initially pro-cessed upon thawing is difficult to control. Here we see that simple agitation of the sample is sufficient to redissolve a portion of the precipitate. It is therefore recommended that as part of all proteome analysis protocols, the urine samples be vigorously vortexed for at least 2 min prior to separating the sediment portion of the sample. This simple step affords a greater opportunity of minimizing protein loss due to dis-carding the sediments.
3.4 The pH of a sample influences the protein profile of urinary sediments
The relative solubility of urinary proteins is dependant on several variables, such as protein concentration, salt content, temperature, and solution pH [25] and these conditions vary from one physiological state to the next. The pH in particular
could have a drastic effect on the partitioning of proteins in urine, since protein solubility is greatly reduced as sample pH approaches the pI of the protein. It has been shown that the pH of urine in a healthy individual varies over time from 4.4 to 8 [26], and this variability increases when considering an unhealthy individual.
Upon examining the partitioning of urinary proteins be-tween supernatant and sediment phases by 1-DE, (Fig. 5), it is clear that changing the pH of the solution will greatly affect the solubility of certain proteins in the sample. The control lanes (A) serve as illustration that our sample analy-sis protocol is highly reproducible when considering iden-tical samples of both the soluble and precipitated portions. However, clear differences are observed in the gels as the pH of the urine is adjusted from its original value of 6.5 (B). The distribution of certain proteins between the sediment and supernatant of urine is significantly altered. Again, since the sediment portion is typically discarded during sample prep-aration, it is critical that such a practice results in discarding an equivalent portion of the proteome from all samples being compared. Thus, when sampling only a portion of the urine (i.e., the supernatant) it is critical that all variables which may influence the partitioning of proteins to the sedi-ment is controlled, including sample pH and degree of agi-tation.
In addition to the qualitative visualization of the effect of pH, iTRAQ labeling was conducted in order to quantify some of the differences in protein distribution which result from altering the pH of the sample. These results are sum-marized in Table 2. Reversed searches revealed a false posi-tive identification rate of 4% and additional information for the peptides identified from each protein can be seen in Table S3 of Supporting Information. As expected, differences in protein concentrations in the sediments were observed at different pH values. As would be predicted, the proteins detected in the samples at identical pH values (5.9) all had ratios close to 1. This was not the case for the samples whose pH was modified. In particular, the acidic sample revealed that clusterin precursor protein was downregulated by a fac-tor of almost three compared to the control, while
kallekrein-Figure 4. 1-D gels of (A)
sedi-ment and (B) supernatant pro-teins from four healthy donors (I–IV), isolated when the sam-ples were not vortexed or were vortexed.
Figure 5. Supernatant (left) and sediment
pro-teins (right) from a pooled sample in which the pH has been adjusted to the values indicated (B). Controls (A), having no pH adjustment, show excellent reproducibility thus differences in gel lanes represent changes induced by manipula-tion of pH.
Table 2. Proteins from the sediment phase of a urine sample, adjusted to different pH values, and quantified by
MS/MS with iTRAQ labeling
Expression ratio of sediment proteins from urine
Protein name Control 2/control 1 Acid/control 1 Base/control 1 Prostaglandin H2-Disomerase precursor 0.73 0.71 0.68
a-1-Microglobulin 0.92 0.60 0.87 Serum albumin precursor 0.96 0.88 0.65 Deoxyribonuclease-1-precursor 0.96 0.58 0.58 Clusterin precursor 1.03 0.27 1.40 Pro-epidermal growth factor precursor 1.03 0.85 1.11 Kallekrein-1-precursor 1.31 6.29 1.16
Uromodulin 1.34 1.37 1.19
Control 1: pH 5.9; Control 2: pH 5.9; Acid: pH 3.9; Base: pH 8.8.
1-precursor protein was upregulated by over a factor of six compared to the control. These variations in protein con-centration are observed despite the fact that they originate from a single urine sample. It is noted that the pH ranges employed are within normal biological variation for urine sample; the pH of urine from an unhealthy donor may have even larger variation. These results are consistent with the gel image in Fig. 5 and serve to demonstrate that a change in sample pH can have a significant influence on the parti-tioning of proteins between sediments and the soluble por-tion of urine. It is thus critical in a biomarker discovery assay to ensure that all variations between samples be minimized.
4
Concluding remarks
Human urinary sediments contain a significant number of proteins whose relative distribution between sediment and supernatant is highly variable from sample to sample, and is influenced within a sample by the degree of agitation (vor-texing/nonvortexing), and pH. No attempts were made to profile and compare proteomes extracted from different individuals, as it is not the objective of this work to explore this variability. Here, we establish that the sediment portion of urine is rich in protein, and discuss its implications. It is likely that other variables (concentration, salt content, tem-perature) will also change the relative distribution of
pro-teins, and further work is presently being conducted to quantify these effects and will be reported in the near future. From the present work, it is clear that variations in a sample, as well as minor differences in the analytical protocol will affect the detection or quantification of proteins in urine. In order to achieve an unbiased analysis, urinary sediments should be analyzed along with the supernatant of the sam-ple. As an alternate strategy, where it is desired that the uri-nary sediments be discarded, we suggest that the sample pH is normalized and that urine be thoroughly vortexed prior to centrifugation or filtration, in order to resolubilize the largest portion of proteins possible from the sediment phase. This step will ensure that any sample bias introduced by discard-ing the sediment portion of urine is, at best, minimized.
Funding for this research was provided by the Natural Sciences and Engineering Research Council of Canada (NSERC), the Department of Chemistry and the Faculty of Science at Dalhousie University, and the Canada Foundation for Innovation.
The authors have declared no conflict of interest.
5
References
[1] Hu, S., Loo, J. A., Wong, D. T., Human body fluid proteome analysis. Proteomics 2006, 6, 6326–6353.
[2] Adachi, J., Kumar, C., Zhang, Y., Olsen, J. V., Mann, M., The human urinary proteome contains more than 1500 proteins, including a large proportion of membrane proteins. Genome
Biol. 2006, 7, R80.
[3] Pang, J. X., Ginanni, N., Dongre, A. R., Hefta, S. A. et al., Bio-marker discovery in urine by proteomics. J. Proteome Res. 2002, 1, 161–169.
[4] Furness, P., Maizels, M., Han, S., Cohn, R. et al., Elevated bladder urine concentration of transforming growth factor-beta 1 correlates with upper urinary tract obstruction in chil-dren. J. Urol. 1999, 162, 1033–1036.
[5] Rasmussen, H., Ørntoft, T., Wolf, H., Celis, J., Towards a comprehensive database of proteins from the urine of patients with bladder cancer. J. Urol. 1996, 155, 2113–2119. [6] Tantipaiboonwong, P., Sinchaikul, S., Supawadee, S.,
Phu-trakul, S. et al., Different techniques for urinary protein anal-ysis of normal and lung cancer patients. Proteomics 2005, 5, 1140–1149.
[7] Krishna, J., Shah, Z., Merchant, M., Klein, J. et al., Urinary protein expression patterns in children with sleep-disordered breathing: Preliminary findings. Sleep Med. 2006, 7, 221–227. [8] Traum, A. Z., Wells, M. P., Aivado, M., Libermann, T. A. et al., SELDI-TOF MS of quadruplicate urine and serum samples to evaluate changes related to storage conditions. Proteomics 2006, 6, 1676–1680.
[9] Zhou, H., Yuen, P. S. T., Pisitkun, T., Gonzales, P. A. et al., Col-lection, storage, preservation, and normalization of human urinary exosomes for biomarker discovery. Kidney Int. 2006,
69, 1471–1476.
[10] Anderson, N. G., Anderson, N. L., Tollaksen, S. L., Hahn, H. et
al., Analytical techniques for cell fractionation. XXV.
Con-centration and two dimensional gel electrophoretic analysis of human urinary proteins. Anal. Biochem. 1979, 95, 48–61. [11] Marshall, T., Williams, K. M., Electrophoresis indicates
pro-tein loss on centrifugation of urine. Clin. Chem. 1986, 32, 2105–2106.
[12] Pisitkun, T., Johnstone, R., Knepper, M. A., Discovery of uri-nary biomarkers. Mol. Cell. Proteomics 2006, 5, 1760–1771. [13] Fogazzi, G. B., Garigali, G., The clinical art and science of
urine microscopy. Curr. Opin. Nephrol. Hypertens. 2003, 12, 625–632.
[14] Laemmli, U. K., Cleavage of structural proteins during assembly of head of bacteriophage-T4. Nature 1970, 227, 680–685.
[15] Shevchenko, A., Wilm, M., Vorm, O., Mann, M., Mass spec-trometric sequencing of proteins from silver stained poly-acrylamide gels. Anal. Chem. 1996, 68, 850–858.
[16] Tran, J. C., Doucette, A. A., Rapid and effective focusing in a carrier ampholyte solution isoelectric focusing system: A proteome prefractionation tool. J. Proteome Res. 2008, 7, 1761–1766.
[17] Perkins, D., Pappin, D., Creasy, D., Cottrell, J., Probability-based protein identification by searching sequence data-bases using mass spectrometry data. Electrophoresis 1999,
20, 3551–3567.
[18] Matharoo-Ball, B., Ratcliffe, L., Lancashire, L., Ugurel, S. et
al., Diagnostic biomarkers differentiating metastatic
mela-noma patients from healthy controls identified by an inte-grated MALDI/TOF mass spectrometry/bioinformatic approach. Proteomics Clin. Appl. 2007, 1, 605–620. [19] Khositseth, S., Kanitsap, N., Warnnissorn, N.,
Thonboon-kerd, V., IgA nephropathy associated with Hodgkin’s disease in children: A case report literature review and urinary pro-teome analysis. Pediatr. Nephrol. 2007, 22, 541–546. [20] Kim, S. J., Kim, S., Park, J., Lee, H. K. et al., Differential
expression of vitreous proteins in proliferative diabetic reti-nopathy. Curr. Eye Res. 2006, 31, 231–240.
[21] Gangadharan, B., Antrobus, R., Dwek, R. A., Zitzmann, N., Novel serum biomarker candidates for liver fibrosis in hepatitis C patients. Clin. Chem. 2007, 53, 1792–1799. [22] Pieper, R., Gatlin, C. L., McGrath, A. M., Makusky, A. J. et al.,
Chracterization of the human urinary proteome: A method for high resolution display of urinary proteins on two-dimensional electrophoresis gels with a yield of nearly 1400 distinct spots. Proteomics 2004, 4, 1159–1174.
[23] Irmak, S., Tilki, D., Heukeshoven, J., Oliveiera-Ferrer, L. et al., Stage-dependant increase of orosomucoid and zinc-alpha-1-glycoprotein in urinary bladder cancer. Proteomics 2005,
5, 4296–4304.
[24] Castagna, A., Cecconi, D., Sennels, L., Rappsilber, J. et al., Exploring the hidden human urinary proteome via ligand library beads. J. Proteome Res. 2005, 4, 1917–1930. [25] Scopes, R. K., Protein Purification: Principles and Practice,
2nd Edn., Springer-Verlag, New York 1987, pp. 41–71. [26] Corriere, J. N., Essentials of Urology, Churchill Livingstone,
New York 1986, p. 33.
[27] Li, X., Miyajima, M., Mineki, R., Taka, H. et al., Analysis of potential biomarkers in cerebrospinal fluid of idiopathic
normal pressure hydrocephalus by proteomics. Acta
Neu-rochir. 2006, 148, 859–864.
[28] Shui, H., Ka, S., Yang, S., Lin, Y. et al., Osteopontin as an injury marker expressing in epithelial hyperplasia lesions helpful in prognosis of focal segmental glomerulosclerosis.
Transl. Res. 2007, 150, 216–222.
[29] Ramaiah, S. K., Rittling, S., Role of osteopontin in regulating hepatic inflammatory response and toxic liver injury. Expert
Opin. Drug Metab. Toxicol. 2007, 3, 519–526.
[30] Scherpereel, A., Lee, Y. C. G., Biomarkers for mesothelioma.
Curr. Opin. Pulm. Med. 2007, 13, 339–343.
[31] Sandoval, J., Turner, K., Hoelz, D., Rescorla, F. et al., Serum protein profiling to identify high risk neuroblastoma: Pre-clinical relevance of blood-based biomarkers. J. Surg. Res. 2007, 142, 268–274.
[32] Pereira, L., Reddy, A. P., Jacob, T., Thomas, A. et al., Identifi-cation of novel protein biomarkers of preterm birth in hu-man cervical-vaginal fluid. J. Proteome Res. 2007, 6, 1269– 1276.
[33] Vilasi, A., Cutillas, P. R., Maher, A. D., Zirah, S. F. M. et al., Combined proteomic and metabonomic studies in three genetic forms of the renal Fanconi syndrome. Am. J.
Phy-siol. Rena. PhiPhy-siol. 2007, 2, F456–F467.
[34] Cho, E. H., Kim, M. R., Kim, H. J., Lee, D. Y. et al., The dis-covery of biomarkers for type 2 diabetic nephropathy by serum proteome analysis. Proteomics Clin. Appl. 2007, 1, 352–361.
[35] Yokota, H., Hiramoto, M., Okada, H., Kanno,Y. et al., Absence of increased alpha-1-microglobulin in IgA nephropathy pro-teinuria. Mol. Cell. Proteomics 2007, 6, 738–744.
[36] Eun, J. P., Ma, T. Z., Lee, W. J., Kim, M. G. et al., Comparative analysis of serum proteomes to discover biomarkers for ossification of the posterior longitudinal ligament. Spine 2007, 32, 728–734.
[37] Bernard, A., Renal dysfunction induced by Cadmium: Bio-markers of critical effects. BioMetals 2004, 17, 519–523.
[38] Pizzini, C., Mussap, M., Mangiarotti, P., Plebani, M. et al., Urinary biomarkers in children with urinary tract infections with and without reflux on antibacterial prophylaxis with cefaclor. Clin. Drug Invest. 1999, 18, 461–466.
[39] Yu, K. H., Rustgi, A. K., Blair, I. A., Characterization of pro-teins in human pancreatic cancer serum using differential gel electrophoresis and tandem mass spectrometry. J.
Pro-teome Res. 2005, 4, 1742–1751.
[40] Gottenberg, J. E., Aucouturier, F., Goetz, J., Sordet, C. et al., Serum immunoglobulin free light chain assessment in rheumatoid arthritis and primary Sjogren’s syndrome. Ann.
Rheum. Dis. 2007, 66, 23–27.
[41] Spiegal, S., Milstein, S., Critical role of acylglycerol kinase in epidermal growth factor-induces mitogenesis of prostate cancer cells. Biochem. Soc. T. 2005, 33, 1362–1365. [42] Thrailkill, K. M., Bunn, R. C., Moreau, C. S., Cockrell, G. E. et
al., Matrix metalloproteinase-2 dysregulation in type 1
dia-betes. Diabetes Care 2007, 30, 2321–2326.
[43] Bondar, O. P., Barnidge, D. R., Klee, E. W., Davis, B. J. et al., LC-MS/MS quantification of Zn-alpha-2-glycoprotein a potential serum biomarker for prostate cancer. Clin. Chem. 2007, 53, 673–678.
[44] Said, J., Biomarker discovery in urogenital cancer.
Bio-markers 2005, 10, 83–86.
[45] Taylor, D. D., Gercel-Taylor, C., Gall, S. A., Expression and shedding of CD44 variant isoforms in patients with gyneco-logic malignancies. J. Soc. Gynecol. Investig. 1996, 3, 289– 294.
[46] Nabi, G., N’Dow, J., Hasan, T. S., Booth, I. R. et al., Proteomic analysis of urine in patients with intestinal segments trans-posed into the urinary tract. Proteomics 2005, 5, 1729–1733. [47] Song, W., Wilson, C. M., Allen, S., Wang, C. et al., Interleukin 18 and human immunodeficiency virus type 1 infection in adolescents and adults. Clin. Exp. Immunol. 2006, 144, 117– 124.