HAL Id: hal-01286331
https://hal.archives-ouvertes.fr/hal-01286331
Submitted on 10 Mar 2016
HAL is a multi-disciplinary open access
archive for the deposit and dissemination of sci-entific research documents, whether they are pub-lished or not. The documents may come from teaching and research institutions in France or abroad, or from public or private research centers.
L’archive ouverte pluridisciplinaire HAL, est destinée au dépôt et à la diffusion de documents scientifiques de niveau recherche, publiés ou non, émanant des établissements d’enseignement et de recherche français ou étrangers, des laboratoires publics ou privés.
development of demand response?
Vincent Rious, Yannick Perez, Fabien Roques
To cite this version:
Vincent Rious, Yannick Perez, Fabien Roques. Which electricity market design to encourage the development of demand response?. Economic Analysis and Policy, Elsevier, 2015, 48, pp.128-138. �10.1016/j.eap.2015.11.006�. �hal-01286331�
Which electricity market design to
encourage the development of
demand response?
Vincent Rious1, Yannick Perez2, Fabien Roques3
Abstract
Demand response is a cornerstone problem in electricity markets under climate change constraints. Most liberalized electricity markets have a poor track record at encouraging the deployment of smart meters and the development of demand response. In Europe, different models are considered for demand response, from a development under a regulated regime to a development under competitive perspectives. In this paper focusing on demand response and smart metering for mid-‐size and small consumers, we investigate which types of market signals should be sent to demand managers to see demand response emerge as a competitive activity. Using data from the French power system over nine years, we compare the possible market design options which would enable the development of demand response. Our simulations demonstrate that under the current market rules demand response is not a profitable activity in the French electricity industry. Introducing a capacity market could bring additional revenues to demand response providers and improve incentives to put in place demand response programs in a market environment.
Keywords: Market Design; Demand Response; Capacity Market.
The views expressed are those of the authors only. We thank Sébastien Douguet and the anonymous referees for their careful reading and valuable comments.
1: Vincent Rious, Microeconomix, 5 rue du Quatre Septembre, 75002 Paris, France. Email: vincent.rious@microeconomix.com, Tel. (+33)171183183, Fax. (+33)175578989 and engineering advisor at the “Loyola de Palacio” Chair, RSCAS at the European University Institute
2 Corresponding author : Tenured associate professor at University Paris-‐Sud, RITM. Associate Professor at CentraleSupélec, Part Time Professor at Helmholtz-‐Zentrum für Umweltforschung, Department of Economics. Email: yannick.perez@u-‐psud.fr.
3 Vice president Compass Lexicom. Email: fabien.roques@gmail.com.
1 Introduction
Physical equilibrium between generation and load in real-‐time has always been a key issue for the power system operator because this energy cannot be stored economically on a large scale. Without storage, equilibrium in real-‐time has been traditionally managed thanks to a flexible portfolio of different generation units. Meanwhile, demand response has been used by incumbents to balance their power system since quite a long time. For instance, there were 6 GW of demand response in France at the end of the 1990's while there were only 3.5 GW in 2007 (CRE, 2013). Demand response is becoming now more interesting with the development of smart grid technologies. With these new technologies, the potential capacity of demand response in France could reach 10 to 15 GW (E-‐cube, 2013). The market rules are hence evolving in different countries to ease the integration of demand response in the power market (e.g. in France – RTE, 2013 – in Belgium – CREG et al., 2014 – or in the USA – Hurley et al. 2013).
The main interest of demand response is that it participates in balancing the power system for some hundreds of hours a year in the same way peak generation does (Faruqui & Earle 2006; Faruqui & Sergici 2010; Faruqui -‐ Harris & Hledik 2010). Demand response has been capturing attention because most liberalised power systems with an ‘energy only’ market are characterised by a deficit of investment in peaking units, caused by a lack of revenue. This so-‐called “missing money” problem have now been widely studied (see Joskow (2007, 2008) Cramton and Stoft (2006) and Finon and Pignon (2008) for an in-‐depth survey). The solutions to address the peaking unit missing money issue include a range of market arrangements, such as the introduction of a strategic reserve of power plants owned (e.g. in Finland) or contracted by the system operator (e.g. in Belgium), capacity payments (in Italy or Argentina) or capacity markets (in different markets in the USA, in PJM, ISO-‐NE or NY-‐ISO). Different countries have tried different arrangements (see Finon and Pignon (2008); see also Stamtsis and Lynchnaras (2015) for a description of the national capacity remuneration mechanisms in the European Union) and Khalfallah (2011) proposed a model for generation capacity adequacy that allows comparison between investment incentive mechanisms in electricity markets.
But assuming that demand response can be a substitute for peak generation invites us to analyse the potential impact of the missing money problem on demand response solutions. To test the existence of this “missing money for demand response” hypothesis, we will try to evaluate this gap using empirical data from the French power market over nine years. By doing so we contribute to the debate on the challenges the smart grids and demand response investment programs will undergo in the future (Allcott 2011 ; Joskow 2012).
Our simulations show that the ‘missing money’ issue in current power markets is very likely to affect demand response aggregators and to make the recovery of the upfront investment in smart metering infrastructures difficult to recoup through market revenues without additional capacity remuneration. We will then wonder which market design could foster the development of demand response toward small (domestic and tertiary) consumers, that is to say which types of market signals should be send to demand managers to see demand response emerge as a competitive activity solving the missing money issue. In Europe, demand response is considered as a new vector to foster competition and liquidity. To the contrary, because of the subsidiarity of Member States with regard to their energy policy, the diversity of policies supporting Renewable Energy Sources for Electricity (Finon and Perez, 2007; Henriot, 2015, Saguan and Douguet, 2013) as well as the diversity of capacity remuneration mechanisms (ACER4, 2013; Glachant and Henriot, 2014; Veyrenc, 2014) and
the integration of interconnection capacity in those mechanisms are seen as obstacles to the integration of the European electricity market and the development of competition (European Commission, 2015a & b).
The paper is structured as follows: we first specify the economics and technical characteristics that distinguish demand response from peak generation. Then, we highlight the problem of compensation that a demand response program would experience on a power market. At last, we study the matching between the incentive mechanisms implemented to ensure sufficient peak generation investment and the specificities of demand response. We conclude about the ability of pure liberalized market solution to provide sufficient incentives for the development of demand response.
2 The parallel between a demand response program and a peak generator
A demand response program and a peak generator face a number of similar issues, including the “missing money” problem observed in most liberalized power markets. But there are also several significant differences to be highlighted. In this section, we demonstrate that both similarities and differences in issues met should be taken into account when evaluating the impact of the missing money issue on the profitability of a demand response program.
2.1 Similarities between a demand response program and a peak generator
In order to determine when one can substitute for the other, we review the different services provided by a peak generator and discuss the extent to which a demand response program can be
used as an alternative.
First, a peak generator is scheduled day-‐ahead to supply energy during the peak demand hours only. Indeed, a peak generator has the highest marginal cost and is the last type of generation units to be planned and started up to supply energy. The fact that a peaking generator is dispatched after all other units to meet the residual demand makes its revenues very hard to predict and very uncertain. An investment in a peak generator is thus very risky because it depends on the level of power demand that, itself, depends on extreme weather conditions. For a power system that experiences high levels of demand during the heating season, a very cold year means that the peak generators run for a large number of hours. Conversely, a warm year means that they may not run at all, being then unable to pay back the annuity of their investment during the year5.
A peak generator is also very useful to balance the power system in real time (providing ancillary services) or close to real time (providing power on the balancing market). These second and third uses of a peak generator are related to its characteristics of high flexibility and short start-‐up time. This feature is very valuable in real time to balance generation and load in an industry where storage is not possible. Indeed, the time to react to an imbalance in real time is short, from seconds to a maximum of 15 minutes6. A peak generator is adapted to contribute to the power balance within this
time period because it is very flexible once started-‐up, and it is able to be started up quickly. Indeed, peak generators or hydro generators with dams are the main generators to be used to act in such a short delay7.
A demand response program can replace a peak generator only for two of the uses listed above, on a daily basis and for adjustments. A load curtailment can be planned day-‐ahead when load is high to help and balance supply and demand. A load curtailment can be activated in real time to compensate imbalances.
2.2 Differences between a demand response program and a peak generator
A demand response program and a peak generator are not pure substitutes for four reasons. First, a load curtailment can only happen if demand was planned and if the curtailment itself was anticipated with sufficient notice. For the moment, to avoid any disturbance for the consumers,
5 The same reasoning applies in a similar manner for power systems that experience high levels of demand during the warm season like in the USA due to an intensive use of air conditioning.
6 The automatic ancillary services must react in seconds or minutes during fifteen to twenty minutes after the disturbance. After more than fifteen minutes of imbalances, the capacity of ancillary services must be restored so that the power system can support any new imbalances. This requires that a generator be started up (or that a demand response operator curtail load) in less than 15 minutes.
7 The provision of ancillary services is generally risk-‐free because a part of the remuneration is associated to the availability of capacity. However, the activity of adjustment in real time implying starts-‐up is risky for a peak generator because its use depends on uncertain imbalances.
curtailment in the residential sector mainly concerns energy uses with inertia such as the production of cold or heat. However, these energy uses with inertia are only active when demand is high8.
The second difference is the Cold Load Pick-‐Up (CLPU) effect. The CLPU is the additional energy and power temporarily needed to compensate the previous curtailment. The two main parameters of the CLPU effect are its size and its duration. These characteristics are essential to the profitability of a demand response operator. If the level of the CLPU effect is smaller than 100%, any demand curtailment saves energy and is also likely to induce money savings9. The smaller the CLPU effect is,
the higher the money savings are. Figure 1 illustrates a CLPU effect of 100% (which means the curtailment does not modify, neither increasing nor decreasing, the energy consumption) and lasting twice the time of the curtailment.10
Figure 1 Illustration of the CLPU effect appearing after a load curtailment
-1,5 -1 -0,5 0 0,5 1 1,5 2 1 2 3 4 5 6 7 8 9 10 11 Time units Pow er
Planned load Curtailment CLPU effect (50% - same duration as the curtailment) Realised load
The third specificity of a demand response program is that it is an intermediated tool of management and not a direct decision taken by a company 11. This characteristic makes the business
model complex for the deployment of demand response (Albadi & El-‐Saadany, 2008; EUDEEP business model 1). In most demand response programs, the demand response operator does not directly curtail its customers but only sends them a price signal telling them that they should curtail. The customers then have to react to price signals within the limits of their other constraints. Thus, it
8 Load is high in warm weather for power systems with many air conditioners or in cold weather for power systems with many electric heaters.
9 Conversely, any CLPU effect above 100% means that any demand curtailment induces a global increase in energy consumption and higher energy expenses.
10 See Agneholm (1999) for a quite broad characterization of the CLPU effect.
11 Demand response does not necessarily required intermediation. It can be directly proposed to the market by big consumers.
is difficult for a demand manager to predict and commit to a response rate among its customers and therefore the actual capacity of its demand response program.
Some operators then choose to sell controlled demand response programs. The operator takes care of the direct curtailment of its customers in such a way that they do not feel any disturbance12.
However, this solution has two drawbacks. First, the operating costs of the demand manager are much higher than in the previous solution, because of the establishment and operation of a demand-‐ side management dispatching, which will manage the curtailment of all customers. Then, even with a controlled demand response program, the consumer always has the right to overrule the order of curtailment and to continue to consume electricity. The rate of response from consumers to a curtailment order will never be 100%, and it may vary on a wide range. It was measured between 9% and 53% in the North East of the USA in 2009 (Cappers, Goldman, & Kathan, 2009). Demand response aggregators can nevertheless limit these problems playing with the big number effect of their portfolio of consumers that they can curtail in order to make their (curtailing) capacity more reliable. Nevertheless, it increases their fixed costs because they must then increase their customer base. Recent measures present more interesting performances between 65% and 130% (Hurley et al., 2013).
Last, there is also the issue of the entry and exit of customers, as a demand response program is a commercial activity that caters to residential or tertiary customers. Therefore, the demand response capacity of an operator may vary over time depending on the dynamics of its customer base.
Considering the intermediated nature of demand response for small and medium size consumers, it may be difficult for such a demand response program to provide ancillary services when needed. The provision of secondary reserves implies that the respondent receives a signal displayed by the TSO itself over a dedicated telecommunication infrastructure. If demand response provided secondary reserves, this would impose that this dedicated infrastructure be extended toward the curtailed consumers. Nevertheless, experiments are carried out so that demand response can produce ancillary services (e.g. MacDonald et al., 2012; RTE, 2014a). The ability of demand response to produce ancillary services depends on the nature of curtailed load and could focus on some industrial processes and mainly commercial activities (Ma et al., 2013).
12 In order to do so, demand response aggregators implement so called cascading and cyclical demand curtailment. In other words, different electrical devices are curtailed in a cyclical manner on the consumer site in order to limit the impact on its comfort. And these devices are stopped one after another ("cascading") only if it is needed to curtail a big amount of power (ADEME, 2002).
2.3 A “missing money” issue?
At the time of renewal or extension of peak generation units, several liberalized power markets have experienced low level of investment. This is due to the insufficient revenue these investors are receiving from the energy-‐only market and the risk they perceive from the market prices, since they are paid for only several hundreds of hours in a year and with great variations from a year to another (Joskow, 2008). Several hours per year, the market is so tight that the spot price soars and blithely exceeds several thousand euros/MWh (Joskow, 2008). This scarcity rent is very important for the peak generators because it allows them to cover their investment costs during their few hours of operation. In the extreme case where demand is greater than generation, prices even reach a threshold at which some consumers prefer to disappear spontaneously rather than to pay for the asked price. This threshold is generally noted “VoLL” for Value of Lost Load.
Many regulators however see this very high price as a market failure or as a politically unbearable price situation. To solve this problem, some regulators set a price cap that the market price can never exceed, as shown on figure 2. This price cap then limits the income generated by the peak generator and reduces the incentive to invest in such peaking units. Other things being equal, the price cap will have the same effect for the remuneration of a demand response operator that is only remunerated through the energy-‐only market.
Figure 2 Missing money emerging from price cap (Hogan, 2007)
All these considerations lead to the identification of a lack of revenue, the so called “missing money” for any facility (peak generator or demand response) acting during the peak hours. A classical solution to fill the gap is to pay them for their availability and not only for the energy production or curtailment. A peak generator would then be paid for its availability during the peak hours and for its production when dispatched. And a demand response program would then be paid for its availability during the peak hours and for the effective undergone curtailment. According to
the solutions chosen in the national market designs, peak generators had more or less difficulties to recover their investment costs.
However, given the four characteristics of a demand response program (appearance only when demand is high, CLPU effect, control and dynamics of customer base), a market design adapted to the development of peak generation may not necessarily be adequate for the deployment of demand response.
3
The need to pay a demand response program for availability
The implementation costs of demand response for the big industrial consumers13 and the big
tertiary consumers14 are quite low and adapted to load management (5,000 to 10,000 €/MW for
investment15, 3,000 to 12,000 €/MW.year of operational expenditure and possibly activation costs16). In these situations, the existing information and communication assets allow easily to command load and the potential volume of demand response is high. Nevertheless, for the small tertiary and domestic consumers that stand for the biggest possibility for demand response17, it is needed to
develop a new and dedicated infrastructure18. The implementation of demand response programs
that can follow the hourly variations of the electricity market price then requires these old metering devices to be replaced and a demand control centre to be developed to aggregate the individual demand response capacities into a demand response volume big enough to be traded on the marketplace (Albadi & El-‐Saadany, 2008; Faruqui & Sergici, 2009).
This new infrastructure requires a large upfront investment with uncertainty on the costs and returns (Haney, Jamasb and Pollitt 2009). For instance in France, the “Linky” program to deploy smart meters is evaluated between 4 and 8 billion euros for the installation of 30 million new intelligent metering devices19. This new infrastructure being brand new, to our knowledge, no detailed
information is available to evaluate the extent of economies of scale and thus the competitive or regulatory nature of demand response program.
In this section we evaluate the potential missing money problem for Demand Response. First, we focus on the two main revenue sources for a peak generator, either the spot day-‐ahead market or
13 They generally stand for 30% of total consumption.
14 The main function of a Building Management System is to manage the environment within the building (cooling, heating, air distribution, lighting...) to obtain the desired temperature, carbon dioxide levels, humidity, brightness, etc.
15 Source : Marchand-‐Maillet (2012). 16 Source : E-‐Cube (2013).
17 They jointly stand for the remaining 70% of total consumption.
18 Smart metering devices can help the development of demand response but their first objective is to reduce the metering and losses costs of network operator.
19 To widen the range of possible cost, a French independent demand response aggregator pretends that its investment costs are 20 times smaller than the investment cost of a peaker.
the balancing market. Second, we evaluate the revenue that can be expected from these markets and we extract general conclusions using data from the French case.
3.1 Two markets to buy and sell electricity
Liberalised power markets actually consist in a sequence of closely connected markets with different time horizons, from forward markets years ahead to real-‐time markets. A producer can choose to sell its electricity mainly on two different markets: a market said "Spot" or day-‐ahead market, and a balancing market used to compensate for real-‐time imbalances between generation and load (Saguan et al., 2009).
In France, the spot day-‐ahead market is run by the Power Exchange “EPEXSpot”20. Each day at
11:00, a market player may submit voluntary offers on this exchange: for every hour day-‐ahead, it may offer a buy or sale bid21. Since 2013, it is also possible to value load curtailment in the energy
market, i.e. either on the organised EPEXSpot market or over-‐the-‐counter with other market actors and not exclusively in the supplier's portfolio whose load is curtailed (RTE, 2013). As for the balancing market, it is a tool for the Transmission System Operator (TSO) to ensure the balance of the power system in real time. Each player in this market bids upward or downward. In case of system imbalance, the TSO asks for the balancing market and selects some bids to balance back generation and load. The balancing market is also completed by the ancillary services (primary and secondary reserves) that allow rapid automatic balancing. The provision of ancillary services can be regulated or organised as a market. The remuneration that generators receive from the provision of ancillary services is quite small compared to the remuneration provided by the day-‐ahead and real time markets.
For instance, in France, the average yearly cost of ancillary services is less than 1 €/MWh (with an annual cost around 300 million € to serve around 450 million MWh) compared to the average peak spot price of electricity close to 60€/MWh on EPEXSpot22 (CRE, 2010).
These day-‐ahead and real-‐time markets are in France and in most of the European countries the main sources of remuneration for different electricity generators, after the bilateral market. A generator with a winning bid on the Spot Market is paid the spot price. A generator with a winning bid on the balancing market is generally paid its bid price. Let us now see the distinct impact of these two systems of remuneration on a demand response program.23
20 Previously called PowerNext until 2009.
21 Intraday trade is also possible on EPEXSpot, but these exchanges represent a much smaller volume than
in day-‐ahead.
22 Source: CRE, 2010. Observatoire du marché de gros de l’électricité. 1er trimester 2010.
3.2 The need to remunerate a demand response program for its availability
Considering the similarities and differences between a demand response program and a peak generator, the objective of this section is to evaluate whether a demand response program would be profitable in an “energy-‐only” market context applying previous analyses of this problem for peak generators to the case of a demand response program.
3.2.1 Cost estimations
In order to tackle our problem, we consider two polar scenarios for the estimation of the different costs: the optimistic scenario is built using the most positive data set and the pessimistic scenario is conversely calculated taking into account the less enthusiastic assessments.
We use the following set of information to estimate the cost of demand response on the smaller consumers. E-‐cube (2013) indicates the different types and values of costs for demand response aggregators. The cost of installing a box to command load curtailment is estimated at 450 € per customer depreciated over eight years. There is also a fixed cost of 50 € per year and customer to cover the costs of telecommunication of the box and the customer management. Besides, it is estimated that 2 to 4 kW per customer can be curtailment depending its characteristics. The Weighted Average Cost of Capital (WACC) is estimated between 10% and 15%.
The optimistic scenario is hence obtained considering the lowest expected WACC (10%) and the biggest amount of curtailment (4 kW). To the contrary, the pessimistic scenario is obtained considering the highest expected WACC (1%) and the smallest amount of curtailment (2 kW). Table 1 summarises the assumptions and the results of our calculation.
Table 1 Assumptions of the optimistic and pessimistic scenarios for the calculation of the investment cost of a demand response program
Scénario Annual cost for telecommunication and customer management Total annualized cost per customer (€) Demand response capacity per customer (kW) Total annualized cost (€/kW) Optimistic 50 134 4 34 Pessimistic 150 2 75
Formula [E] [F]=[D]+[E] [G] [H]=[F]/[G]
We then compare these costs with the benefit that demand response could generate at maximum from the market. For a matter of simplicity, we suppose that the introduction of demand response would not depreciate price. Both simplifications lead to optimistic evaluations since in reality the use of full capacity of demand response may depend on the load level and may impact
price level.
About the variable cost of demand response for a demand response operator targeting small consumers, it requires to take into account that the demand response operator must pay the supplier whose load is curtailed. When the consumer has contracted a fixed price rate, the demand response operator must pay the consumer to award him for its efforts of curtailment (RTE, 2011). Besides, in the case of a demand curtailment in real time, the generator must also be compensated for its planned but unsupplied energy (see Glachant & Perez, 2010 for references). We assume that in this case, the demand response aggregator must pay the supplier or directly the consumer 50 €/MWh.
A last uncertainty about demand response is the cold load pick-‐up effect. To avoid any case by case study, we will assume that the duration of the CLPU effect is equal to the duration of the related demand curtailment. We will then consider three levels of CLPU effect, first 0% (no CLPU effect), 50% and 100%.
3.2.2 Estimations of the revenue of a demand response operator
A demand response operator can cumulate to some extent the revenue from both the day-‐ahead market and the real time market, limiting thereby the problem of missing money. In reality, the demand response operator would face uncertainty about the real time prices while wondering day-‐ ahead whether to bid on the spot market or to wait and possibly bid on the real time market. In order to evaluate the potential revenue from such a strategy, we assume that the demand response operator perfectly anticipates the balancing prices day-‐ahead and knows whether its bid will be accepted in real time. The demand response operator is then able to make perfect arbitrage between the day-‐ahead market and the real time market. In particular, when it can earn more on the day-‐ahead market than on the real time one, it would decide to act in the former one at that moment24.
Reasoning backward, we first detail its revenue from the balancing market in a given hour h of a given day d. Knowing perfectly the balancing price at hour h, it is then able to know when its bid is activated that is to say when its bid price p_Bd,h is lower than the balancing price p_BMd,h. In the
French system, it is paid its bid price p_Bd,h for the volume it offers. This volume depends not only on
its current decision to curtail load curtailmentd,h but also on the CLPU effect from previously curtailed
load CLPUEd,h-‐1 that should then be subtracted. It must also compensate the supplier for the energy
24 Or conversely the real time price is higher than the day-‐ahead price when the latter is maximum, it would decide to act in the real time market at that moment and search for the moment when the spot price is the second higher.
supplied while the demand response operator is curtailing load (supplier_compensation25). The
following formula sums up the revenue for the demand response operator in the balancing market when it decides to participate at hour h.
(
) (
)
⎪
⎩
⎪
⎨
⎧
<
−
×
−
•
≥
•
=
− h , d h , d h , d h , d h , d h , d h , d h , dBM
_
p
B
_
p
CLPUE
t
curtailmen
on
compensati
_
plier
sup
B
_
p
BM
_
p
B
_
p
BM
_
revenue
when
when
0
1The balancing responsible party whose perimeter includes the demand response operator must also bear an imbalance cost due to the CLPU effect CLPUEd,h-‐1 it pays at the upward imbalance price
when no curtailment is planned hour h (curtailmentd,h = 0). It then pays the following penalty
⎩
⎨
⎧
=
≠
×
=
=
− −0
and
0
if
0
if
0
1 1 h , d h , d h , d h , b Im h , d h ,d
p
CLPUE
curtailmen
t
curtailmen
t
t
curtailmen
payment
_
imbalance
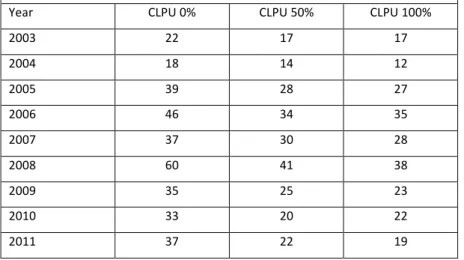
The demand response operator can also earn money day-‐ahead shifting load from peak time to valley time. The optimised spot product we consider is similar to the one proposed by RTE (2011) in the framework of discussions about the characterisation of demand side response in the CURTE26,
the Committee of Users of the Electric Transmission Network, in order to calculate the marginal gross gain of a demand response operator between 2006 and 2008. RTE (2011) considers a theoretical product optimised on a daily basis. This product could be the result of an aggregation in the portfolio of a supplier. It is then less restrictive than a curtailment that would happen for a unique customer27.
The studied product is a 1MW load curtailment activated 1 hour a day during the daily peak and with a CLPU effect occurring optimally during the off-‐peak time28. The revenue generated by this product
is basically equal to the difference between the day-‐ahead maximum hourly price p_DAd,hmax and the
day-‐ahead minimum hourly price p_DAd,hmin. In our case, we have to take into account that higher
revenue can be generated from the real time market. The peak time hmax when load is shifted to the valley time is then determined by the moment when the revenue from day-‐ahead market is higher than the expected revenue from the balancing market. This is given by the following formula:
25 It has to paid 50 €/MWh to the supplier in this case (see supra). 26 In French, Comité d’Utilisateurs du Réseau de Transport d’Electricité.
27 In this situation, the rebound effect would happen just after the curtailment period. 28 RTE assumes the level of the CLPU effect to be 75%.
min h , d max h , d d
p
_
DA
p
_
DA
DA
_
revenue
=
−
Where{
d,h}
h min d,h = min p_DA DA _ p And(
)
⎭
⎬
⎫
⎩
⎨
⎧
>
−
=
h , d min h , d h , d h , d h max h , dp
_
DA
p
_
DA
revenue
_
BM
DA
_
p
max
DA
_
p
such
that
Such a formula authorizes a demand response operator to benefit from high revenue on the balancing market and on the remaining most interesting opportunity on the day-‐ahead market. It can be noticed that the imbalance payments are not considered. We assume here that the demand response operator cannot anticipate the imbalance price and is fully risk-‐taker vis-‐à-‐vis this payment.
The total revenue of the demand response operator is then given by the following formula
(
)
∑
+
+
=
h d,h d,h dd
revenue
_
DA
revenue
_
BM
imbalance
_
payment
revenue
_
total
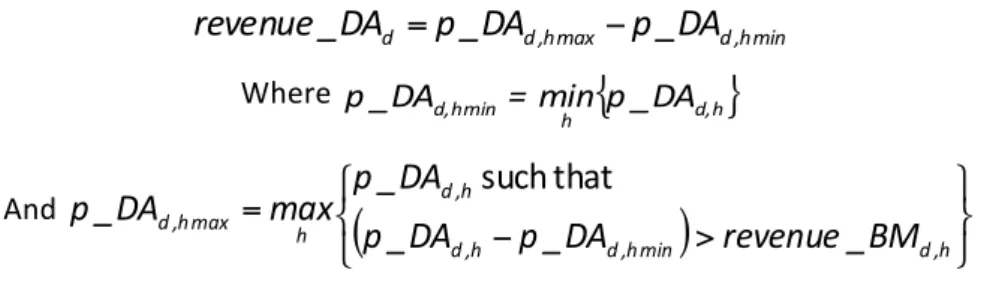
Considering these formulas detailing the revenue that a demand response operator can earn from the day-‐ahead and the real time market, we search for the bid price in the real time market that would optimise its total revenue. We perform this calculus using data from the beginning of the French balancing market in summer 2003 to the end of 2011 and spot prices for the same period. Table 2 summarises the prices that would optimise the cumulated revenue of a demand response program arbitraging the real time and day-‐ahead markets with the different values of the CLPU effect.
Table 2 Prices optimising the maximal expected revenue of a demand response program that arbitrages the real time market and the day-‐ahead market when the CLPU effect is respectively 0%,
50%, 100% Value of the CLPU effect Price optimising the real time revenue of the
demand response program
Optimised revenue between 2003 and 2011
0 % 79 €/MWh 329 k€/MW 50 % 94 €/MWh 231 k€/MW 100 % 95 €/MWh 220 k€/MW
With these prices, we obtain annual revenue ranging from 12,000 €/MW to 60,000 €/MW for the different levels of the CLPU effect, as summarized in table 3.
Table 3 Average revenue from the arbitrage between the day-‐ahead market and the real time market for a demand response program with different levels of the CLPU effect between 2003 and
2011
Average total revenue (k€/MW) from the arbitrage between the day-‐ahead market and the real time market for different levels of the CLPU effect Year CLPU 0% CLPU 50% CLPU 100%
2003 22 17 17 2004 18 14 12 2005 39 28 27 2006 46 34 35 2007 37 30 28 2008 60 41 38 2009 35 25 23 2010 33 20 22 2011 37 22 19
The three figures below illustrate the origin of the revenue, either from the day-‐ahead market or from the real time market respectively for the three considered values of the CLPU effect. They compare it to our estimations of the annualised fixed costs of a demand response operator needs, that is to between 34 and 75 k€/MW.year.
Figure 3 -‐ Comparison between the minimum annualised investment cost of a demand response program and its annual revenue from the arbitrage between the day-‐ahead and real time markets
between 2003 and 2011
0% CLPU effect 50% CLPU effect 100% CLPU effect
The analysis of figure 3 shows that a demand response operator experiencing a CLPU effect below 50 % would have earned a revenue between 2005 and 2011 from the perfect arbitrage between the day-‐ahead market and the real time market above the minimum required level to avoid any problem of missing money.
This optimistic result should of course be tempered. We assume a perfect arbitrage between day-‐ahead and real time. This result encompasses risk for the business of any demand response operator because it may not perfectly manage its bid on the two markets on an hourly base in presence of uncertainties29. Besides, if its annual revenues are here higher than the minimum
needed revenue, they are still quite far from the less pessimistic level of the annualised investment cost of a demand response operator (75 k€/MW as calculated in table 1). The problem of missing money may then still remains with imperfect arbitrage between the day-‐ahead market and the real time market.
29 For instance, an operator can anticipate low revenue with quite low uncertainty from the day-‐ahead market hoping for higher but more uncertain revenue from the real time for the same hour.
4 Which solution to solve the missing money problem for a demand response
program?
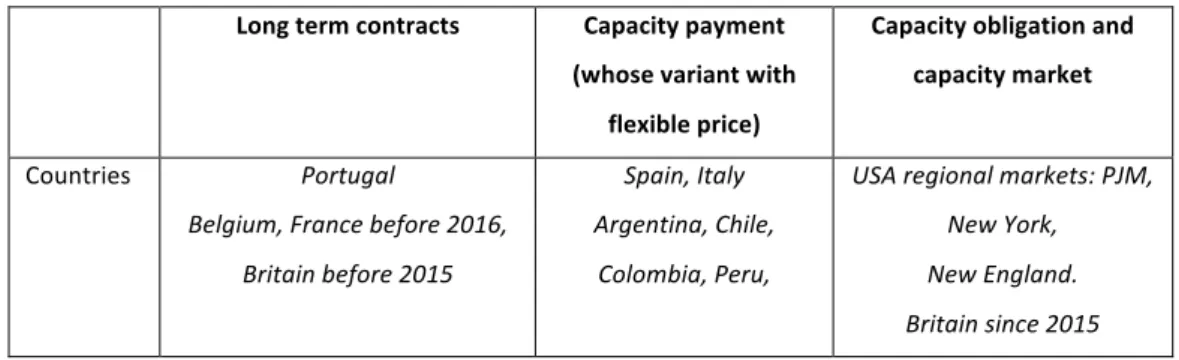
Electricity markets currently implement different tools to solve the missing money problem for peak generation. Some markets have implemented regulation-‐oriented mechanisms to remunerate peak generation while other regions have implemented market-‐oriented mechanisms instead. Finon and Pignon (2008) distinguish four main types of solutions to compensate for the missing money problem: namely Strategic Reserves (detained by the system operator), Long Term Contract, Capacity Payment and Capacity Market. Table 4 illustrates the three last options (since the first one implies the vertical integration of peak generation with the system operator).
Table 4 Tools to solve the missing money problems in different countries
Long term contracts Capacity payment
(whose variant with flexible price)
Capacity obligation and capacity market
Countries Portugal
Belgium, France before 2016, Britain before 2015
Spain, Italy Argentina, Chile,
Colombia, Peru,
USA regional markets: PJM, New York, New England. Britain since 2015
To evaluate the match between these different capacity mechanisms and the distinctive characteristics of demand response, the features that distinguish a demand response program from peak generation must then be taken into account. We will present the listed tools from the most integrated and regulated solutions to the more market-‐oriented ones. We will evaluate the matching between the above mentioned specificities of demand response program (in particular control and dynamics of the customer base) and the different solutions to missing money, i.e. long-‐term capacity contracts, the capacity payments and finally the capacity markets.
In half of the power markets of the USA, each electricity supplier must be able to demonstrate to the Independent System Operator (ISO) that it can withstand all the demands of its customers in case of peak time plus a certain margin (Finon & Pignon, 2008). It has three tools to achieve this goal: 1° its own generation capacity, 2° the long-‐term contracts it has with other producers in the area of its ISO, 3° some additional generation capacity rights that it may acquire or exchange on a dedicated capacity market.
Indeed, capacity markets have been introduced in some USA regions. The producers can exchange capacity credits on a market and are then compensated for the capacity they have (in addition to the revenue they get from the energy market for their output). However, if a producer is