C E L L B I O L O G Y
ATAT1-enriched vesicles promote microtubule
acetylation via axonal transport
Aviel Even1*, Giovanni Morelli2,3*, Loïc Broix2*, Chiara Scaramuzzino4,5, Silvia Turchetto2, Ivan Gladwyn-Ng2, Romain Le Bail2, Michal Shilian1, Stephen Freeman2, Maria M. Magiera6,7, A. S. Jijumon6,7, Nathalie Krusy2, Brigitte Malgrange2, Bert Brone3, Paula Dietrich8, Ioannis Dragatsis8, Carsten Janke6,7, Frédéric Saudou4,5,9, Miguel Weil1*†, Laurent Nguyen2*†
Microtubules are polymerized dimers of - and -tubulin that underlie a broad range of cellular activities. Acetylation of -tubulin by the acetyltransferase ATAT1 modulates microtubule dynamics and functions in neurons. However, it remains unclear how this enzyme acetylates microtubules over long distances in axons. Here, we show that loss of ATAT1 impairs axonal transport in neurons in vivo, and cell-free motility assays confirm a requirement of -tubulin acetylation for proper bidirectional vesicular transport. Moreover, we demonstrate that the main cellular pool of ATAT1 is transported at the cytosolic side of neuronal vesicles that are moving along axons. Together, our data suggest that axonal transport of ATAT1-enriched vesicles is the predominant driver of -tubulin acetylation in axons.
INTRODUCTION
Neurons are polarized cells, structurally and functionally divided into somatodendritic and axonal compartments. Axons are often long and characterized by intense bidirectional microtubule (MT)–dependent transport of cargos to control critical functions, including cell sur-vival and neurotransmission. Cargos such as vesicles and membrane organelles (e.g., mitochondria, endosomes, and lysosomes) as well as proteins and messenger ribonucleoprotein complexes are loaded on molecular motors to undergo axonal transport along MTs. The anterograde transport is powered by the kinesin superfamily, while retrograde transport involves cytoplasmic dynein (1). Posttransla-tional modifications (PTMs) of MTs have been suggested to modu-late axonal transport (2, 3). Specifically, the acetylation of MTs may contribute to this process by enhancing the recruitment of kinesin and dynein and their mobility (4, 5). Moreover, increasing MT acetyl-ation improves the transport deficits resulting from mutacetyl-ations in
Huntingtin and LRRK2 genes (4, 6). The acetylation of -tubulin in
MTs is driven by the -tubulin N-acetyltransferase 1 (ATAT1)/MEC17 (7, 8). Recent in vitro experiments performed with recombinant ATAT1 have suggested that it can enter the lumen of MTs from their extrem-ities and/or lateral imperfection (9, 10) and passively diffuses to promote acetylation of -tubulin K40 residues (11, 12). However, it remains unclear how ATAT1 reaches and acetylates MTs in living cells. This question is particularly important in neurons where axons and dendrites cover long distances with rather homogenously acetylated MTs. To decipher how ATAT1 promotes MT acetylation
in neurons, we combined cell-free assays with cellular and molecular analyses of ex vivo (organotypic slices) or cultured mouse cortical projection neurons (in microfluidic chambers) and motoneurons of
Drosophila larvae in vivo. Our work unveils the existence of a
pre-dominant pool of ATAT1 at the cytosolic side of motile vesicles, whose active transport promotes acetylation of -tubulin in MTs. Therefore, we propose that the transport of ATAT1-enriched vesicles is a predominant driver of axonal MT acetylation.
RESULTS
Loss of Atat1 interferes with axonal transport in neurons across species
ATAT1 promotes the acetylation of -tubulin in MTs, a PTM that favors the recruitment of kinesin and dynein and their mobility along axons (4, 5, 13). To test whether loss of Atat1 impairs axonal trans-port in cortical projection neurons in situ, we performed time-lapse recordings of organotypic brain slices from postnatal (P) day 2 wild-type (WT) mice. For this purpose, embryonic day 14.5 (E14.5) mouse embryos were in utero electroporated (IUE) with a combina-tion of 4OH-tamoxifen (4OHT)–inducible Cre, Cre-inducible short hairpin RNA against Atat1 (shAtat1) (fig. S1A), Cre-inducible red fluorescent protein, and Lamp1-Emerald plasmids. Successive in-jections of 4OHT allowed us to identify the callosal projection of IUE neurons and record the transport of Lamp1-Emerald–positive lysosomes (Fig. 1, A and B, and movie S1). We showed that the 4OHT-induced knockdown (KD) of Atat1 in callosal projection neurons 3 days after IUE at E14.5 (to maintain the expression of
Atat1 during the migration of projection neurons) impaired both
anterograde and retrograde axonal transports recorded at P2 (Fig. 1, A to F, and fig. S1B). The KD of Atat1 led to the reduction of the average and instantaneous velocities (Fig. 1, C and D) and the run length and to the increase of the pausing time of lysosomes (Fig. 1, E and F). These data were confirmed in cortical projection neurons from E14.5 Atat1 knockout mice (Atat1 KO) or their cor-responding WT controls (14) cultured for 5 days in vitro (DIV) in microfluidic devices and incubated with fluorescent probes to fol-low the transport of lysosomes and mitochondria along axonal MTs (Fig. 1, G and H, and movies S2 and S3). The average velocities
1Laboratory for Neurodegenerative Diseases and Personalized Medicine, Depart-ment of Cell Research and Immunology, The George S. Wise Faculty for Life Sciences, Sagol School of Neurosciences, Tel Aviv University, Ramat Aviv 69978, Israel. 2GIGA-Stem Cells and GIGA-Neurosciences, Interdisciplinary Cluster for Applied Genoproteomics (GIGA-R), University of Liège, CHU Sart Tilman, Liège 4000, Belgium. 3BIOMED Research Institute, University of Hasselt, Hasselt 3500, Belgium. 4Grenoble Institut des Neurosciences, GIN, Univ. Grenoble Alpes, F-38000 Grenoble, France. 5Inserm, U1216, F-38000 Grenoble, France. 6Institut Curie, PSL Research University, CNRS UMR 3348, F-91405 Orsay, France. 7Université Paris-Sud, Université Paris-Saclay, CNRS UMR3348, F-91405 Orsay, France. 8Department of Physiology, University of Tennessee Health Science Center, Memphis, TN 38163, USA. 9CHU Grenoble Alpes, F-38000 Grenoble, France.
*These authors contributed equally to this work.
†Corresponding author. Email: lnguyen@uliege.be (L.N.); miguelw@tauex.tau.ac.il (M.W.)
Copyright © 2019 The Authors, some rights reserved; exclusive licensee American Association for the Advancement of Science. No claim to original U.S. Government Works. Distributed under a Creative Commons Attribution NonCommercial License 4.0 (CC BY-NC). on January 15, 2020 http://advances.sciencemag.org/ Downloaded from
G
Inducible DsRed/Lamp1-Emerald
sh-Scrsh-Atat1 0.0 0.1 0.2 0.3 0.4 0.5
Av. Lamp1-Emerald velocity (µm/s
) sh-Scrsh-Atat1 0 20 40 60 80 100
Lamp1-Emerald pausing time (%)
sh-Scrsh-Atat1 0 1 2 3 4 5 6 7
Lamp1-Emerald run length (µm)
sh-Scrsh-Atat1 20.8 20.6 20.4 20.2 0.0 0.2 0.4 0.6 0.8
Instant. Lamp1-Emerald velocity (µm/s
) WT + GFP WT + ATAT1-GFPAtat1 KO + GFP Atat1 KO + ATAT1-GFP 0.0 0.1 0.2 0.3 0.4 0.5 0.6
Av. lysosome velocity (µm/s
) N.S. N.S. WT + GFP WT + ATAT1-GFPAtat1 KO + GFP Atat1 KO + ATAT1-GFP 21.0 20.8 20.6 20.4 20.2 0.0 0.2 0.4 0.6 0.8 1.0
Instant. lysosome velocity (µm/s
) N.S. N.S. N.S. N.S. WT + GFP WT + ATAT1-GFPATAT1 KO + GFP Atat1 KO + ATAT1-GFP 0 20 40 60 80 100
Pausing time (%) lysosomes
N.S. N.S. WT + GFP WT + ATAT1-GFPAtat1 KO + GFP Atat1 KO + ATAT1-GFP 0 1 2 3 4 5 6 7 8
Run length (µm) lysosomes
N.S. N.S. sh-Scr + Tub-GFP sh-Scr + K40Q Tub-GFP sh-Atat1 + Tub-GFP sh-Atat1 + K40Q Tub-GFP 0.0 0.2 0.4 0.6
Av. lysosome velocity
( µm/s ) N.S. sh-Scr + Tub-GFP sh-Scr + K40Q Tub-GFP sh-Atat1 + Tub-GFP sh-Atat1 + K40Q Tub-GFP 21.0 20.8 20.6 20.4 20.2 0.0 0.2 0.4 0.6 0.8 1.0
Instant. lysosome velocity (µm/s )
N.S. N.S. N.S. N.S. sh-Scr + Tub-GFP sh-Scr + K40Q Tub-GFP sh-Atat1 + Tub-GFP sh-Atat1 + K40Q Tub-GFP 0 2 4 6 8 10
Run length (µm) lysosomes
N.S. N.S. sh-Scr + Tub-GFP sh-Scr + K40Q Tub-GFP sh-Atat1 + Tub-GFP sh-Atat1 + K40Q Tub-GFP 0 20 40 60
Pausing time (%) lysosomes
N.S. N.S. D E F I J K L N O P Q A E14.5 E15.5 M E14 IUE E17 E18 P1 P2
4OHT 4OHT 4OHTOrganotypic slices Soma Axon DsRed Anterograde Retrograde B H
Corpus callosum midline
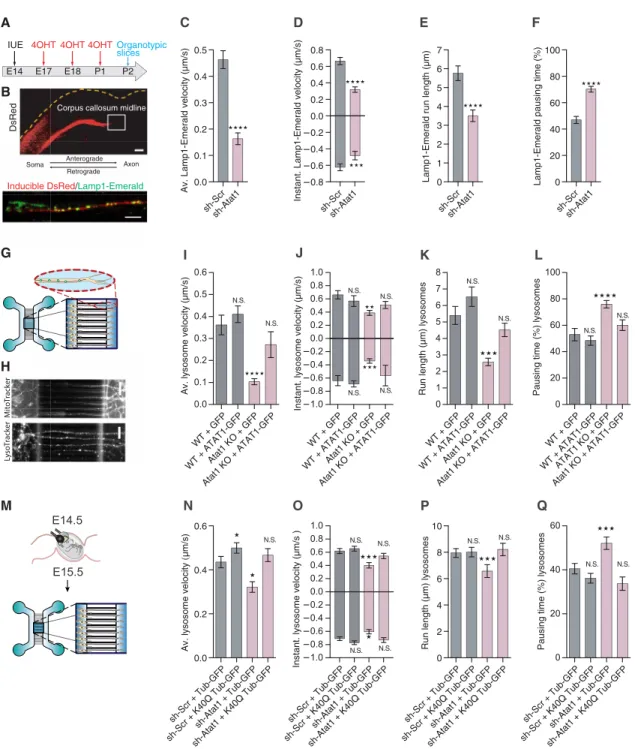
Fig. 1. Depletion of Atat1 prevents acetylation of -tubulin and interferes with fast axonal transport of organelles ex vivo and in vitro. (A) Experimental setup
used to perform axonal transport recordings in organotypic brain slice. (B) Labeling of lysosome Lamp1-Emerald+ (green) and inducible dsRed (red) in axons crossing the corpus callosum of a P2 mouse cortical section. Scale bars, 200 m (top) and 10 m (bottom). (C to F) Histograms showing axonal transport parameters of Lamp1-Emerald (lysosomes) to analyze average velocity (C), instantaneous velocity (D), run length (E), and pausing time (F). (G) Microfluidic device setup used for recording axonal transport in cortical neurons. (H) Labeling of lysosomes and mitochondria with fluorescent probes (LysoTracker and MitoTracker) in cortical neurons cultured 5 DIV and isolated from E14.5 WT or Atat1 KO mouse embryos. Scale bars, 50 m. (I to L). Histograms showing parameters of axonal transport of lysosomes to analyze average velocity (I), instantaneous velocity (J), run length (K), and pausing time (L) of mouse cortical neurons transfected with GFP or ATAT1-GFP, cultured 5 DIV, and isolated from E14.5 from WT or Atat1 embryos. (M) Experimental setup for time-lapse recording of axonal transport in E15.5 cortical neurons isolated from E14.5 IUE mouse embryos and cultured 5 days in microfluidic device. N.S., not significant. (N to Q) Histograms showing parameters of axonal transport of lysosomes (LysoTracker) to analyze average velocity (N), instantaneous velocity (O), run length (P), and pausing time (Q) in mouse cortical neurons cultured 5 DIV from E15.5 embryos transfected with WT -tubulin GFP (Tub-GFP) or acetylation mimic K40Q -tubulin GFP (K40Q Tub-GFP) together with sh-Scramble (sh-Scr) or sh-Atat1. Description of graphical summaries here within are histograms of means ± SEM, while statistical analyses of (C to F) are two-tailed Mann-Whitney and (I, J, K, L, N, O, P, and Q) are Kruskal-Wallis test. Specifically [(C) P < 0.0001 and U = 17,455; (D) P < 0.0001 and U = 3044 and P = 0.0002 and U = 6372 for anterograde and retrograde, respectively; (E) P < 0.0001 and U = 20,972; (F) P < 0.0001 and U = 26,168; (I) P < 0.0001 and K = 54.03; (J) P = 0.0033 and K = 13.74 and P < 0.0001 and K = 36.45 for anterograde and retrograde, respectively; (K) P < 0.0001 and K = 38.29; (L) P < 0.0001 and K = 34.05; (N) P < 0.0001 and K = 31.88; (O) P = 0.0006 and K = 17.43 and P = 0.0002 and K = 20.19 for anterograde and retrograde, respectively; (P) P < 0.0001 and K = 22.29; and (Q) P < 0.0001 and K = 28.7).
on January 15, 2020
http://advances.sciencemag.org/
(Fig. 1I and fig. S1, G, M, N, and R), anterograde and retrograde instantaneous velocities (Fig. 1J and fig. S1, H, M, N, and R), and run lengths (Fig. 1K and fig. S1, I, M, N, and R) of moving vesicles and mitochondria were reduced, while their pausing time were in-creased (Fig. 1L and fig. S1, J, M, N, and R). These modified vesicular parameters were associated with an impairment in the overall flux of organelles in Atat1 KO mice (fig. S1, K, L, M, and N), likely arising from the reduced recruitment of motors onto MTs. Western blot-ting analyses revealed that lack of ATAT1 expression in newborn cortical neurons resulted in the absence of MT acetylation (fig. S1, O and P) without affecting the expression level of histone deacetylase 6 (HDAC6), the main -tubulin deacetylase (fig. S1, O and Q). Expres-sion of catalytically active ATAT1–green fluorescent protein (GFP) (15, 16) in cortical neurons from E14.5 WT and Atat1 KO embryos rescued the average velocity (Fig. 1I and fig. S1R), anterograde and retrograde instantaneous velocities (Fig. 1J and fig. S1R), run length (Fig. 1K and fig. S1R), and pausing time (Fig. 1L and fig. S1R) of lysosomes. To confirm that the defects in axonal transport upon down-regulation of Atat1 arise from reduced -tubulin acetylation, we coexpressed the acetyl mimic -tubulin K40Q with shAtat1 (fig. S1S) in projection neurons of WT E14.5 embryos. We isolated the electro-porated neurons 1 day after electroporation and cultured them 5 days in microfluidic devices (Fig. 1M). Our recordings showed that ex-pression of -tubulin K40Q rescued the average and instantaneous transport velocities of lysosomes (Fig. 1, N and O, and fig. S1X) and mitochondria (fig. S1, T, U, and Y), as well as their run lengths (Fig. 1P and fig. S1, V, X, and Y) and pausing time (Fig. 1Q and fig. S1, W, X, and Y) resulting from Atat1 KD at E14.5.
We further examined whether the role of ATAT1 in axonal trans-port is conserved in vivo in Drosophila melanogaster. We assessed the transport of synaptotagmin-GFP vesicles in axons of third-instar larva motoneurons (Fig. 2, A and B, and movie S4) upon RNA inter-ference (RNAi)–mediated KD of Atat1/2 (the orthologs of mouse
Atat1 in D. melanogaster). Individual KDs of Atat1 and Atat2 were
not compensated by expression of other -tubulin acetylation regu-lators (fig. S2, A and B) and led to the reduction of average velocity (Fig. 2C and fig. S2C), anterograde and retrograde instantaneous velocities (Fig. 2D and fig. S2C), as well as run length (Fig. 2E and fig. S2C) of synaptotagmin-GFP vesicles, with associated increase of their pausing time (Fig. 2F and fig. S2C). The transport defects were not resulting from global protein aggregation along axons (fig. S2D) but were more likely associated with the decreased acetylation of MTs (Fig. 2, G and H). This was further supported by a genetic rescue of axonal transport upon concomitant depletion of the main -tubulin deacetylase Hdac6 (17) (fig. S2E) in motoneurons from individual KD of Atat1 or Atat2 larva (Fig. 2, C to F, and fig. S2C), where re-sidual Atat activity can promote MT acetylation (Fig. 2, G and H). These data were also supported in the third-instar larvae fed for 30 min before recordings with 10% sucrose solution contain-ing tubastatin (TBA), a specific inhibitor of HDAC6 (18), which rescued all measured axonal transport parameters (Fig. 2, I to L, and fig. S2F).
Impaired axonal transport in larvae or adult fly motoneurons leads to locomotor behavior deficits (18). We thus monitored the climbing index of adult flies as well as the crawling speed and peri-staltic body-wave frequency of their larvae as functional readouts of single or combined KD of Atat1/2 (6, 19). These motoneuron- dependent activities were affected upon conditional KD of Atat1/2 expression (Fig. 2, M to O) and were rescued by either a concomitant
genetic depletion of Hdac6 (Fig. 2, M to O) or inhibition of HDAC6 activity using TBA (Fig. 2, P and Q). The disruption of motor be-haviors was most likely a consequence of fast axonal transport defects, since we did not observe morphological changes at the neuro-muscular junctions’ synapses (fig. S2, G and H) and the RNAi-mediated KD was restricted to motoneurons (see Materials and Methods). Together, these data support that ATAT1 promotes the acetylation of axonal MTs across vertebrate and invertebrate species and that acetylation of the MTs tracks is an important regulator of fast axonal transport.
We next assessed in a cell-free in vitro molecular transport assay how the reduction of K40 acetylation on MTs affects bidirectional axonal transport. For this purpose, purified vesicles were added to in vitro polymerized and polarity-marked MTs (to determine trans-port directionality), where 10% of rhodamine-labeled (acetylated) tubulin were mixed with either unacetylated tubulin from Atat1 KO mouse brains or with endogenously acetylated tubulin from WT littermates (control) (Fig. 3, A and B, and movie S5). While MTs from
Atat1 KO mouse brains were lacking acetylation (20), they were not
showing defects of polyglutamylation, glutamylation, tyrosination, or the abundance of 2 tubulin PTMs (Fig. 3C). In vitro transport analyses showed that vesicles’ anterograde and retrograde instanta-neous velocities (Fig. 3D and fig. S3A), together with their run lengths (Fig. 3E and fig. S3A), were reduced when vesicles were transported along Atat1 KO brain-derived MTs as compared with acetylated MTs isolated from WT brains. These data were comparable to the one obtained in neurons in vitro and in vivo (Figs. 1, D and E, and 2, D and E) and further demonstrate that loss of -tubulin K40 acetyl-ation impairs MT-dependent transport.
Atat1 is transported along MTs at the external surface of motile vesicles
Axons and dendrites are highly enriched in long-lived MTs, whose acetylation depends on ATAT1 distribution and activity. In vitro experiments have previously reported that recombinant ATAT1 undergoes slow and passive diffusion inside MT lumen (12). However, it remains unclear how ATAT1 reaches the MTs in living neurons; thus, we studied its axonal distribution in cultured cortical neurons isolated from E14.5 mice. Mouse cortical neurons were transfected with a combination of plasmids coding for brain-derived neuro-trophic factor (BDNF)–mCherry and ATAT1-GFP and cultured 5 DIV. Analysis by superresolution microscopy revealed a punctate distribution of ATAT1 along axons, partially overlapping with the dense core vesicle marker BDNF, suggesting a possible vesicular enrichment of ATAT1 (Fig. 4A). The vesicular enrichment of ATAT1 was further confirmed in cultured human projection neurons derived from pluripotent stem cells, showing that expression of endogenous ATAT1 broadly codistributes with lysosomes (LAMP1 positive) and precursors of synaptic vesicles (SV2C and synaptophysin positives) along their axon (Fig. 4B).
To confirm the vesicular expression of ATAT1, we performed liquid chromatography–tandem mass spectrometry (LC-MS/MS) on vesicular extracts isolated from the cortex of newborn mice. The analysis of the vesicular enriched fraction detected 3648 proteins whose overlap with published vesicular proteomes was, in average, 75% (21–23) (Fig. 4C). These analyses showed that ATAT1, but not HDAC6, is detected together with kinesins and dyneins in a mid-range fraction of the vesicular proteomic content (Fig. 4D and table S1). Western blot analysis of the subcellular fractions obtained from
on January 15, 2020
http://advances.sciencemag.org/
Brain Motor axons A B C SYT1-GFP 0.0 0.2 0.4 0.6 0.8 1.0 1.2 1.4
Av. SYT1-GFP velocity (
µm
/s)
N.S.
Instant. SYT1-GFP velocity (
µm /s) N.S. N.S. 0 5 10 15 20
SYT1-GFP pausing time (%)
N.S. I J K L 4 5 6 7 0 1 2 3
SYT1-GFP run length (µ
m ) N.S. Control Atat1 KD Atat2 KD Atat1; Hdac6 KD Atat2; Hdac6 KD
Total Tub Ac α-Tub
G
P
Control + DMSO Atat1;Atat2 KD + DMSOAtat1;Atat2 KD + TBA
0 20 40 60 80 Peristaltic waves/min N.S. Control + DMSO Atat1;Atat2 KD + DMSOAtat1;Atat2 KD + TBA
0 2 4 6 8 10 12 Crawling speed(mm/s) N.S. Q ControlAtat1 KDAtat2 KD
Atat1;Hdac6 KDAtat2;Hdac6 KD 0.0 0.1 0.2 0.3 0.4 0.5 0.6 0.7 0.8
Av. SYT1-GFP velocity (
µm
/s)
N.S.
ControlAtat1 KDAtat2 KD Atat1;Hdac6 KDAtat2;Hdac6 KD 21.0 20.8 20.6 20.4 20.2 0.0 0.2 0.4 0.6 0.8 1.0
Instant. SYT1-GFP velocity (
µm
/s)
N.S.
N.S.
ControlAtat1 KDAtat2 KD Atat1;Hdac6 KDAtat2;Hdac6 KD 0 5 10 15 20 25
SYT1-GFP pausing time (%)
N.S.
ControlAtat1 KDAtat2 KD Atat1;Hdac6 KDAtat2;Hdac6 KD 0.0 0.2 0.4 0.6 0.8 1.0 1.2 1.4 Relative acetylated α -tubulin H N.S
ControlAtat1 KDAtat2 KD Atat1;Hdac6 KDAtat2;Hdac6 KD 0 1 2 3 4 5 SYT1-GFP run length ( µm) N.S. D E F
ControlAtat1 KDAtat2 KD Atat1;Hdac6 KDAtat2;Hdac6 KD 0.0 0.5 1.0 1.5 Climbing index O N.S.
ControlAtat2 KDAtat1 KD Atat1;Hdac6 KDAtat2;Hdac6 KD 0 20 40 60 80 Peristaltic waves/min M N.S.
ControlAtat1 KDAtat2 KD Atat1;Hdac6 KDAtat2;Hdac6 KD 0 2 4 6 8 10 12 Crawling speed (mm/s) N.S. N Control + DMSO Atat1;Atat2 KD + DMSOAtat1;Atat2 KD + TBA
Control + DMSO
Atat1;Atat2 KD + DMSOAtat1;Atat2 KD + TBA Atat1;Atat2 KD + TBA
Control+DMSO Atat1;Atat2 KD + DMSO
Control + DMSO Atat1;Atat2 KD + DMSOAtat1;Atat2 KD + TBA
21.6 21.2 20.8 20.4 0.0 0.4 0.8 1.2 1.6
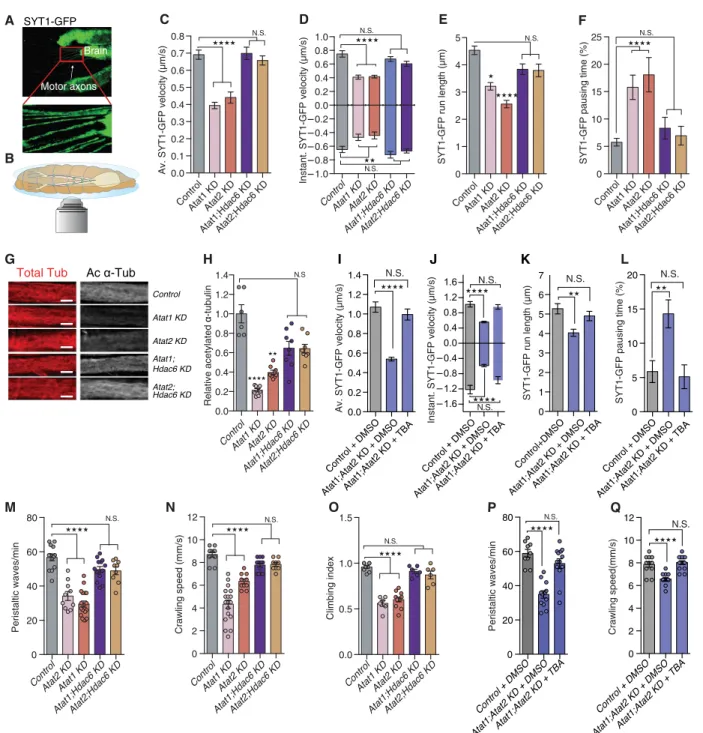
Fig. 2. Depletion of Atat1 prevents acetylation of -tubulin and interferes with fast axonal transport of organelles in vivo. (A and B) In vivo live-imaging setup
used to record axonal transport of synaptotagmin-GFP (SYT1-GFP in green) in D. melanogaster third-instar larvae expressing UAS:RNAi under a motoneuron-specific driver (D42:GAL4) to analyze average velocity (C), instantaneous velocity (D), run length (E), and pausing time (F). (G and H). Analyses of immunolabeled motoneurons from third-instar larvae to detect total -tubulin (Tot -tub) and acetylated -tubulin (Ac -tub). Scale bars, 10 m. (I to L) Axonal transport recording in Atat1;Atat2 KD third-instar larvae fed for 30 min before recording with 10% sucrose with 1 mM TBA or dimethyl sulfoxide (DMSO) to measure SYT1-GFP average velocity (I), instantaneous velocity (J), run length (K), and pausing time (L). (M and N) Larva peristaltic movements and crawling speed in third-instar larvae expressing RNAi under a motoneuron- specific driver (D42:GAL4). (O) Climbing index in adult flies expressing RNAi under a motor neuron-specific driver. (P and Q) Larva peristaltic movements and crawling speed in third-instar larvae expressing RNAi under a motoneuron-specific driver (D42:GAL4) or in control and Atat1;Atat2 KD larva prefed for 30 min with 10% sucrose with 1 mM TBA or DMSO. Description of graphical summaries here within are histograms of means ± SEM, while statistical analyses of (C, D, E, F, H, I, J, K, and L) are Kruskal-Wallis and (M to Q) is one-way analysis of variance (ANOVA). Specifically [(C) P < 0.0001 and K = 60.10; (D) P < 0.0001 and K = 65.80 and P < 0.0001 and K = 76.02 for anterograde and retrograde respectively; (E) P < 0.0001 and K = 25.39; (F) P < 0.0001 and K = 9.6; H, P < 0.0001 and K = 30.09; (I) P < 0.0001 and K = 121.1; (J) P < 0.0001 and K = 62.57 and P < 0.0001 and K = 50.34 for anterograde and retrograde, respectively; (K) P < 0.0001 and K = 24.3; (L) P < 0.0001 and K = 12.96, M, P < 0.0001 and F(4, 58) = 34.55; (N)
P < 0.0001 and F(4, 55) = 40.83; (O) P < 0.0001 and F(4, 33) = 45.61; (P) P < 0.0001 and F(7, 71) = 27.29; and (Q) P < 0.0001 and F(7, 83) = 47.65]. In addition, post hoc multiple
comparisons for (C, D, E, F, I, J, K, L, and H) Dunn’s tests, for (M to Q) is Dunnett’s test and are *P < 0.05, **P < 0.01, ***P < 0.001, and ****P < 0.0001. The total number of samples analyzed were as follows: (C to F) 110 to 276 vesicle tracks from 7 to 12 larvae per group; (H) 6 to 8 larvae per group; (I to L) 112 to 161 vesicle tracks from at 6 to 8 larvae per group; (M and N) 9 to 18 larvae per group; (O) 6 to 11 assays per group; and (P and Q) 8 to 9 larvae per group.
on January 15, 2020
http://advances.sciencemag.org/
protein extract of newborn mouse brains confirmed the selective enrichment of ATAT1 in the vesicular fraction (P3), contrasting with the predominant cytosolic distribution of HDAC6 (S3) (Fig. 4E). Moreover, time-lapse recordings showed that ATAT1-GFP clusters move bidirectionally together with lysosomes (LysoTracker, Fig. 4F) and dense core vesicles (BDNF-mCherry, Fig. 4F) at velocities that are consistent with axonal transport in transfected cortical projection neurons (Fig. 4, G and H, and movie S6) (24). These data demon-strate that ATAT1 is enriched in the vesicular fraction and that it is transported along axons by motile vesicles.
ATAT1 binds to clathrin-coated vesicles via an AP2 binding domain (amino acids 307 to 387) (25), which is only conserved by its isoforms 1 and 2 (Fig. 4I). Our LC-MS/MS analysis did not detect peptides corresponding to the AP2 binding domain of ATAT1 in purified vesicles extracts (fig. S4A), and Western blott (WB) per-formed on mice cortical brain extracts only detected the presence of ATAT1 isoforms 3 and 4 (Fig. 4E), suggesting that the AP2 bind-ing domain is not required for the recruitment of ATAT1 to motile vesicles.
To identify ATAT1’s vesicle binding domain, we engineered dis-tinct truncated ATAT1 forms by deleting amino acid sequences be-tween the minimal catalytic domain of ATAT1 (amino acids 1 to 196) and the C-terminal part of isoform 4 (amino acids 1 to 333) (Fig. 4I). These constructs were next used to transfect human embryonic kid-ney (HEK) 293 cells and analyzed for their subcellular localization by WB (Fig. 4, J and K). ATAT1 isoform 4 and its amino acid 1 to 286 truncation were enriched in vesicles [vesicles (P3)/cytosol frac-tion ratio (S3) > 1], while the other truncated forms (1 to 242 and 1 to 196) preferentially localized in the cytosol (P3/S3 < 1) (Fig. 4K). Moreover, expression of the vesicular-enriched ATAT1 isoforms was more efficiently raising the level of -tubulin acetylation when ex-pressed in HeLa S3 cells as compared to the others (Fig. 4, L and M). Together, these data suggest that the amino acid sequence of ATAT1
comprised between amino acids 242 to 333 is required for both its vesicular enrichment and efficient -tubulin acetylation.
To decipher whether ATAT1 is encapsulated within the intra-vesicular lumen and/or associated with the extraintra-vesicular membrane, we performed a mild proteinase K digestion to remove protein an-chored at the external surface of vesicles (26). The treatment led to a dose-dependent reduction of ATAT1 and dynein intermediate chain (DIC) without altering levels of the intravesicular protein
-synuclein (Fig. 4N) (26). Together, these data suggest that ATAT1
is enriched at the cytosolic side of moving vesicles, from where it may be released in vicinity of MTs to promote -tubulin acetylation and modulate axonal transport.
The vesicular pool of Atat1 controls axonal transport by promoting acetylation of MTs
We first performed LC-MS/MS on vesicular extracts isolated from the cortex of newborn WT or Atat1 KO mice to check whether loss of Atat1 interferes with axonal transport by altering the vesicular proteome. The analysis revealed that, from 44 differentially detected proteins (fig. S5A and table S2), none of the 29 molecular motor proteins (fig. S5B and table S3) nor the 16 glycolytic enzymes (fig. S5C and table S4) were significantly affected by lack of Atat1 expression. Moreover, gene ontology (GO) data analysis of the dif-ferentially detected proteins did not reveal significantly enriched processes, function, or cellular component upon Atat1 loss in vesicular extracts. Since we did not detect any differences of the Atat1 KO vesicular proteome that can explain the reduction of MT acetyl-ation, we hypothesized that Atat1-enriched vesicle displacement on MTs might be required for their acetylation. To test this hypothesis, we cultured mouse cortical neurons with the cytoplasmic dynein inhibitor ciliobrevin D (20 M) (27) to disrupt axonal transport of vesicles. This led to a mild reduction (33%) of MT acetylation in the soma of the neurons (Fig. 5, A and B) and a severe reduction (67%)
A C D E Ac α-Tub Polyglutamylated Tub Glutamylated Tub Detyrosinated Tub ∆2 Tub Tot α-Tub WT Atat1 KO WT MTs Atat1 KO MTs 0 2 4 6 8 Run length ( µm ) WT MTs Atat1 KO MTs 22.2 21.8 21.4 21.0 20.6 20.20.2 0.6 1.0 1.4 1.8 2.2
Instant. vesicles velocity
(
µm
/s)
B
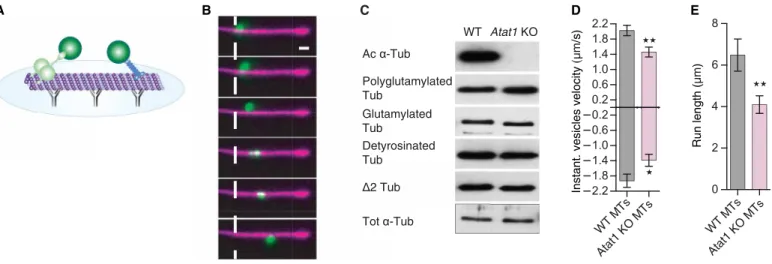
Fig. 3. Vesicle transport is reduced on nonacetylated MTs in vitro. (A) Scheme representing the experimental setup to study in vitro transport and acetylation assays.
(B) Total internal reflection fluorescence (TIRF) image series of rhodamine-labeled MTs (10%, purple) with a transported DIO (green)–labeled vesicle from mouse brains. Scale bar, 2 m; presented frames are in a 400-ms interval. (C) Western blott (WB) analyses to detect acetylated, glutamylated, polyglutamylated detyrosinated, 2, or total -tubulin (Tub) in cortical brain extracts of WT or Atat1 KO adult mice. (D and E) In vitro transport assay of vesicles purified from WT mice with nonacetylated -tubulin from Atat1 KO mouse brain or endogenously acetylated -tubulin from WT mice. Histogram of anterograde and retrograde instantaneous velocities (D) and run length (E) of moving vesicles. Description of graphical summaries here within are histograms of means ± SEM, statistical analyses of (D) and (E) are two-tailed t test. Specifically [(D) P = 0.0299 and t, df(2,273,32) and P = 0.0054 and t, df(2,971,34) for retrograde and anterograde, respectively; and (E) P = 0.0086 and U = 50]. The total number of samples analyzed were as follows: (D and E) 16 to 20 vesicles from three WT or Atat1 KO mice.
on January 15, 2020
http://advances.sciencemag.org/
N E A µg/µl Proteinase K concentration 0 0.01 0.05 0.25 1.25 6.25 H G 1.15 µm/s 0.94 µm/s 24.523.021.5 0.0 1.5 3.0 4.5 0 10 20 30 40 50 Frequency (%) Velocity(µm/s) HDAC6 ATAT1 SPH HH3 T S1 P1 S2 P2 S3 P3 SV2-A SV2-B Atat1 DIC 387 BDNF-mCherry Merge ATAT1-GFP LysoTracker Merge F ATAT1 1–333 ATAT1 1–286 ATAT1 1–242 ATAT1 1–196 DIC α-Tub α-Syn S 2 S 3 P 3 S 2 S 3 P 3 S 2 S 3 P 3 S 2 S 3 P 3 Catalytic domain 193 1 287 421
ATAT1 full length (isoform 1)
1–333 (isoform 4) 1–286 1–242 1–196 333 242 J K I ATAT1-GFP ATAT1-GFP D 20 30 Log 2 (LFQ intensity) GAPDH DYNC1H1 CLTC CCT8 ALDOA DCTN1DCTN2 DYNC1LI1DYNC1I2 SYT1CLTB KIF5C SV2A SYPKIF5B SNAP25 KIF2A DYNC1I1 SYN3 KLC2 DCTN6 KIF5A KIF1A Atat1RAB6B SV2B SNAP29KIF1B NTRK2 STX6 KLC4 SV2C SNCA STX8RABGEF1 KIF3C RAB15 0 1000 2000 3000 Protein rank 25 35 49 184 3474 Takamori et al. 107 322 3335 Borner et al. 261 908 2749 Hinckelmann et al. 1–3331–2861–2421–196 Empty vector 0.0 0.2 0.4 0.6 0.8 1.0 1.2
Relative accetylated a-tubulin
n.s M L
C
ATAT1 1–333 ATAT1 1–286 ATAT1 1–242 ATAT1 1–196 Empty vector
IRES:GFP Tot α-Tub Ac α-Tub Merge 1-3331-2861-2421-196 0 1 2 3 4 5 6 7 8 Veiscles/cytosol (P3/S3) ratio Isoform 2 Isoform 3 354
AP2 binding domain
B
1-3-Synaptophysin
2-BDNF-mCherryMerge
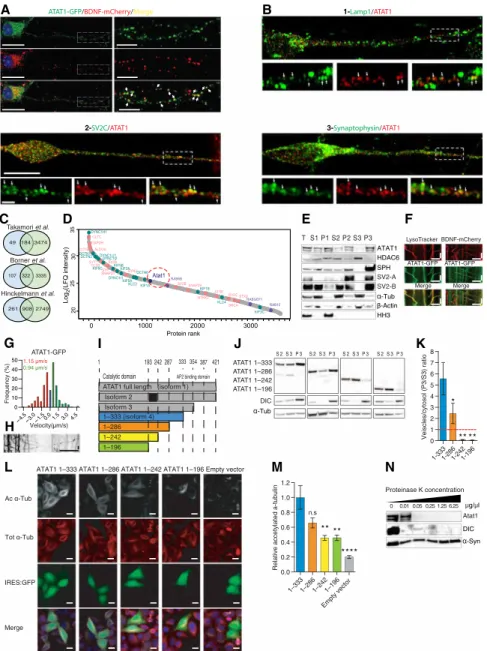
Fig. 4. ATAT1 is a vesicular-enriched protein that localizes on the cytosolic side of the vesicular membrane. (A) Superresolution image of a transfected E14.5 cortical
neuron-cultured 5 DIV and labeled for 4′ 6‐diamidino‐2‐phenylindole (DAPI) (blue), ATAT1-GFP (green), and BDNF-mCherry (red). Scale bar is 20 m for the original image and 5 m for the magnified area. (B) Superresolution imagine of day 36 human projecting neurons derived from hIPSCs and immunostained for ATAT1 along with 1, Lamp1; 2, SV2C; and 3, synaptophysin. Arrowheads indicate codistribution of markers. Scale bar is 10 and 1 m for the original image and magnified area, respectively. (C) Venn diagrams of vesicular content identified by LC-MS/MS in this work and previous publications. (D) LC-MS/MS of vesicle fraction isolated from newborn mouse brain cortices, proteins were ranked by intensity and plotted according to their relative abundance (gray spots). Atat1 (pink) detection among proteins previously identified as vesicular components (purple) and molecular motors (green) (n = 3, graph represent the mean intensity value). (E) Subcellular fractionation (T, total; S1, postnuclear; P1, nuclear; S2, cytosol and vesicles; P2, larges membranes; S3, cytosol; and P3, vesicles) of mouse brain cortex showing predominant vesicular enrichment of Atat1, immunostained with antibodies (Table 1) against ATAT1 (isoform 3 and 4 corresponding to 37 and 30 kDa), histone deacetylase 6 (HDAC6), synaptophysin (SPH), synaptic vesicle glycoprotein 2A/B (SV2A/B), -actin, -tubulin (-tub), and histone H3 (HH3) antibodies. (F) Kymographs of ATAT1-GFP and LysoTracker or BDNF-mCherry in E14.5 cortical neurons axons cultured 5 DIV, showing partial cotransport of Atat1 and lysosomes or BDNF-mCherry. Scale bars, 10 m (x) and 20 s (y). (G and H) Bin distribution and kymograph of ATAT1-GFP transport velocities in transfected E14.5 cortical neurons cultured 5 DIV (n = 5; n for anterograde =143, retrograde = 179). Scale bars, 10 m (x) and 20 s (y). (I) Schematic representation of truncated ATAT1 isoform four constructs. (J and K) Subcellular fractions of cultured HEK293 cells were analyzed using WB to detect ATAT1 truncated forms (J), vesicles/cytosol (P3/S3) ratios were quantified to identify vesicular enrichment (ratio > 1) of the various truncated ATAT1 forms (K). (L and M) Transfected HeLa cells with ATAT1:IRES-GFP truncated constructs were immunolabeled for acetylated -tubulin (Ac -tub, gray), total -tubulin (Tot -tub, red), and DAPI (blue) and analyzed for their relative acetylated -tubulin levels [Ac -tub/Tot -tub ratio, controls are set to 1, (M)]. Scale bar, 10 m. (N) WB analysis of cerebral cortex vesicles subjected to proteinase-K digestion. Intravesicular -synuclein is digestion resistant, while the outer vesicular membrane motor protein DIC as well as Atat1 were digested in an enzymatic concentration–dependent manner. Description of graphical summaries here within are histograms of means ± SEM; statistical analyses of (K) is one-way ANOVA and (M) is Kruskal-Wallis. Specifically [(K) P = 0.0018 and F(3,12) = 17.29; (M) P < 0.0001 and K = 83.16]. In addition, post hoc multiple comparisons are Holm-Sidak’s tests (K), and Dunn’s test (M); *P < 0.05, **P < 0.01, and ****P < 0.0001. The total number of samples analyzed were four independent HEK293 cultures (K) and four independent HeLa cultures (M) per ATAT1 truncation construct.
on January 15, 2020
http://advances.sciencemag.org/
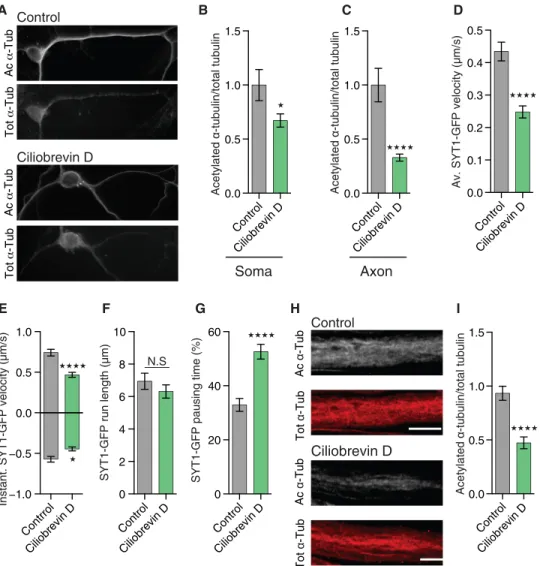
of acetylation of distal axonal MTs (Fig. 5, A and C) as a result of a reduction of axonal transport (Fig. 5D and fig. S6L). At this concentra-tion, ciliobrevin D blocks both retrograde and anterograde transports (27); we thus specifically reduced retrograde transport by knocking down Lis1 in mouse cortical neurons (fig. S6, A to H). This led to a reduction of MT acetylation in the axon but not in the soma of these neurons (fig. S6, I to K). Moreover, feeding Drosophila third-instar larvae with ciliobrevin D (800 M) disrupted anterograde and ret-rograde axonal transport (Fig. 5, E to G, and fig. S6A) and decreased MT acetylation (Fig. 5, H and I) in motoneurons in vivo to a level comparable with the one observed upon expression of Atat1/2 RNAi (Fig. 2, G and H). These results show that disrupting axonal trans-port impairs MT acetylation, a defect that correlates with a lack of mobility of Atat1-enriched vesicles along the axonal MTs.
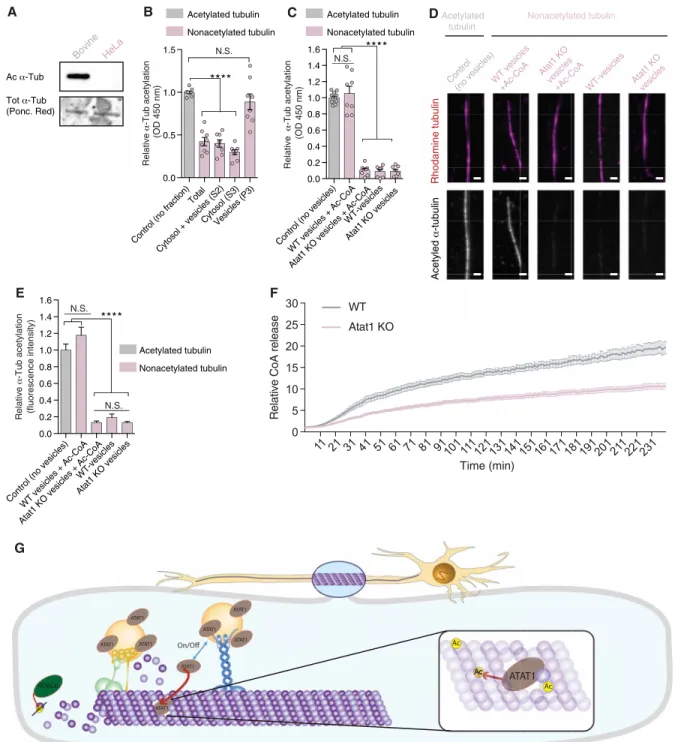
To test whether the vesicular pool of Atat1 promotes the acetyl-ation of -tubulin in MTs, we isolated subcellular fractions from newborn mouse cortices and then assessed their ability to promote the acetylation of nonacetylated MTs isolated from HeLa cells (8), compared with endogenously acetylated bovine brain MTs (control) (Fig. 6A). We observed that most of the MT acetyltransferase activity was detected in the vesicular fraction (Fig. 6B), an activity that was lost in either vesicles isolated from Atat1 KO mice or vesicles incu-bated without acetyl–coenzyme A (CoA), the acetyl group donor for Atat1-dependent MT acetylation (Fig. 6, C to E) (15). Moreover, the vesicular fraction was able to promote the acetylation of MTs over several hours in vitro, as suggested by the strong reduction of CoA release upon incubation with vesicles from Atat1 KO mice, as compared to WT control (Fig. 6F). These findings suggest that the
Fig. 5. Ciliobrevin disrupts -tubulin acetylation and axonal transport in vitro and in vivo. (A to C) Immunolabeled cortical neurons from E14.5 mice embryos treated
with 20 M of ciliobrevin D of control buffer 1 hour before fixation, showing total -tubulin (Tot -tub) and acetylated -tubulin (Ac -tub) in the soma (B) or distal axons (C) of the neurons. Scale bar, 10 m. (D to G) Axonal transport in motoneurons from synaptotagmin-GFP D. melanogaster third-instar larvae fed during 2 hours with 800 M of DMSO (control) or ciliobrevin D before the analysis of average SYT1-GFP vesicle velocity (D), instantaneous velocity (E), run length (F), and pausing time (G). (H and I) Immunolabeled motoneurons from third-instar larvae fed with 800 M of ciliobrevin D 2 hours before sacrifice, showing total -tubulin (Tot -tub) and acetylated -tubulin (Ac -tub). Scale bar,10 m. Description of graphical summaries here within are histograms of means ± SEM; statistical analyses of (B) and (C) are two-tailed t test, while those of (D) to (G) are two-tailed Mann-Whitney. Specifically, [(B) P = 0.0419 and t, df(2.051, 58); (C) P < 0.0001 and U = 699; (D) P < 0.0001 and U = 23,096; (E) P = 0.0005 and U = 3857 and P = 0.0209 and U = 3,293 for anterograde and retrograde, respectively; (F) P = 0.7385 and U = 37,999; (G) P < 0.0001 U = 28,877; and (I) P < 0.0001 and U = 336). The total number of samples analyzed was (B and C) 29 to 50 neurons from four embryos; (D to G) = 116 to 279 SYT1-GFP tracks from 6 to 8 larvae per group; and (I) 37 to 49 neurons from 8 to 10 larvae. *P < 0.05 and ****P < 0.0001.
B C Control Ciliobrevin D A Control Ciliobrevin D 0.0 0.5 1.0 1.5 Acetylated α -tubulin/total tubulin Control Ciliobrevin D H I Ac α -Tub Tot α -Tub Ac α -Tub Tot α -Tub Control Ciliobrevin D 0.0 0.5 1.0 1.5 Acetylated α -tubulin/total tubulin Soma Control Ciliobrevin D 0.0 0.5 1.0 1.5 Acetylated α -tubulin/total tubulin Axon Contrrol Ciliobrevin D −1.0 −0.5 0.0 0.5 1.0
Instant. SYT1-GFP velocity (µm/s)
Control Ciliobrevin D 0 2 4 6 8 10
SYT1-GFP run length (µm)
N.S Control Ciliobrevin D 0 20 40 60
SYT1-GFP pausing time (%)
Control Ciliobrevin D 0.0 0.1 0.2 0.3 0.4 0.5
Av. SYT1-GFP velocity (µm/s)
D
E F G
on January 15, 2020
http://advances.sciencemag.org/
0.0 0.2 0.4 0.6 0.8 1.0 1.2 1.4 1.6 Relative α -Tub acetylation N.S. Total Cyto sol + vesic les (S 2) Cyto sol (S 3) Vesic les (P 3) 0.0 0.5 1.0 1.5 Relative α -Tub acetylation N.S. B A C Ac α-Tub Tot α-Tub (Ponc. Red) Bovine HeLa Contr ol (n o ves icles ) WT-vesicles Atat1 KO v esicle s Atat1 KO vesicles + Ac-C oA WT vesicles + Ac-CoA Acetylated tubulin Nonacetylated tubulin Acetylated tubulin Nonacetylated tubulin Contr ol (n o fra ction ) 0.0 0.2 0.4 0.6 0.8 1.0 1.2 1.4 1.6 Relative α -Tub acetylation N.S. N.S. Acetyled α -tubulin Rhodamine tubulin E D
Control (no vesicles) WT-vesicles Atat1 KO vesicles Atat1 KO vesicles + Ac-CoA WT vesicles + Ac-CoA
Control
(no vesicles) WT-vesicles Atat1 KO vesicles Atat1 KO vesicles +Ac-CoA WT vesicles +Ac-CoA Acetylated tubulin Nonacetylated tubulin Acetylated
tubulin Nonacetylated tubulin
F (fluorescence intensity) (OD 450 nm) (OD 450 nm) G 11 21 31 41 51 61 71 81 91101 111121131141151161171181191201 211221231 0 5 10 15 20 25 30 Time (min)
Relative CoA release
WT Atat1 KO ATAT1 Ac Ac HDAC6 ATAT1 ATAT1 ATAT1 ATAT1 ATAT1 ATAT1 ATAT1 ATAT1 A A A A A A A A Accc Ac Ac Ac A Accccc Ac Ac
Fig. 6. Vesicles predominantly promote -tubulin acetylation via ATAT1. (A) WB analysis of purified tubulin from bovine brain and HeLa cells, showing acetylated
-tubulin (Ac -tub). Ponceau red identified total -tubulin (Tot -tub) on corresponding extracts. (B and C) In vitro enzyme-linked immunosorbent assay (ELISA)–based -tubulin acetylation assay of polymerized nonacetylated MTs from HeLa cells; incubated with subcellular fraction (B); or with vesicular fractions isolated from WT or Atat1 KO mouse brain cortices with acetyl-CoA or vehicle (C). Purified bovine endogenously acetylated MTs served as control. (D and E) -Tubulin acetylation assay of in vitro polymerized nonacetylated MTs from HeLa cells incubated with vesicular fractions (P3) isolated from WT or Atat1 KO mouse brain cortices and acetyl-CoA or vehicle. Purified bovine endogenously acetylated MTs served as control. Fluorescent signal was measured for total -tubulin by using rhodamine dye and for acetylated -tubulin by immunolabeling. Scale bar, 2 m. (F) In vitro -tubulin acetylation assay based on CoA release from acetyl-CoA by incubating vesicles from WT or Atat1 KO mice with polymerized nonacetylated MTs from HeLa cells. (G) Scheme depicting the axonal transport (anterograde and retrograde) of vesicles enriched in ATAT1 at their external surface. The proper acetylation of MTs is linked to the axonal transport of these vesicles and we propose that axonal transport transiently disrupt the MT lattice by creating transient openings through which ATAT1 relocates intralumenally to promote K40 -tubulin acetylation. Description of graphical summaries here within are histograms of means ± SEM, while statistical analyses of (B and C) are one-way ANOVA; (D) is Kruskal-Wallis and (F) is two-way ANOVA. Specifically [(B) P < 0.0001 and F(4,35)=35.56; (C) P < 0.0001 and F(4,38)=158.3; (E) P < 0.0001 and K = 120.8; (F) P < 0.0001 and F(1,3360) = 8113) In addition, post hoc multiple comparisons are Sidak’s tests (B and C): Dunn’s test (D); ****P < 0.0001. The total number of samples analyzed were as follows: (B and C) eight subcellular brain cortical fractions from eight newborn mice; (E) = 29 to 46 MTs, (F) 240 sample points (1/min) of purified vesicles from three WT and three Atat1 KO mouse brain cortices.
on January 15, 2020
http://advances.sciencemag.org/
pool of vesicular Atat1 provides an enzymatic activity that promotes MT acetylation and thereby fast axonal transport (Fig. 6G). DISCUSSION
Here, we show that loss of Atat1(/2), thereby MT acetylation, impairs bidirectional axonal transport in mouse cortical neurons in culture or in organotypic slice as well as in fly larva motoneurons
in vivo, ultimately resulting in locomotor defects in adult flies. Our work revealed the existence of a large pool of functional Atat1 at the external surface of different types of motile vesicles, including lysosomes and precursors of synaptic vesicles. Moreover, blocking MT-dependent transport impaired -tubulin acetylation, further suggesting that Atat1-enriched vesicles have to be transported along MT to promote -tubulin acetylation. Treatment with high concentration of ciliobrevin D (that blocks both retrograde and anterograde transport;
Table 1. List of antibodies and their dilution used for ELISA assays, immunostainings, and/or Western blottings.
Protein Company Cat no. WB IF ELISA
-Tubulin Sigma-Aldrich T9026 1:5000 1:2,000
-Tubulin* DSHB 12G10 1:500
/-Tubulin Cytoskeleton ATN02-A 1:150
Acetylated -tubulin Sigma-Aldrich T7451 1:15,000 1:15,000
Polyglutamylated tubulin AdipoGen AG-25B-0030 1:10,000
Glutamylated tubulin AdipoGen AG-20B-0020 1:10,000
Detyrosinated tubulin Millipore AB3201 1:1,000
∆2-Tubulin Millipore AB3203 1:2,000
Lis1 Santa Cruz Sc-393320 1:100 1:100
ATAT1 Sigma-Aldrich HPA046816 1:2000 1:120
GAPDH Millipore MAB374 1:300
LAMP1 Abcam Ab25630 1:20
Synaptophysin Synaptic Systems 101 004 1:1000
SV2C Synaptic Systems 119 204 1:500
GFP Origene TP401 1:5000
GFP Abcam Ab6673 1:1000
-Actin Sigma-Aldrich A3853 1:20,000
HDAC6 BiotechnologySanta Cruz sc-5258 1:200
GFP Molecular Probes A11122 1:1000
ATAT1 Maxence Nachury 1:1000
CSP** (cystein-string protein) DSHB DCSP-2 (D6D) 1:10
HRP Sigma-Aldrich P97899 1:1,000
FLAG Sigma-Aldrich F3165 1:1,000
Synaptophysin Sigma-Aldrich s5768 1:1,000
Histone H3 cell signaling 9715 1:5,000
Synuclein Abcam ab51252 1:5,000
DIC Millipore MAB1618 1:500
SV2*** DSHB AB 2315387 1:100
-Tubulin cell signaling 2146 1:100
Goat anti mouse ImmunoResearch LabsJackson 115–035-003 1:10,000 1:200 1:5,000 Goat anti rabbit ImmunoResearch LabsJackson 111-035-003 1:10,000 1:200
Donkey anti goat ImmunoResearch LabsJackson 705-035-003 1:10,000
*12G10 anti–-tubulin was deposited to the DSHB by J. Frankel/E.M. Nelsen (DSHB hybridoma product 12G10 anti–-tubulin). **DCSP-2 (6D6) was deposited to the DSHB by S. Benzer [DSHB hybridoma product DCSP-2 (6D6)]. ***SV2 was deposited to the DSHB by K.M. Buckley (DSHB hybridoma product SV2).
on January 15, 2020
http://advances.sciencemag.org/
Fig. 5E) or expression of shLis1 (that blocks retrograde transport; fig. S6E) significantly reduced MT acetylation in the axon, while only ciliobrevin D treatment did so in the soma. This suggests a possible predominant role for the anterograde transport of Atat1-enriched vesicles to promote -tubulin acetylation in the soma, a hypothesis whose validation would require additional experiments.
Increasing MT acetylation has been shown to compensate for axonal transport defects in fly, mouse, and human models (6, 16). However, the role of Atat1 in axonal transport has been debated, since loss of Atat1/MEC17 expression impairs axonal transport in
Caenorhabditis elegans neurons (28) but not in hippocampal and
dorsal root ganglia neurons from adult mice (29). This apparent discrepancy may reflect different contributions of Atat1, thereby MT acetylation to axonal transport in distinct neuronal populations. It is also unexpected that, while acute deletion of Atat1 impairs MT acetylation, neuronal migration, and axon branching in the developing rodent cortex (30), Atat1 KO mice only show mild neurological abnormalities such as increased anxiety and impairments in mecha-nosensation (14, 29). Such discrepancy may reflect a stronger require-ment for Atat1 during developrequire-ment and early life, as suggested by its decreasing expression after birth in the cerebral cortex of both mice (30) and humans (31) (figure S7, 2018 Allen Institute for Cell Science. BrainSpan Atlas of the Developing Human Brain. Available from: brainspan.org/rnaseq/search/index.html).
Recent work performed in vitro has suggested that ATAT1 diffuses in the lumen of MTs where it induces acetylation of -tubulin K40 (12). While the mode of intraluminal relocation of ATAT1 remains controversial (11, 12), we now suggest that motile vesicles bring ATAT1 in close vicinity to MTs, which is in accord with the detection of ATAT1 at the surface of MTs by electronic scanning microscopy (9). Supposing that molecular transport triggers transient MT lattice deformations (32, 33) and disruption (34), one can postulate that locally released vesicular ATAT1 could reach the MT lumen to acetylates -tubulin K40 in vivo via these dynamic lateral openings (35).
The results of our work, together with the observation that vesicular glyceraldehyde-3-phosphate dehydrogenase (GAPDH) activity contrib-utes to local generation of adenosine triphosphate (ATP) for fast-moving vesicles (24), show that vesicles have on-board enzymatic machinery that can act locally and modulate their own transport by changing their molecular environment. Our work suggests, in particular, that in neurons, vesicle-associated enzymes can locally modify MT tracks, thus optimizing axonal transport. Reduced acetylation of MTs also affect their flexibility and thus resistance to physical breakage after repeated mechanical stress (10, 36), and loss of Atat1/MEC17 in C. elegans leads to MT instability and axonal degeneration (28). Therefore, it would be interesting to test whether a reduced vesicular axonal transport, as observed in neurodegenerative diseases (37), might contribute to the neurodegeneration process via curtailing the acetylation of -tubulin, hence leading to a global weakening and breakage of axonal MTs. MATERIALS AND METHODS
Mice
Mice were euthanized and brain cortices were harvested either at P0 to P2 for biochemical analysis or E14.5 for preparation of cortical
neuronal cultures. Atat1+/− mice were used to obtain WT and KO mice
(14). Mice were maintained with access to food and water ad libitum and kept at a constant temperature (19° to 22°C) and humidity (40 to 50%) on a 12:12-hour light/dark cycle according to the guidelines
of the Belgian Ministry of Agriculture and in agreement with the European Community Laboratory Animal Care and Use Regulations (86/609/CEE, Journal Officiel des Communautés Européennes L358, 18 December 1986). All experimental procedures were performed in strict accordance with the recommendations of the European Community (86/609/EEC) for care and use of laboratory animals under the supervision of authorized investigators.
D. melanogaster maintenance and lines
Flies were kept at a 25°C incubator with a 12-hour light and dark cycle. Crosses were performed at 25°C, first-instar larvae were transferred to a 29°C incubator until use. For axonal transport, be-havioral experiments and immunolabeling D42-Gal4-UAS: Syt1-GFP or D42-Gal4 virgin females were crossed with upstream activation sequence (UAS)–RNAi carrying lines. For quantitative polymerase chain reaction (qPCR) analysis, elav-Gal4 females were crossed with UAS-RNAi males. All RNAi inserts sequences were validated by Sanger sequencing.
Drosophila lines were acquired from the Vienna Drosophila Resource Center (VDRC) and the Bloomington Drosophila Stock Center (BDSC). UAS-Syt1:GFP (BDSC 6925), UAS-RNAi Atat1 (VDRC CG3967), UAS-RNAi Atat2 (VDRC CG17003), UAS-RNAi
Hdac6 (BDSC 51181), and UAS-RNAi Zpg (VDRC CG10125) were
used as control. Elav-Gal4 (BDSC 458) or D42-Gal4 (BDSC 8816) flies were used for specific activation of a UAS sequence in postmitotic neurons or motor neurons, respectively. All RNAi insert sequences were validated by Sanger sequencing.
Constructs
BDNF-mCherry was previously used in (24) and ATAT1-GFP (27099), pCALNL-DsRed (13769), and pEGFP -tubulin K40Q (105302) were purchased from Addgene (www.addgene.org/). pEGFP-Tub was ob-tained from Clontech (www.takarabio.com/). pCAG mEmerald- LAMP1 and pCAG mito-DsRED were provided by F. Polleux (Columbia Uni-versity, New York, USA), and pCAG-iCreERT2 was provided by A. Tye (NIMR, UK). pCX-Cre plasmid was designed and provided by X. Morin (Institut de Biologie de l’Ecole Normale Superieure IBENS, France). ATAT1 truncation constructs, FLAG- ATAT1(amino acids 1 to 333), FLAG-ATAT1(amino acids 1 to 286), FLAG-ATAT1(amino acids 1 to 242), and FLAG-ATAT1(amino acids 1 to 196) were synthesized as gBlocks and inserted to a pCIG2 vector. The Atat1 short hairpin RNA (shRNA) sequence was 5′-GCAGCAAATCATGACTATTGT-3′ (30).
Atat1 sequence was inserted in pBS/U6- ploxPneo plasmid (provided
by X. Coumoul). Lis1 shRNA sequence was 5′-GAGATGAACTA-AATCGAGCTA-3′ (38) and was subcloned in pCA-b-EGFPm5 silencer 3, a gift from M. Vermeren (King’s College London, UK). All construct sequences were verified by Sanger sequencing.
Cell lines culture, transfections, and drug treatment
Mouse neuroblastoma N2A cells were cultured in Dulbecco’s modified Eagle’s medium (DMEM) (Gibco) supplemented with 10% fetal calf
serum at 37°C with 5% CO2. To test shAtat1 efficiency, we treated
N2A cells with 4OHT (1 M) 24 and 48 hours after lipofection with Lipofectamine 2000 (Invitrogen), and cell lysis or fixation was performed 48 hours after the first treatment with 4OHT.
Neuronal cell culture
E14.5 mouse brain cortices were dissected and mechanically dissociated in Hanks’ balanced salt solution (HBSS) (Sigma-Aldrich, H6648)
on January 15, 2020
http://advances.sciencemag.org/
supplemented with 1.5% glucose. Cells were cultured at a confluence of ~70% with Neurobasal Medium (Gibco, Invitrogen, 21103049) supplemented with 2% B27 (Gibco, Invitrogen, 17504044), 1% penicillin/ streptomycin (Gibco, Invitrogen, 15140122), and 1% GlutaMAX (Gibco, Invitrogen, 35050061) at 37°C. Nucleofections of E14.5 cortical neurons were performed using Mouse Neuron Nucleofector Kit (VPG-1001, Lonza) according to the manufacturer’s protocol. Human-induced pluripotent stem cell culture
and generation of cortical projection neurons
Human embryonic stem cell research and protocols were approved by the Ethics Committee of the University of Liège (no. B70720096466); all experiments were conducted according to its guidelines. Human- induced pluripotent stem cell (hIPSC) line GM23446 (Coriell Institute) was maintained on Geltrex-coated dishes (Gibco) in DMEM/F12 supplemented with 20% KO serum replacement (Gibco), 100 M nonessential amino acids (NEAA) (Gibco), 100 M 2-mercaptoethanol, and basic fibroblast growth factor (100 ng/ml; PeproTech, London, UK), conditioned on -irradiated mouse embryonic fibroblasts. Cells were passaged routinely with collagenase A (1 mg/ml; Roche).
Generation of human cortical neurons was performed as described in (39). Briefly, hiPSCs were dissociated with TrypLE (Gibco) for 4 min at 37°C and cultured on Geltrex-coated dished in Pluripro medium (Cell Guidance Systems) until they reached confluency. Neural induction was triggered with media making use of dual SMAD inhibition and tankyrase inhibitor to enhance forebrain fate: DMEM/ F12 containing N2 (Gibco), B27 (Gibco), penicillin/streptomycin (1:100; Gibco), glucose (0.8 mg/ml; Carl Roth HN06.2), NEAA, GlutaMAX (Gibco), cyclic adenosine 3′,5′-monophosphate (0.15 ng/ml; Sigma-Aldrich, A9501-1G), 500 nM A83-01 (Miltenyi Biotec, 130-106-274), 200 nM LDN-193189 (Miltenyi Biotec, 130-103-925), and 2 M XAV939 (Enzo Life Sciences, BML-WN100-0005). Medium was changed daily, and cells were passaged at day 8 with 0.5 M EDTA. Cells were maintained until day 18 and replated at a density
of 12,000 cells/cm2 in neural differentiation media containing 1:1
DMEM/F12/Neurobasal, N2, B27, penicillin/streptomycin, glucose (0.8 mg/ml), NEAA, and GlutaMAX. Neural differentiation media were changed every other day, and Geltrex (1:100) was added 4 days before fixation with 4% paraformaldehyde (PFA) at day 32 to prevent detachment of the neurons.
Immunofluorescence
Mouse cerebral cortical neurons, N2A cells, HeLa S3 cells, and human projection neurons derived from hiPSCs were fixed using 4% PFA for 20 min at room temperature (RT) and washed with phosphate- buffered saline (PBS) + 0.3% Triton X-100. Antigen retrieval was performed for nucleofected cerebral cortical neurons using 10 mM sodium citrate (pH 9) for 1 hour at 60°C. After washing, neurons were incubated in blocking solution (PBS + 0.3% Triton X-100 + 10% normal donkey serum) for 1 hour at RT. Following overnight incubation with primary antibodies (Table 1) in blocking solution at 4°C, washing, incubation with secondary antibodies (PBS + 0.3% Triton X-100 + 1% normal donkey serum) at RT for 1 hour, and washing, coverslips were mounted on a microscope slide using Mowiol.
D. melanogaster larvae were dissected in PBS to expose brain and
motor neurons, after dissection larvae were fixed with 4% PFA for 20 min at RT, washed with PBS + 0.2% (CSP staining) or 0.3% (-tubulin acetylation staining) Triton X-100, and incubated in blocking solution PBS and 0.2% (CSP staining) or 0.3% (-tubulin
acetylation staining) Triton X-100 + 1% bovine serum albumin (BSA) for 30 min at RT. Following overnight incubation with primary antibodies at 4°C, washing, and incubation with secondary antibodies at RT for 2 hours, the larvae were mounted on a micro-scope slide using Mowiol. After washing in PBS + 0.3% Triton X-100, samples were incubated in blocking solution (PBS + 5% normal donkey serum + 0.3% Triton X-100) for 1 hour at RT. Following overnight incubation with antibodies at 4°C, washing, and incubation with secondary antibodies at RT for 2 hours, the larvae were mounted on a microscope slide using Mowiol. Images were acquired with a Nikon A1Ti confocal microscope (60× lens) for all analyses, except ATAT1-GFP and BDNF-mCherry staining that was acquired with the Airyscan superresolution module of a Zeiss LSM 880 confocal microscope. HeLa cells were plated at densities of 10,000 for 96-well black-bottom plates. The following day, cells were transfected using calcium phosphate with 0.01 g/96-well plates of ATAT1:IRES-GFP truncated-form plasmids. Twenty-four hours after transfec-tion, cells were fixed using 4% PFA and blocked and permeabilized using PBS + 3% fetal bovine saline (FBS) + 0.1% Triton X-100 for 1 hour. Following overnight incubation with primary [total
/-tubulin (ATN02-A) and acetylated -tubulin (T9026)]
anti-bodies at 4°C, washing, and incubation with secondary antianti-bodies at RT for 2 hours, cells were imaged using an IN Cell 2200 micro-scope (GE Healthcare).
Western blotting
Mouse brain cortices from Atat1 KO mice (20) or HEK293 or N2A cells were homogenized on ice in radioimmunoprecipitation assay buffer or 320 mM sucrose, 4 mM Hepes buffer for subcellular fractions, with protease inhibitor cocktail (Roche, P8340 or Sigma- Aldrich, S8820) and 5 M trichostatin A (Sigma-Aldrich, T8552). Subsequently, samples were boiled and reduced by 5 min of incubation at 70°C with loading buffer and were loaded on SDS–polyacrylamide gel electrophoresis gel to be finally transferred to a nitrocellulose membrane. For -tubulin acetylation analysis, 2 g of protein lysate was loaded on a gel; for analysis of all other proteins, 30 g of lysate was used. Membranes were imaged using Amersham Imager 600 (General Electric, 29083461), and band densitometry was measured using ImageJ.
Subcellular fractionation
Subcellular fractionation of a frozen mouse brain cortex or cultured HEK293 cells was performed as previously described (24).
MS analysis
All chemicals were purchased from Sigma-Aldrich unless stated otherwise. Pellets from three independent samples of vesicles isolated from the brain cortex of WT or Atat1 KO mice were solubilized using 5% SDS. Samples were then loaded onto the commercial S-Trap columns (ProtiFi, USA); for washing the detergents, reduction with 5 mM dithiothreitol (DTT), 10 mM iodoacetamide, and overnight digestion with trypsin (Promega) at 50:1 protein:trypsin ratio. Eluted peptides were dried using a vacuum centrifuge and stored in −80°C. Ultra LC/MS grade solvents were used for all chromatographic steps. Each sample was loaded using splitless nano ultraperformance LC (UPLC) (10 kpsi nanoACQUITY; Waters Corporation, Milford, MA,
USA). The mobile phase was as follows: (A) H2O + 0.1% formic
acid and (B) acetonitrile + 0.1% formic acid. Desalting of the sam-ples was performed online using a Reversed-Phase Symmetry C18 trapping column (internal diameter of 180 m, 20 mm in length,
on January 15, 2020
http://advances.sciencemag.org/
and 5 m particle size; Waters Corporation). The peptides were then separated using a T3 High Strength Silica nanocolumn (internal diameter of 75 m, 250 mm in length, and 1.8-m particle size; Waters Corporation) at 0.35 l/min. Peptides were eluted from the column into the mass spectrometer using the following gradient: 4 to 30% B in 155 minutes, 30 to 90% B in 5 min, maintained at 90% for 5 min, and then back to initial conditions. The nanoUPLC was coupled online through a nanoelectrospray ionization emitter (10-m tip; New Objec-tive, Woburn, MA, USA) to a quadrupole orbitrap mass spectrometer (Q Exactive Plus, Thermo Fisher Scientific), using a FlexIon nano-spray apparatus (Proxeon). Data were acquired in a data-dependent acquisition mode, using a top 10 method. MS1 resolution was set to 70,000 [at 200 mass/charge ratio (m/z)], mass range of 300 to 1650 m/z, and AGC of 3e6, and maximum injection time was set to 60 ms. MS2 resolution was set to 17,500, quadrupole isolation 1.7 m/z, AGC of 1e5, dynamic exclusion of 60 s, and maximum injection time of 60 ms. Raw data were processed with MaxQuant v1.6.0.16. The data were searched with the Andromeda search engine against the SwisssProt human proteome database appended with common lab protein con-taminants and the following modifications: carbamidomethyl on C and oxidation of M. Quantification was based on the Label-free quan-titation method, based on unique peptides. t test with the Holm-Sidak method for multiple comparison was used for determination of sta-tistical significance after logarithmic transformation. GO data analysis of the differentially detected proteins was done using GOrilla tool (40) (http://cbl-gorilla.cs.technion.ac.il), using two ranked lists and
a P value of 10 × 10−3 as threshold.
Proteinase K sensitivity assay
Proteinase K sensitivity assay was performed as previously described (26). Fifty micrograms of vesicles (P3) were incubated with increasing concentration of proteinase K to reach a final concentration of 0, 0.05, 0.25, 1.25, and 6.25 g/l in digestion buffer (10 mM Hepes, 10 mM KCL, 2 mM EGTA, and 300 mM sucrose) in a total volume of 50 l, for 30 min at 37°C. To end the reactions, 5 mM phenylmethylsulfonyl fluoride (PMSF) with Laemmli buffer, followed by immediate boiling and reduction of the samples in 95°C for 5 min.
Microfluidics device fabrication and axonal transport recordings in mice cortical neurons and Drosophila third-instar larvae
Microfluidics devices were prepared as described in (41). Axonal transport recording was performed after 5 DIV, as previously described (16), using an inverted confocal microscope (Nikon, A1Ti), at a 600-ms interval for 60 s using 60× lens. For cell culture, the recording
microscope chamber was heated at 37°C and supplied with 5% CO2.
Locomotor activity and climbing assay
Larval locomotion assays were performed by placing third-instar
D. melanogaster larvae in the center of 15-cm petri dishes coated
with 3% agar (42). Millimeter paper was glued below each 15-cm petri dish to quantify distance traveled. Crawling speed was extrapolated from distance traveled in 1 min; peristaltic activity was defined as complete posteroanterior contraction of the larvae in 1 min. Climbing assay for adult flies was performed as previously described in (43). Ten flies per group were allowed to climb an empty polystyrene tube for 1 min in three sequential assays. Climbing index was defined as average ratio successful climbs over 15 cm of the total number of flies in a group.
Lysosome transport analysis in organotypic slice
Mice purchased from Janvier were anesthetized with isoflurane (Abbott Laboratories) in an oxygen carrier before the administration of temgesic (Schering-Plough). Endotoxin-free plasmids were injected into lateral ventricles of E14.5 mouse embryo forebrains using a FemtoJet microinjector (Eppendorf) with 0.1% fast green for visual-ization. Injection was followed by electroporation (5 pulses of 24 mV at 50-ms intervals for 950 ms) using platinum electrodes (Sonidel, catalog no. CUY650P3) connected to an electroporator (ECM 830, BTX). Embryos were coelectroporated with tamoxifen-inducible CreERT2 expressing plasmid along with two Cre-dependent constructs expressing DsRed and shAtat1/sh-scrambled and with LAMP1-Emerald– expressing plasmid. After electroporation, embryos were placed back in the abdominal cavity. For injection, 4OHT and progesterone were dissolved in ethanol 100% at concentrations of 20 and 10 mg/ml, respectively, and then diluted with nine volumes of corn oil (Sigma- Aldrich). Diluted tamoxifen solution (2 mg/ml, 100 l per mouse) was intraperitoneally injected three times at E17, E18, and P1, and pups brains were dissected at P2. Brains were embedded in agarose 4% HBSS solution and cut into coronal sections (300 m) using a vibratome (Leica VT1000S, Leica Microsystems). The slices were placed on Matrigel-coated (Corning) MatTek glass-bottom dishes and covered with half-diluted Matrigel with supplemented Neuro-basal culture medium. Sections were incubated for 30 min at 37°C before imaging. Time-lapse imaging was performed on a Zeiss Super Resolution LSM 880 Airyscan Elyra S1 (×63 magnification) at a 500-ms interval for 60 s at the corpus callosum midline. The re-coding microscope chamber was heated at 37°C and supplied with
5% CO2.
qPCR analysis
Ten adult fly heads were collected in TRIzol Reagent (Ambion, Life Technologies), followed by RNA extraction performed using the manufacturer’s instructions. After deoxyribonuclease treatment (Roche), 1 g of RNA was reverse-transcribed with RevertAid Reverse Transcriptase (Fermentas). qPCR was performed using a LightCycler 480 (Roche), with SYBR Green mix according to the
manufacturer’s instructions (Roche). Analysis was done using 2-CT
method after defining primer efficiencies, Rpl13 and Pgk served for normalization (44). The following primers were used: Rpl13, AGGAG-GCGCAAGAAATC (forward) and CTTGCTGCGGTACTCCTT-GAG (reverse); Pgk, TCCTGAAGGTCCTCAACAACATG (forward) and TCCACCAGTTTCTCGACGATCT (reverse); Atat1, CAGTC-CCGCACGCTGACGAG (forward) and ACGCGCATGGTGGAG-CAGAC (reverse); Atat2, TCCCAAGTCAAGGGAGACAC (forward) and TGCGGAAAGAGGTGCTTAAT (reverse); and Hdac6, CAAG-CCCAAAGTCAAGCACT (forward) and ACCCAGTTCTCCCCCGTC (reverse).
Ciliobrevin treatment
Drug treatments of cortical neuronal cultures were performed using 20 M (Sigma-Aldrich 250401) diluted in dimethyl sulfoxide (DMSO) for 2 hours. For third-instar larva, drugs were fed in 10% sucrose solution supplemented with either 1 mM TBA (Sigma- Aldrich, SML0044) or 800 M Ciliobrevin D and DMSO for 30 min and 2 hours, respectively.
Purification of tubulin from mouse brains or HeLa cells Nonacetylated -tubulin was obtained from HeLa S3 cells (American Type Culture Collection, CCL-2.2TM) for in vitro acetylation assays
on January 15, 2020
http://advances.sciencemag.org/