Publisher’s version / Version de l'éditeur:
PERD/CHC Report 26-195, 1999-04
READ THESE TERMS AND CONDITIONS CAREFULLY BEFORE USING THIS WEBSITE.
https://nrc-publications.canada.ca/eng/copyright
Vous avez des questions? Nous pouvons vous aider. Pour communiquer directement avec un auteur, consultez la première page de la revue dans laquelle son article a été publié afin de trouver ses coordonnées. Si vous n’arrivez pas à les repérer, communiquez avec nous à [email protected].
Questions? Contact the NRC Publications Archive team at
[email protected]. If you wish to email the authors directly, please see the first page of the publication for their contact information.
Archives des publications du CNRC
For the publisher’s version, please access the DOI link below./ Pour consulter la version de l’éditeur, utilisez le lien DOI ci-dessous.
https://doi.org/10.4224/12328046
Access and use of this website and the material on it are subject to the Terms and Conditions set forth at
Evaluation of Ice Model Test Data for Moored Structures
Comfort, G.; Singh, Shane; Spencer, D.
https://publications-cnrc.canada.ca/fra/droits
L’accès à ce site Web et l’utilisation de son contenu sont assujettis aux conditions présentées dans le site LISEZ CES CONDITIONS ATTENTIVEMENT AVANT D’UTILISER CE SITE WEB.
NRC Publications Record / Notice d'Archives des publications de CNRC:
https://nrc-publications.canada.ca/eng/view/object/?id=5f583439-0ad3-4a39-b3a2-c1b678443222 https://publications-cnrc.canada.ca/fra/voir/objet/?id=5f583439-0ad3-4a39-b3a2-c1b678443222
EVALUATION OF ICE MODEL TEST DATA FOR
MOORED STRUCTURES G. Comfort S. Singh D. Spencer Submitted to: Attn. : Dr. G. Timco Canadian Hydraulics Centre
National Research Council Montreal Road Ottawa, Ontario K1A OR6 April, 1999
PERD/CHC Report 26-195
Submitted by : Fleet Technology Limited311 Legget Drive Kanata, Ontario
K2K 1Z8
in association with : Marineering Ltd. 1151 Topsail Rd. Mt. Pearl, Nfld.
ACKNOWLEDGEMENTS
The following companies are thanked for releasing test data and reports for use in this study, as follows :
• Petro-Canada and the Terra Nova Alliance – contributed test data collected by the IMD with the Terra Nova FPSO
• BHP Petroleum Ltd. – contributed test data collected by MARC with the Prirazlomnoye SPM and Tanker
• Aker Engineering A/S – contributed test data collected by ARCTEC Canada Ltd. with the Aker D-6 Semi-Submersible
• Mobil Oil Canada Ltd. – contributed test data collected by ARCTEC Canada Ltd. and ARCTEC Incorporated with the Semi-Submersible Production and Storage Vessel
• Exxon Production Research Co. - contributed test data collected by ARCTEC Incorporated with a Turret-Moored Icebreaking Drillship
• SEDCO - contributed test data collected by ARCTEC Incorporated with the SEDCO 500 Turret-Moored Icebreaking Drillship
• Petro-Canada Exploration Ltd - contributed test data collected by ARCTEC Canada Ltd. with a Dypospar Loading Terminal and a Tanker
• ARCO Oil and Gas Company - contributed test data collected by ARCTEC Canada Ltd. with a turret-moored icebreaking drillship
EXECUTIVE SUMMARY
Summary and Conclusions - Usually systems intended to operate in marginal ice zones, such
as Canada’s Grand Banks region, are designed to be disconnected and moved offstation should the ice conditions become too severe. The ice conditions, which often consist of pack ice in this environment, can thus have an important effect on the stationkeeping abilities of the structure, and on the overall economics of the operation.
An extensive set of ice model test data has been assembled for floating, moored structures, which are the preferred option for this type of operation. The primary focus of the work was to present the data in a common format to identify overall trends, and to make basic comparisons. The results were sub-divided by structure type : (a) the Kulluk ; (b) semisubmersibles ; (c) turret-moored drillships or tankers without an exposed loading terminal ; and (d) moored tankers and loading terminals. The results presented have also been grouped for (a) ambient ice (or sheet ice) and (b) managed ice (or broken ice).
All of the test data in MANAGED ICE show that the pack ice concentration is the most important factor. The loads rise rapidly at ice concentrations greater than about 8/10. The loads increase slightly with ice thickness, and they are not very dependent on speed.
The test data in AMBIENT ICE for the Kulluk show that the load increases with ice thickness and speed. The ACL tests produced higher loads by a factor of about 3 to 5 than the test results at HSVA or IIHR. The reasons for this variation are not clear.
The semisubmersible model test data have been compared based on the load per unit “beam” (where the “beam” is defined as the projected width of the semisubmersible facing the ice). The ice loads are greatly affected by how well ice is able to pass through the semisubmersible, versus jamming inside it. The benefits of adding cones to the column legs to break the ice efficiently are greatly reduced if the ice jams.
The line loads from the various test programs agree within a factor of about 2.
The turret-moored drillship model test data have also been compared based on the load per unit “beam” (where the “beam” is defined as the projected width of the vessel facing the ice). A change in heading produces much higher line loads than those at 0°. This reflects the fact that the ice contacts the ship’s parallel mid-body, which is a less-efficient icebreaking shape than the bow.
The tanker and loading terminal model test data are most difficult to compare because the ice interaction is affected by both the terminal and the tanker. The relation between the terminal size and the tanker beam is the most important factor affecting the loads produced. A large terminal “shields” the tanker whereas a narrow one causes the tanker to be exposed to the moving ice.
TABLE OF CONTENTS
Page
1.0 INTRODUCTION AND OBJECTIVES 1
2.0 AVAILABLE DATABASE AND GENERAL APPROACH 2
2.1 The Available Information 2
2.2 The Ice Condition Categories 2
3.0 TESTS WITH THE KULLUK 4
3.1 The Available Information 4
3.2 Managed Ice Tests 5
3.3 Ambient Ice Tests 15
4.0 TESTS WITH SEMI-SUBMERSIBLES 29
4.1 Available Information 29
4.2 Managed Ice Tests 30
4.3 Ambient Ice Tests 38
5.0 TURRET-MOORED DRILLSHIPS AND TANKERS 43
5.1 Available Information 43
5.2 Managed Ice Tests 43
5.3 Ambient Ice Tests 46
6.0 MOORED TANKERS AND LOADING TERMINALS 54
6.1 Available Information 54
6.2 Managed Ice Tests 54
6.3 Ambient Ice Tests 57
7.0 ANALYSES USING NON-DIMENSIONAL PARAMETER GROUPINGS 66
8.0 CONCLUSIONS AND RECOMMENDATIONS 69
8.1 Conclusions 69
8.2 Recommendations 71
LIST OF FIGURES
Figure 3.1 Effect of Test Procedure (Ice Pushed vs Model Towed) on the Peak Mooring Forces : Rubble Ice Test Results for the Kulluk
Figure 3.2 Effect of Test Procedure (Ice Pushed vs Model Towed) on the Mean Mooring Forces : Rubble Ice Test Results for the Kulluk
Figure 3.3 Effect of Air Bubbler on the Peak Mooring Forces Measured During the ACL Tests : Rubble Ice Test Results for the Kulluk
Figure 3.4 Effect of Air Bubbler on the Mean Mooring Forces Measured During the ACL Tests : Rubble Ice Test Results for the Kulluk
Figure 3.5 Effect of Model Compliance on the Peak Mooring Forces Measured During the 1985 IIHR Tests : Rubble Ice Test Results for the Kulluk
Figure 3.6 Effect of Ice Concentration : Mean Mooring Forces Measured During Broken Ice and Rubble Ice Tests Conducted With The Kulluk
Figure 3.7 Effect of Ice Concentration : Peak Mooring Forces Measured During Broken Ice and Rubble Ice Tests Conducted With The Kulluk
Figure 3.8 Effect of Ice Thickness : Peak Mooring Forces Measured During the ACL and HSVA Tests Conducted in 9+/10 Broken Ice Tests With The Kulluk
Figure 3.9 Effect of Ice Thickness : Mean Mooring Forces Measured During the ACL and HSVA Tests Conducted in 9+/10 Broken Ice Tests With The Kulluk
Figure 3.10 Effect of Ice Thickness : Peak Mooring Forces Measured During the 1985 IIHR Tests Conducted in 9+/10 Rubble Ice With The Kulluk
Figure 3.11 Effect of Ice Thickness : Peak Mooring Forces During the 1988 IIHR Tests Conducted in 9+/10 Rubble Ice With The Kulluk Model Towed
Figure 3.12 Effect of Ice Thickness : Peak Mooring Forces During the 1988 IIHR Tests Conducted in 9+/10 Rubble Ice With The Ice Sheet Pushed
Figure 3.13 Effect of Ice Thickness : Mean Mooring Forces During the 1988 IIHR Tests Conducted in 9+/10 Rubble Ice With The Kulluk Model Towed
Figure 3.14 Effect of Ice Thickness : Mean Mooring Forces During the 1988 IIHR Tests Conducted in 9+/10 Rubble Ice With The Ice Sheet Pushed
Figure 3.15 Effect of Air Bubbler on The Sheet Ice Loads Measured During the ACL Tests Conducted With the Kulluk
Figure 3.16 Effect of Test Technique (Rigidly-Attached vs Moored Model) : Mean and Peak Sheet Ice Loads During the ACL Tests Conducted With the Kulluk
Figure 3.17 Effect of Test Technique (Rigidly-Attached vs Moored Model) : Mean and Peak Sheet Ice Loads During the 1985 IIHR Tests With the Kulluk
Figure 3.18 Effect of Test Technique (Rigidly-Attached vs Compliant Model) : Mean Sheet Ice Loads During the 1988 IIHR Tests With the Kulluk
Figure 3.19 Effect of Test Technique (Rigidly-Attached vs Compliant Model) : Peak Sheet Ice Loads During the 1988 IIHR Tests With the Kulluk
Figure 3.20 Effect of Ice Thickness on Peak Loads for Low Ice Velocities Figure 3.21 Effect of Ice Thickness on Peak Loads for High Ice Velocities
LIST OF FIGURES (Cont’d)
Figure 3.22 Effect of Ice Thickness on Mean Loads for Low Ice Velocities Figure 3.23 Effect of Ice Thickness on Mean Loads for High Ice Velocities Figure 3.24 Effect of Ice Drift Speed on Peak Loads for Low Ice Thicknesses Figure 3.25 Effect of Ice Drift Speed on Peak Loads for High Ice Thicknesses Figure 3.26 Effect of Ice Drift Speed on Mean Loads for Low Ice Thicknesses Figure 3.27 Effect of Ice Drift Speed on Mean Loads for High Ice Thicknesses
Figure 3.28 Comparison : Peak Loads Measured in Sheet Ice and Broken Ice During Tests With the Kulluk at HSVA
Figure 3.29 Comparison : Peak Loads Measured in Sheet Ice and Broken Ice During Tests With the Kulluk at ACL
Figure 3.30 Comparison : Mean Loads Measured in Sheet Ice and Broken Ice During Tests With the Kulluk at ACL
Figure 3.31 Comparison : Mean and Peak Loads Measured in Sheet Ice and Broken Ice During the 1985 Tests With the Kulluk at the IIHR
Figure 3.32 Comparison : Peak Loads Measured in Sheet Ice and Rubble Ice During the 1988 Tests With the Kulluk at the IIHR
Figure 3.33 Comparison : Mean Loads Measured in Sheet Ice and Rubble Ice During the 1988 Tests With the Kulluk at the IIHR
Figure 4.1 Peak Line Loads During Generic Tests With Semisubmersible Columns in Managed Ice (Noble and Singh, 1982)
Figure 4.2 Line Loads During Tests With the Mobil SPSV in Managed Ice (Szeto et al, 1987a;b)
Figure 4.3 Mean Line Loads Measured During Tests With the Nekton 8000 in Managed Ice : Model Moored to the Carriage and Towed Through the Ice Pack (Williams, 1989)
Figure 4.4 Mean Line Loads Measured During Tests With the Nekton 8000 in Managed Ice :Model Fixed to the Carriage Without a Mooring and Towed Through the Pack Ice (Williams, 1989
Figure 4.5 Peak Line Loads Measured During Tests With the Nekton 8000 in Managed Ice :Model Fixed to the Carriage Without a Mooring and Towed Through the Pack Ice (Williams, 1989)
Figure 4.6 Mean Line Loads During Tests With the Mobil SPSV in Managed Ice (Free et al, 1985)
Figure 4.7 Peak Line Loads During Tests With the Mobil SPSV in Managed Ice (Free et al, 1985)
Figure 4.8 Mean Line Loads on the Nekton 8000 Semisubmersible in Sheet Ice:
Structure Fixed to Carriage Without a Mooring And Towed Through the Ice Sheet (Williams, 1989)
Figure 4.9 Peak Line Loads on the Nekton 8000 Semisubmersible in Sheet Ice:
Structure Fixed to Carriage Without a Mooring And Towed Through the Ice Sheet (Williams, 1989)
LIST OF FIGURES (continued)
Figure 4.10 Peak Line Loads on the Aker D-6 Semisubmersible in Sheet Ice:
Structure Moored to Basin Floor And Ice Sheet Pushed Against It (Comfort and Ritch, 1986)
Figure 4.11 Mean Line Loads on the Mobil SPSV in Sheet Ice: Structure Moored to Basin Floor And Ice Sheet Pushed Against It (Free et al, 1985) Figure 4.12 Peak Line Loads on the Mobil SPSV in Sheet Ice: Structure Moored
to Basin Floor And Ice Sheet Pushed Against It (Free et al, 1985)
Figure 5.1 Resistance Test Results - Peak Line Loads on the Terra Nova FPSO at 0° Heading in Managed Ice : 1.0 m Ice Thickness
Figure 5.2 Resistance Test Results - Peak Line Loads on the Terra Nova FPSO at 0° Heading in Managed Ice : 0.64 m Ice Thickness
Figure 5.3 Resistance Test Results - Peak Line Loads on the Terra Nova FPSO at 0° Heading in Managed Ice : 0.38 m Ice Thickness
Figure 5.4 Resistance Test Results - Mean Line Loads on the Terra Nova FPSO at 0° Heading in Managed Ice : 1.0 m Ice Thickness
Figure 5.5 Resistance Test Results - Mean Line Loads on the Terra Nova FPSO at 0° Heading in Managed Ice : 0.64 m Ice Thickness
Figure 5.6 Resistance Test Results - Mean Line Loads on the Terra Nova FPSO at 0° Heading in Managed Ice : 0.38 m Ice Thickness
Figure 5.7 Rotation Test Results – Mean Line Loads on the Terra Nova FPSO
Figure 5.8 Rotation Test Results – Mean Total Mooring Forces on the Terra Nova FPSO Figure 5.9 CANMAR Drillship Protection Tests in Managed Ice
Figure 5.10 CANMAR Drillship Protection Tests in Managed Ice Figure 5.11 SEDCO 500 Turret-Moored Drillship Tests in Ambient Ice Figure 5.12 Exxon Turret-Moored Icebreaking Drillship Tests in Ambient Ice Figure 6.1 Offshore Loading Terminal Tests (Danielewicz et al, 1995) :
Vaning Tests Simulating a 90° Heading Change
Figure 6.2 Offshore Loading Terminal Tests (Danielewicz et al, 1995) : Change of Direction Tests
Figure 6.3 Tests with the BHP Tanker and SPM Loading System
in 9/10 Managed Ice with 20-30 m Floes (Wilkman et al, 1996) Figure 6.4 Tests with the BHP Tanker and SPM Loading System
in 9/10 Managed Ice with 60-70 m Floes (Wilkman et al, 1996) Figure 6.5 Vaning Tests with the BHP Tanker and SPM Loading System
in Managed Ice (Wilkman et al, 1996)
Figure 6.6 Change-of-Heading Tests with the BHP Tanker and SPM Loading System in Managed Ice: Ice Floes and a Pre-Cut Channel (Wilkman et al, 1996)
LIST OF FIGURES (Cont’d)
Figure 6.7 Tests with the BHP Tanker and SPM Loading System in Managed Ice : a Narrow Channel Cut in Sheet Ice (Wilkman et al, 1996)
Figure 6.8 Tests with the Total Eastcan Tanker and Dypospar Loading System in 10/10 Managed Ice (Noble et al, 1979)
Figure 6.9 Tests with the Total Eastcan Tanker and Dypospar Loading System in Ambient Ice (Noble et al, 1979)
Figure 7.1 Non-Dimensional Analyses of the Terra Nova FPSO Test Results in Broken, Managed Ice (taken from Colbourne, 1998) :
Mean Pack Ice Resistances
Figure 7.2 Non-Dimensional Analyses of the Terra Nova FPSO Test Results in Broken, Managed Ice (taken from Colbourne, 1998) :
Peak Pack Ice Resistances
Figure 7.3 Non-Dimensional Analyses of the Kulluk Test Results in Broken, Managed Ice : Mean Mooring Forces
Figure 7.4 Non-Dimensional Analyses of the Kulluk Test Results in Broken, Managed Ice : Peak Mooring Forces
LIST OF TABLES
Table 2.1 Moored Vessel Stationkeeping In Ice : Summary of Ice Model Test Programs
Table 3.1 Summary : Information Available for the Kulluk in Ambient Ice Table 3.2 Summary : Information Available for the Kulluk in Managed Ice
Table 3.3 Base Case Used for Comparisons for the Managed Ice Tests Table 3.4 Base Case Used for Comparisons for the Ambient Ice Tests
Table 4.1 The Available Semisubmersible Database Table 5.1 Turret-Moored Drillship Model Tests :
Summary of the Available Data
1.0 INTRODUCTION AND OBJECTIVES
Ice can be one of the design constraints for floating production or drilling structures intended to operate in northern waters. The severity of the problems caused by ice depend on the ice
conditions, the structure under consideration and its intended purpose, and the operating approach (e.g., seasonal operations vs year-round operations).
Usually systems intended to operate in marginal ice zones, such as Canada’s Grand Banks region, are designed to be disconnected and moved offstation should the ice conditions become too severe. Floating or moored structures are the preferred option for this type of operation. Hence, the ice conditions, which usually consist of pack ice in this environment, can have an important effect on the stationkeeping abilities of the structure, and on the overall economics of the operation.
Physical model tests are one method that has been used to evaluate the expected performance of various alternative structures in different ice conditions. Tests have been conducted for a wide range of structures and ice conditions, which has resulted in a relatively extensive database of model test information.
However, the available information base is fragmented because each model test program was undertaken to meet specific objectives (e.g., to evaluate an individual structure(s) under specific ice conditions). Furthermore, the tests were sponsored by many different clients and conducted by a number of different testing organizations which used different ice modelling methods.
This makes it difficult to infer overall trends regarding model test results.
The work in this project was focussed on floating production or drilling structures. The objectives of this project were to :
(a) assemble as much ice model test data as possible for floating production or drilling structures. Publicly-available data were used as appropriate. The information base was augmented by data from several proprietary test programs, that was released to this project by their respective clients.
(b) examine the overall data set for trends, and to infer conclusions regarding model test results.
It should be noted that a separate project was initiated at the same time by the PERD Program to assemble the available relevant full scale data. Communications were made throughout this project with the project team carrying out the full scale work, in an effort to coordinate the two studies as much as possible.
2.0 AVAILABLE INFORMATION AND GENERAL APPROACH 2.1 The Available Information
It was obvious that the wide range of structure types tested to date necessitated that the test data be divided into categories. The following ones were used :
(a) the Kulluk – the Kulluk is a round, conical-shaped moored platform that was used for exploratory drilling in the Canadian Beaufort Sea (Loh and Stamberg, 1984). It was placed in a special category for a number of reasons. Most importantly, full scale data are available for it, and thus, this will facilitate subsequent model scale-full scale comparisons. Also, it has been extensively tested at model scale (by three organizations), and thus a greater quantity of model scale data are available for it, compared to the other structures. (b) Semisubmersibles – this category was set up because semisubmersibles have a unique
shape that affects their interaction with ice.
(c) Turret-moored drillships or loading tankers – the unique aspects of this category are that these are ship-shaped structures that are intended to vane when contacted by ice. Also, for this class, there are no other structures exposed to the ice. For this reason, vessels with a Submerged Loading Turret (STL) were included in this category.
(d) Moored tankers in combination with an exposed loading terminal – this category includes structures such as a loading tanker and a Single Point Mooring (SPM). They require a special class because their ice interaction is affected by the SPM as well as the tanker. The information available to the study for each category is summarized in Table 2.1.
2.2 The Ice Condition Categories
The test data were divided into the following ice condition categories to follow the same convention being used by the group analyzing the available full scale data :
(a) Ambient Ice – this condition refers to the case where no ice management has taken place. The model test data used for this case were obtained by testing intact ice sheets that were either pushed against the model, or alternatively, through which the model was towed. (b) Managed Ice – this condition refers to the case where the ambient ice has been broken up,
(e.g., by icebreakers and/or supply ships). In the model test programs, this ice condition was represented by testing a field of individual ice pieces with various sizes (typically termed broken ice), or by preparing accumulations of small ice pieces of various thickness (termed rubble ice).
Table 2.1 Moored Vessel Stationkeeping In Ice : Summary of Ice Model Test Programs
Category Vessel Description Test Organiz. & References
KULLUK Kulluk ACL - Comfort et al, 1982
Kulluk HSVA - Evers et al, 1983 ; Schwarz
et al, 1982 ; Wessels, 1982
Kulluk IIHR(1985)–Matsuishi et al, 1985a,b
Kulluk IIHR(1988) - Nixon et al, 1988 a,b
Semisubmersibles Aker D-6 ACL - Comfort et al, 1986
Generic Study - Column legs ACL - Noble and Singh, 1982
Mobil SPSV AI - Free et al, 1985
Mobil SPSV IMD - Szeto et al, 1987a;b
Nekton 8000 IMD - Williams, 1989
Turret-Moored Drillships or
CANMAR drillship & CANMAR drilling barge
ACL – Allan, 1978; Allan, 1979 ; Noble, 1978 ; Daley ; 1979
Tankers Without ARCO Drillship ACL – Coburn et al, 1980
An Exposed Sedco 500 Drillship AI – Zahn et al, 1983
Terminal Exxon Drillship AI – Zahn et al, 1984
Terra Nova FPSO IMD – Colbourne, 1998
STL/STP system HSVA – Loset et al, 1997
Moored tankers & Total Eastcan Dypospar ACL – Noble et al, 1979 loading terminals Technomare BALM system MARC – Di Tella et al, 1997
BHP SPM Structure MARC – Wilkman et al, 1996
Tanker Loading Study IMD – Danielewicz et al, 1995 Notes :
1. Legend ACL ARCTEC Canada Limited
AI ARCTEC Incorporated
HSVA Hamburg Ship Model Basin (German acronym) IIHR Iowa Institute of Hydraulic Research
(associated with the University of Iowa) IMD Institute for Marine Dynamics
(part of the National Research Council of Canada)
3.0 TESTS WITH THE KULLUK 3.1 The Available Information
The available information for ambient and managed ice conditions is summarized in Tables 3.1 and 3.2, respectively.
Table 3.1 Summary : Information Available for the Kulluk in Ambient Ice
Organiz. Model Model Ice Test Approach
& Reference Scale Material Ice Pushed or
Model Towed ?
Model Compliant or Fixed ?
Air Bubbler Included ?
ACL – 1:30 MOD-ICE ice pushed moored no
Comfort et 1:30 MOD-ICE ice pushed moored yes
al, 1982 1:30 MOD-ICE ice pushed Fixed no
HSVA 1:45 Saline ice model towed moored no
IIHR(1985)- 1:45 Urea ice ice pushed fixed no
Matsuishi et al, 1985 a,b
1:45 Urea ice ice pushed Compliant- leaf
spring used
no
IIHR(1988)-Nixon et al,
1:45 Urea ice ice pushed leaf spring - 2
stiffnesses tested
no
1988 a,b 1:45 Urea ice ice pushed fixed no
Table 3.2 Summary : Information Available for the Kulluk in Managed Ice
Organiz. Model Model Ice Test Approach
& Reference Scale Material Ice Pushed or
Model Towed ?
Model Compliant or Fixed ?
Air Bubbler Included ?
ACL – 1:30 MOD-ICE ice pushed moored no
Comfort et 1:30 MOD-ICE ice pushed moored yes
al, 1982 1:30 MOD-ICE ice pushed Fixed no
HSVA 1:45 Saline ice model towed moored no
IIHR(1985)- 1:45 Urea ice ice pushed fixed no
Matsuishi et al, 1985 a,b
1:45 Urea ice ice pushed Compliant- leaf
spring used
no
IIHR(1988)-Nixon et al,
1:45 Urea ice model towed leaf spring- 2
stiffnesses tested
no
1988 a,b 1:45 Urea ice ice pushed leaf spring- 2
stiffnesses tested
no
Results from the ACL tests are presented in Comfort et al, 1982 in full scale values that were obtained using Froude scaling.
The HSVA test results in the respective reports are also presented in full scale units. However, the scaling technique used by HSVA differed from ACL’s, and it was based on similitude established with both the Froude and the Cauchy numbers.
The IIHR test results in the respective reports are presented in model scale units. These were converted to full scale for use in this project by FTL using Froude scaling.
3.2 Managed Ice Tests
3.2.1 Effect of Test Technique Variations
Table 3.2 shows that several test techniques were used. The effect of these different techniques was investigated first before making comparisons among the individual test programs. The results are summarized below :
(a) Effect of Pushing the Ice Sheet vs Towing the Model – The 1988 IIHR tests are the only ones where both test approaches were used. Lower mean and peak mooring forces were measured when the model was towed (Figures 3.1 and 3.2).
(b) Effect of the Air Bubbler – Figures 3.3 and 3.4 show the peak and mean mooring forces, respectively, measured during the ACL tests with and without the air bubbler. The mean and peak forces measured without the air bubbler were both similar to those with the air bubbler in operation, indicating that the air bubbler made no significant difference. (c) Effect of a Rigid Stationary Structure vs a Compliant Stationary Structure – Figure 3.5
compares the peak mooring forces measured for both configurations during the 1988 IIHR tests. The peak mooring forces were consistently higher for the compliant stationary structure.
3.2.2 Base Case Used for Comparisons
The base cases used for subsequent comparisons among the test programs (Table 3.3) were selected to most closely simulate the field conditions, as follows :
(a) air bubbler – the Kulluk was not equipped with an air bubbler in the field. Thus, the tests conducted with the air bubbler off were taken as the base case.
(b) fixed vs compliant model – the Kulluk was a moored structure, and thus the tests conducted with a mooring, or with a compliant attachment, were the base case.
(c) model towed vs ice pushed – the most appropriate choice is not clear. The action of towing the model induces currents at all depths through the draft of the model. This simulates the case where the ice in the field is current-driven. However, the tests done by pushing the ice sheet primarily induce currents near the water surface. This case is more representative of wind-driven ice movements in the field. The 1988 IIHR tests are the only ones where both
configurations were tested (Table 3.2). Because the most appropriate choice is unclear, both configurations were included in the base case.
Table 3.3 Base Case Used for Comparisons for the Managed Ice Tests
Organiz-see Model Model Ice Test Approach
Table 3.2 for references
Scale Material Ice Pushed or
Model Towed ?
Model Compliant or Fixed ?
Air Bubbler Included ?
ACL 1:30 MOD-ICE ice pushed moored no
HSVA 1:45 Saline ice model towed moored no
IIHR(1985) 1:45 Urea ice ice pushed compliant – 3.4
MN/m stiffness
no
IIHR(1988) 1:45 Urea ice model towed compliant -1.0 MN/m
stiffness
no
1:45 Urea ice ice pushed compliant -1.0 MN/m
stiffness
no
Figure 3.1 Effect of Test Procedure (Ice Pushed vs Model Towed) on the Peak Mooring Forces : Rubble Ice Test Results for the Kulluk
0 1 2 3 4 5 6 7 8 9 10 0 1 2 3 4 5 6 7 8 9 10
Peak Mooring Force (MN) : Model Towed by Carriage
P eak Moori ng Force (MN ) : Model S tati onary & Ice Moved
1988 IIHR Tests ; 2.25 m Ice Thickness ; 0.13 to 1.34 m/s 1988 IIHR Tests ; 4.5 m Ice Thickness ; 0.27 to 1.34 m/s 1988 IIHR Tests ; 0.23 m Ice Thickness ; 0.13 to 1.34 m/s Line of Perfect Agreement Note : The results from test replicates are
Figure 3.2 Effect of Test Procedure (Ice Pushed vs Model Towed) on the Mean Mooring Forces : Rubble Ice Test Results for the Kulluk
Figure 3.3 Effect of Air Bubbler on the Peak Mooring Forces Measured During the ACL Tests : Rubble Ice Test Results for the Kulluk
0 1 2 3 4 5 6 7 8 9 10 0 1 2 3 4 5 6 7 8 9 10
Mean Mooring Force (MN) : Model Towed by Carriage
Mean Moori ng Force (MN ) : Model S tati onary & Ice M o ved
1988 IIHR Tests ; 2.25 m Ice Thickness ; 0.13 to 1.34 m/s 1988 IIHR Tests ; 4.5 m Ice Thickness ; 0.27 to 1.34 m/s 1988 IIHR Tests ; 0.23 m Ice Thickness ; 0.13 to 1.34 m/s Line of Perfect Agreement
Note : The results from test replicates are averaged inthis plot.
0.00 1.00 2.00 3.00 4.00 5.00 6.00 7.00 8.00 9.00 10.00 0.00 1.00 2.00 3.00 4.00 5.00 6.00 7.00 8.00 9.00 10.00
Peak Load (MN) with Bubbler On
P eak Load (MN ) W ith B ubbl er Off 1.53 m Ice Thickness 1.01 m Ice Thickness 0.49 m Ice Thickness Line of Perfect Agreement
Figure 3.4 Effect of Air Bubbler on the Mean Mooring Forces Measured During the ACL Tests : Rubble Ice Test Results for the Kulluk
Figure 3.5 Effect of Model Compliance on the Peak Mooring Forces Measured During the 1985 IIHR Tests : Rubble Ice Test Results for the Kulluk
0.00 1.00 2.00 3.00 4.00 5.00 6.00 7.00 8.00 9.00 10.00 0.00 1.00 2.00 3.00 4.00 5.00 6.00 7.00 8.00 9.00 10.00
Mean Load (MN) with Bubbler On
Mean Load (MN ) W ith B ubbl er Off 1.53 m Ice Thickness 1.01 m Ice Thickness 0.49 m Ice Thickness Line of Perfect Agreement
0 1 2 3 4 5 6 7 8 9 10 0 1 2 3 4 5 6 7 8
Rubble Ice Thickness (m)
P
eak Moori
ng Force (MN
)
1985 IIHR - Rubble Ice Tests ; Rigid stationary platform ; Velocity = 0.54 m/s
1985 IIHR - Rubble Ice Tests ; Compliant stationary platform ; Velocity = 0.54 m/s
3.2.3 Results : Effect of Ice Concentration
The ACL tests were the only ones in which this factor was varied parametrically. These tests showed that the ice concentration is a very important parameter as the mean and peak forces rose rapidly as the ice concentration was increased from 0.75 to 0.95 (Figures 3.6 and 3.7, respectively).
3.2.4 Results : Effect of Ice Thickness
The ACL and HSVA tests were in broken ice which was prepared by breaking up an intact ice sheet into small pieces. The ice pieces were not compressed and thus, the thickness of the resulting ice condition was very similar to that of the initial ice sheet. These test programs both showed that the peak and mean mooring forces in broken ice rose with increasing ice thickness (Figures 3.8 and 3.9, respectively).
The 1985 and 1988 IIHR tests are not directly comparable to the ACL and HSVA tests because the IIHR tests were done in rubble ice, which consisted of a mass of small ice pieces that were already accumulated to various thicknesses greater than that of the initial ice sheet. However, they showed similar trends as the peak and mean mooring forces both increased with the rubble ice thickness (Figures 3.10 to 3.14).
3.2.5 Results : Effect of Ice Drift Speed
All of the test programs showed that the mooring forces were not significantly affected by the ice drift speed over the speed range tested (Figures 3.8 to 3.14).
3.2.6 Results : Comparison of Mooring Force Magnitudes
Direct comparisons are difficult owing to the variations in test technique and parameters. However, in general it can be stated that the ACL tests indicated higher loads than did the HSVA or IIHR tests. The HSVA and IIHR tests indicated mooring forces that were generally similar.
Figure 3.6 Effect of Ice Concentration : Mean Mooring Forces Measured During the ACL Broken Ice Tests Conducted With The Kulluk
Figure 3.7 Effect of Ice Concentration : Peak Mooring Forces Measured During the ACL Broken Ice Tests Conducted With The Kulluk
0.00 1.00 2.00 3.00 4.00 5.00 6.00 7.00 8.00 9.00 10.00 0 1 2 3 4 5 6 7 8 9 10 Concentration (tenths) Mean Moori ng Force (MN
) ACL Tests ; Bubbler Off ; Model stationary & moored ; 0.49 m level ice thickness ; 0.025 to 1m/s
ACL Tests ; Bubbler Off ; Model stationary & moored ; 1.01 m level ice thickness ; 0.25 to 1m/s
ACL Tests ; Bubbler Off ; Model stationary & moored ; 1.53 m level ice thickness ; 0.025 to 0.88 m/s 0.00 1.00 2.00 3.00 4.00 5.00 6.00 7.00 8.00 9.00 10.00 0 1 2 3 4 5 6 7 8 9 10 Concentration (tenths) P eak Moori ng Force (MN )
ACL Tests ; Bubbler Off ; Model Stationary & Moored;: 0.49 m Level ice thickness ; 0.025 to 1m/s
ACL Tests ; Bubbler Off ; Model Stationary & Moored ; 1.01 m level ice thickness ; 0.25 to 1m/s
ACL Tests ; Bubbler Off; Model Stationary & moored ; 1.53 m level ice thickness ; 0.025 to 0.88 m/s
Figure 3.8 Effect of Ice Thickness : Peak Mooring Forces Measured During the ACL and HSVA Tests Conducted in 9+/10 Broken Ice Tests With The Kulluk
Figure 3.9 Effect of Ice Thickness : Mean Mooring Forces Measured During the ACL and HSVA Tests Conducted in 9+/10 Broken Ice Tests With The Kulluk
0 1 2 3 4 5 6 7 8 9 10 0 0.5 1 1.5 2 2.5 3 Ice Thickness (m) P eak Moori ng Force (MN )
1985 IIHR ; Model stationary & compliant ; 0.54 m/s ACL ; Bubbler Off ; Model stationary & moored ; 0.25 to 0.35 m/s
ACL ; Bubbler Off ; Model stationary & moored ; 0.025 m/s HSVA ; Model towed & compliant ; 0.60 to 0. 74 m/s
HSVA ; Model towed & compliant ; 0.35 m/s
HSVA ; Model towed & compliant ; 0.08 m/s 0 1 2 3 4 5 6 7 8 9 10 0 0.5 1 1.5 2 2.5 3 Ice Thickness (m) Mean Moori ng Force (MN )
1985 IIHR ; Model stationary & compliant ; 0.54 m/s ACL ; Bubbler Off ; Model stationary & moored ; 0.25 to 0.35 m/s
ACL ; Bubbler Off ; Model stationary & moored ; 0.025 m/s
Figure 3.10 Effect of Ice Thickness : Peak Mooring Forces Measured During the 1985 IIHR Tests Conducted in 9+/10 Rubble Ice With The Kulluk
Figure 3.11 Effect of Ice Thickness : Peak Mooring Forces During the 1988 IIHR Tests Conducted in 9+/10 Rubble Ice With The Kulluk Model Towed
0 1 2 3 4 5 6 7 8 9 10 0.00 1.00 2.00 3.00 4.00 5.00 6.00 7.00 8.00
Rubble Ice Thickness (m)
P
eak Moori
ng Force (MN
)
1988 IIHR - Rubble Ice Tests ; Platform towed & model compliant ; 1.34 m/s
1988 IIHR - Rubble Ice Tests ; Platform towed & model compliant ; 0.67 m/s
1988 IIHR - Rubble Ice Tests ; Platform towed & model compliant ; Velocity = 0.27 m/s
1988 IIHR - Rubble Ice Tests ; Platform towed & model compliant ; 0.13 m/s
Range of Data (typ.) 0 1 2 3 4 5 6 7 8 9 10 0 1 2 3 4 5 6 7 8
Rubble Ice Thickness (m)
P
eak Moori
ng Force (MN
)
1985 IIHR - Rubble Ice Tests ; Platform stationary & compliant ; 0.54 m/s 1985 IIHR - Rubble Ice Tests ; Platform stationary & model compliant ; 0.80 m/s 1985 IIHR - Rubble Ice Tests ; Platform stationary & model compliant ; 0.27 m/s 1985 IIHR - Rubble Ice Tests ; Platform stationary & model compliant ; 0.13 m/s Range of Data (typ.)
Figure 3.12 Effect of Ice Thickness : Peak Mooring Forces During the 1988 IIHR Tests Conducted in 9+/10 Rubble Ice With The Ice Sheet Pushed
Figure 3.13 Effect of Ice Thickness : Mean Mooring Forces During the 1988 IIHR Tests Conducted in 9+/10 Rubble Ice With The Kulluk Model Towed
0 1 2 3 4 5 6 7 8 9 10 0.00 1.00 2.00 3.00 4.00 5.00 6.00 7.00 8.00
Rubble Ice Thickness (m)
P
eak Moori
ng Force (MN
)
1988 IIHR - Rubble Ice Tests ; Platform stationary & model compliant ; 1.34 m/s
1988 IIHR - Rubble Ice Tests ; Platform stationary & model compliant ; 0.67 m/s
1988 IIHR - Rubble Ice Tests ; Platform stationary & model compliant ; 0.27 m/s
1988 IIHR - Rubble Ice Tests ; Platform stationary & model compliant ; 0.13 m/s
Range of Data (typ.)
0 1 2 3 4 5 6 7 8 9 10 0.00 1.00 2.00 3.00 4.00 5.00 6.00 7.00 8.00
Rubble Ice Thickness (m)
Mean Moori
ng Force (MN
)
1988 IIHR - Rubble Ice Tests ; Platform Towed & model compliant ; 1.34 m/s 1988 IIHR - Rubble Ice Tests ; Platform towed & model compliant; 0.67 m/s 1988 IIHR - Rubble Ice Tests ; Platform towed & model compliant ; 0.27 m/s 1988 IIHR - Rubble Ice Tests ; Platform towed & model compliant ; 0.13 m/s Range of Data
Figure 3.14 Effect of Ice Thickness : Mean Mooring Forces During the 1988 IIHR Tests Conducted in 9+/10 Rubble Ice With The Ice Sheet Pushed
0 1 2 3 4 5 6 7 8 9 10 0.00 1.00 2.00 3.00 4.00 5.00 6.00 7.00 8.00
Rubble Ice Thickness (m)
Mean Moori
ng Force (MN
)
1988 IIHR - Rubble Ice Tests ; Platform stationary & model compliant ; 1.34 m/s 1988 IIHR - Rubble Ice Tests ; Platform stationary & model compliant ; 0.67 m/s 1988 IIHR - Rubble Ice Tests ; Platform stationary & model compliant ; 0.27 m/s 1988 IIHR - Rubble Ice Tests ; Platform stationary & model compliant ; 0.13 m/s Range of Data
3.3 The Ambient Ice Tests 3.3.1 Effect of Test Technique
As was the case for the managed ice tests, the effects of variations in test technique were investigated first before making comparisons among the various test programs. The results are summarized below :
(a) Effect of Air Bubbler – The air bubbler did not have a significant effect on the mean loads, which were similar with and without the air bubbler (Figure 3.15).
The peak loads were similar for both cases as well, except for the tests done in thick (i.e., 1.53 m) ice, which showed significantly higher mooring forces when the air bubbler was operating (Figure 3.15). The reasons for this variation are unclear.
(b) Effect of a Rigidly-Mounted Model vs a Compliant Mooring – the ACL tests showed that the mean mooring forces were not affected by whether or not the model was moored as they were similar for both cases (Figure 3.16). However, the peak forces were significantly and consistently higher when the model was moored, compared to a rigid attachment (Figure 3.16). This may reflect the effects of dynamic amplification although it can not be confirmed.
The 1985 IIHR tests showed that the mean mooring forces were similar for both cases except at the highest speed tested (of 0.8 m/s) where significantly higher loads were measured with the compliant model attachment (Figure 3.17). The peak mooring forces recorded during these tests were similar for both cases within the variability of the test results (Figure 3.17).
The 1988 IIHR tests showed that the mean mooring forces did not depend upon whether or not the model was compliant as they were similar (within the variability of the data) for both cases (Figure 3.18). The peak mooring forces measured during these tests were consistently higher over the range of thicknesses and speeds tested when the model was rigidly attached (Figure 3.19).
In summary, this variability among the trends indicated by the individual test programs makes it difficult to draw general conclusions although it appears that the following statements can be made :
- Mean forces : these appear to be unaffected by whether or not the model is rigidly attached.
- Peak forces – opposite trends have been observed in the test results. Hence, general statements can not be made.
(c) Effect of Towing the Model vs Pushing the Ice Sheet – this can only be assessed by comparing the IIHR and the HSVA tests. The ACL tests were carried out with a
significantly different ice modelling material (i.e., MOD-ICE) than the HSVA and IIHR tests, which were both done using refrigerated model ice that was prepared by adding various dopants.
The MOD-ICE had higher friction as the ice-ice friction factor measured for the ACL tests was 0.51 versus 0.06-0.0.28 for the HSVA tests. Friction factor data are not available for the IIHR tests, although it is expected that this would be generally similar to the HSVA values because the IIHR tests were also done using refrigerated model ice. This variation in friction would be expected to produce higher forces during the ACL tests.
The ice modelling material used during the ACL tests also probably differed with respect to density versus that in the HSVA tests. Although the density values given in the respective reports are identical (i.e., 0.91 kg/m3), it is well known that the ice density can increase significantly during testing done in refrigerated ice. It is not clear when the HSVA ice density values were measured. In contrast, the MOD-ICE used during the ACL tests would have maintained the same density throughout the test program. Ice density data are not available for the IIHR tests, although it is expected that they would be generally similar to the HSVA values because the IIHR tests were also done using refrigerated model ice. The net result is that the ACL tests were probably (in our opinion) done with model ice of lower density than the HSVA and the IIHR tests. Abdelnour et al, 1992 showed that this variation has the potential to result in larger buoyancy forces by a factor up to about 2.
In general, the mooring forces predicted by the IIHR and HSVA tests are in reasonable agreement, and they tend to be lower than those indicated by the ACL tests (Figures 3.20 to 3.23 – in subsequent sections). This suggests that the loads were not greatly affected by whether the model was towed or the ice sheet was pushed. This issue is discussed further in subsequent sections.
3.3.2 Base Case Used for Comparisons
The base case was selected based on the same rationale used for the managed ice tests, which is described in section 3.2.2. The base cases used are summarized in Table 3.4.
Table 3.4 Base Case Used for Comparisons for the Ambient Ice Tests
Organiz-see Model Model Ice Test Approach
Table 3.1 for references
Scale Material Ice Pushed or
Model Towed ?
Model Compliant or Fixed ?
Air Bubbler Included ?
ACL 1:30 MOD-ICE ice pushed moored no
HSVA 1:45 Saline ice model towed moored no
IIHR(1985) 1:45 Urea ice ice pushed compliant – 2.8
MN/m stiffness
no
IIHR(1988) 1:45 Urea ice ice pushed compliant – 2.8
MN/m stiffness
no
Figure 3.15 Effect of Air Bubbler on The Sheet Ice Loads Measured During the ACL Tests Conducted With the Kulluk
0 5 10 15 20 25 30 0 5 10 15 20 25 30
Load with Bubbler On (MN)
Load W ith B ubbl er Off (MN ) Line of 1:1 Agreement
ACL Tests ; Peak Mooring Forces ; Model Stationary and moored ; 0.49 to 1.53 m ice thickness ; 0.025 to 0.35 m/s
ACL Tests ; Mean Mooring Forces ; Model Stationary and moored ; 0.49 to 1.53 m ice thickness ; 0.025 to 0.35 m/s
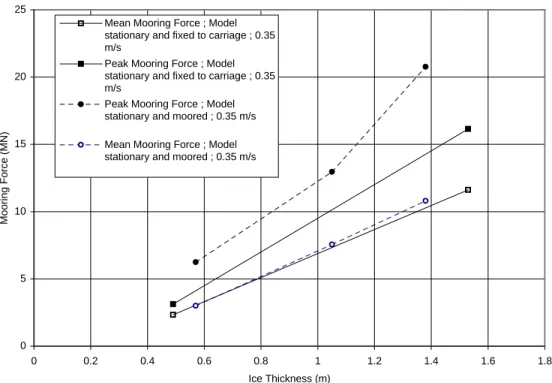
Figure 3.16 Effect of Test Technique (Rigidly-Attached vs Moored Model) : Mean and Peak Sheet Ice Loads During the ACL Tests Conducted With the Kulluk
Figure 3.17 Effect of Test Technique (Rigid vs Compliant Model Attachment) : Mean and Peak Sheet Ice Loads During the 1985 IIHR Tests With the Kulluk
0 5 10 15 20 25 0 0.2 0.4 0.6 0.8 1 1.2 1.4 1.6 1.8 Ice Thickness (m) Moori ng Force (MN )
Mean Mooring Force ; Model stationary and fixed to carriage ; 0.35 m/s
Peak Mooring Force ; Model stationary and fixed to carriage ; 0.35 m/s
Peak Mooring Force ; Model stationary and moored ; 0.35 m/s Mean Mooring Force ; Model stationary and moored ; 0.35 m/s
0 1 2 3 4 5 6 0 0.1 0.2 0.3 0.4 0.5 0.6 0.7 0.8 0.9 Velocity (m/s) Moori ng Force (MN )
Mean Loads ; Model stationary and fixed to carriage ; 1.31 to 1.35 m ice thickness Mean Loads ; Model stationary and compliant ; 1.35 to 1.43 m ice thickness
Peak Loads ; Model stationary and fixed to carriage ; 1.35 to 1.43 m ice thickness Peak Loads ; Model stationary and compliant ; 1.35 to 1.43 m ice thickness
Figure 3.18 Effect of Test Technique (Rigidly-Attached vs Compliant Model) : Mean Sheet Ice Loads During the 1988 IIHR Tests With the Kulluk
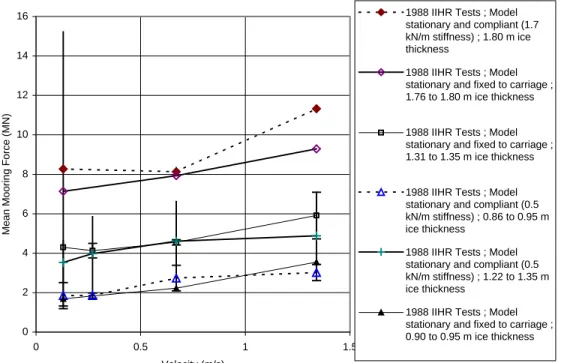
Figure 3.19 Effect of Test Technique (Rigidly-Attached vs Compliant Model) : Peak Sheet Ice Loads During the 1988 IIHR Tests With the Kulluk
0 2 4 6 8 10 12 14 16 0 0.5 1 1.5 Velocity (m/s) Mean Moori ng Force (MN )
1988 IIHR Tests ; Model stationary and compliant (1.7 kN/m stiffness) ; 1.80 m ice thickness
1988 IIHR Tests ; Model stationary and fixed to carriage ; 1.76 to 1.80 m ice thickness
1988 IIHR Tests ; Model stationary and fixed to carriage ; 1.31 to 1.35 m ice thickness
1988 IIHR Tests ; Model stationary and compliant (0.5 kN/m stiffness) ; 0.86 to 0.95 m ice thickness
1988 IIHR Tests ; Model stationary and compliant (0.5 kN/m stiffness) ; 1.22 to 1.35 m ice thickness
1988 IIHR Tests ; Model stationary and fixed to carriage ; 0.90 to 0.95 m ice thickness 0 5 10 15 20 25 0 0.2 0.4 0.6 0.8 1 1.2 1.4 1.6 Velocity (m/s) P eak Moori ng Force (MN )
1988 Tests ; Model stationary and fixed to carriage ; 1.31 to 1.35 m ice thickness
1988 IIHR Tests ; Model stationary and compliant (0.5 kN/m stiffness) ; 0.86 to 0.95 m ice thickness
1988 IIHR Tests ; Model stationary and compliant (0.5 kN/m stiffness) ; 1.22 to 1.35 m ice thickness
1988 IIHR Tests ; Model stationary and compliant (1.7 kN/m stiffness) ; 1.80 m ice thickness
1988 IIHR Tests ; Model stationary and fixed to carriage ; 1.76 to 1.80 m ice thickness
1988 IIHR Tests ; Model stationary and fixed to carriage ; 0.90 to 0.95 m ice thickness
3.3.3 Results : Effect of Ice Thickness
As expected, both the peak and the mean mooring forces increased with the ice thickness for all test programs (Figures 3.20 to 3.23).
The test data indicate that the relationship between load and ice thickness is speed-dependent. At lower ice drift rates, the mooring forces increase with ice thickness in a relatively linear manner, that is generally consistent among all of the test programs.
At higher ice drift rates, the relationship between mooring force and ice thickness becomes non-linear.
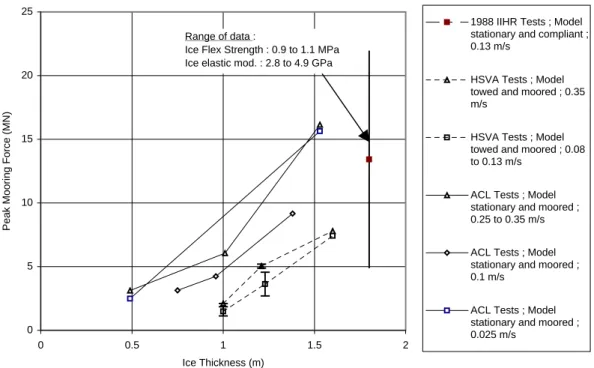
Figure 3.20 Effect of Ice Thickness on Peak Loads for Low Ice Velocities (of .025 to 0.35 m/s) 0 5 10 15 20 25 0 0.5 1 1.5 2 Ice Thickness (m) P eak Moori ng Force (MN )
1988 IIHR Tests ; Model stationary and compliant ; 0.13 m/s
HSVA Tests ; Model towed and moored ; 0.35 m/s
HSVA Tests ; Model towed and moored ; 0.08 to 0.13 m/s
ACL Tests ; Model stationary and moored ; 0.25 to 0.35 m/s
ACL Tests ; Model stationary and moored ; 0.1 m/s
ACL Tests ; Model stationary and moored ; 0.025 m/s
Range of data :
Ice Flex Strength : 0.9 to 1.1 MPa Ice elastic mod. : 2.8 to 4.9 GPa
Figure 3.21 Effect of Ice Thickness on Peak Loads for High Ice Velocities (of 0.6 to 1.3 m/s)
Figure 3.22 Effect of Ice Thickness on Mean Loads for Low Ice Velocities (of .025 to 0.35 m/s) 0 5 10 15 20 25 0 0.5 1 1.5 2 Ice Thickness (m) P eak Moori ng Force (MN ) 1988 IIHR Tests ; Model stationary and compliant ; 1.34 m/s HSVA Tests ; Model towed and moored ; 0.60 to 0.74 m/s ACL Tests ; Model stationary and moored ; 0.88 to 1 m/s 0 2 4 6 8 10 12 14 16 0 0.5 1 1.5 2 Ice Thickness (m) Mean Moori ng Force (MN ) 1988 IIHR Tests ; Model stationary and compliant ; 0.13 m/s ACL Tests ; Model stationary and moored ; 0.25 to 0.35 m/s ACL Tests ; Model stationary and moored ; 0.1 m/s ACL Tests ; Model stationary and moored ; 0.025 m/s Range of data :
Ice Flex Strength : 0.9 to 1.1 MPa Ice elastic mod. : 2.8 to 4.9 GPa
Figure 3.23 Effect of Ice Thickness on Mean Loads for High Ice Velocities (of 0.6 to 1.3 m/s)
3.3.4 Results : Effect of Ice Drift Speed
The effect of the ice drift rate on the mooring force depends on the ice thickness (Figures 3.24 to 3.27).
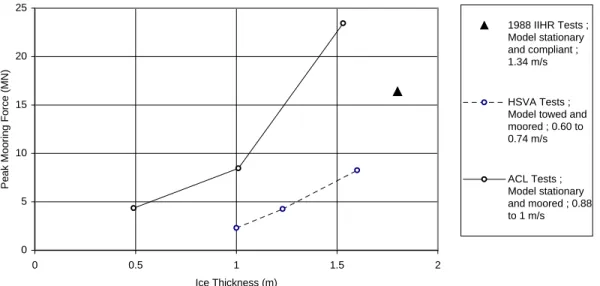
At ice thicknesses up to about 1 m, the mean and peak mooring forces generally increase with the ice drift speed in a linear manner. The ACL tests done at 1 m ice thickness are the most notable exception to this statement as the measured forces appear to “level off’ with increasing ice drift speed (Figures 3.24 and 3.26). The reasons for this variation are unclear.
At ice thicknesses of 1.2 to 1.8 m, the ACL and IIHR data indicated that the mean and peak mooring forces increased non-linearly with the ice drift speed (Figures 3.25 and 3.27). The peak forces measured during the HSVA tests showed very little speed-dependence (Figure 3.25). The reasons for this variation are unclear.
0 2 4 6 8 10 12 14 16 18 20 0 0.5 1 1.5 2 Ice Thickness (m) Mean Moori ng Force (MN ) 1988 IIHR Tests ; Model stationary and compliant ; 1.34 m/s 1988 IIHR Tests ; Model stationary and compliant ; 0.67 m/s ACL Tests ; Model stationary and moored ; 0.88 to 1 m/s
Figure 3.24 Effect of Ice Drift Speed on Peak Loads for Low Ice Thicknesses (of 0.5 to 1.0 m)
Figure 3.25 Effect of Ice Drift Speed on Peak Loads for High Ice Thicknesses (of 1.2 to 1.8 m) 0 1 2 3 4 5 6 7 8 9 0 0.2 0.4 0.6 0.8 1 1.2
Ice Drift Speed (m/s)
P
eak Moori
ng Force (MN
)
HSVA Tests ; Model towed and moored ; 1.0 m ice thickness
ACL Tests ; Model stationary and moored ; 0.96 to 1.01 m ice thickness
ACL Tests ; Model stationary and moored ; 0.49 m ice thickness 0 5 10 15 20 25 0 0.2 0.4 0.6 0.8 1 1.2 1.4 1.6 Ice Speed (m/s) P eak Moori ng Force (MN ) 1988 IIHR Tests ; Model stationary and compliant ; 1.8 m ice thickness HSVA Tests ; Model towed and moored ; 1.6 m ice thickness
HSVA Tests ; Model towed and moored ; 1.21 to 1.26 m ice thickness ACL Tests ; Model stationary and moored ; 1.53 m ice thickness
Range of data : Ice Flex Strength : 0.9 to 1.1 MPa
Figure 3.26 Effect of Ice Drift Speed on Mean Loads for Low Ice Thicknesses (of 0.5 to 1.0 m)
Figure 3.27 Effect of Ice Drift Speed on Mean Loads for High Ice Thicknesses (of 1.2 to 1.8 m) 0 1 2 3 4 5 6 7 8 0 0.2 0.4 0.6 0.8 1 1.2
Ice Drift Speed (m/s)
Mean Moori
ng Force (MN
)
ACL Tests ; Model stationary and moored ; 0.96 to 1.01 m ice thickness
ACL Tests ; Model stationary and moored ; 0.49 m ice thickness 0 2 4 6 8 10 12 14 16 18 20 0 0.2 0.4 0.6 0.8 1 1.2 1.4 1.6
Ice Drift Speed (m/s)
Mean Moori ng Force (MN ) 1988 IIHR Tests ; Model stationary and compliant ; 1.8 m ice thickness ACL Tests ; Model stationary and moored ; 1.53 m ice thickness Range of data :
Ice Flex Strength : 0.9 to 1.1 MPa Ice elastic mod. : 2.8 to 4.9 GPa
3.3.5 Comparison : Load Magnitudes Measured During The Test Programs
Direct comparisons are difficult due to variations in test technique and parameters. However, in general, it can be stated that :
(a) the mooring forces predicted by the HSVA and the IIHR tests were generally similar. (b) the ACL tests predicted higher loads than did the HSVA and the IIHR tests by a factor of
about 3 to 5. The reasons for this variation are unclear although differences in the
modelling material used (already described in section 3.3.1) were probably one contributing factor.
3.3.6 Comparison : Loads Measured During the Managed and the Ambient Ice Tests
The variation between the managed ice loads at 9+/10 concentration versus those for ambient ice provides an indication of the relative contribution of ice breaking forces versus ice clearing forces.
The HSVA test results showed that the ambient ice loads were consistently and significantly higher by a factor of about 2 than the corresponding ones for managed ice (Figure 3.28). The ACL tests showed a different result as the peak and mean mooring forces were similar for managed and ambient ice for most cases (Figures 3.29 and 3.30, respectively). The test data points for thick ice (i.e. 1.5 m) and low speed (0.025 m/s) are the only exceptions to this statement as significantly higher forces were measured for the ambient ice tests.
The 1985 IIHR tests showed that the mean and peak mooring forces in ambient ice were
consistently more than the respective values in managed ice by a factor of about 2 (Figure 3.31) The results from the 1988 IIHR tests were somewhat unclear as, for several cases, the mooring forces measured in ambient ice were similar to those in managed ice (Figures 3.32 and 3.33). However, for a few cases, the loads in ambient ice were significantly higher than those in managed ice.
Figure 3.28 Comparison : Peak Loads Measured in Sheet Ice and Broken Ice During Tests With the Kulluk at HSVA
Figure 3.29 Comparison : Peak Loads Measured in Sheet Ice and Broken Ice During Tests With the Kulluk at ACL
0.00 1.00 2.00 3.00 4.00 5.00 6.00 7.00 8.00 9.00 0 0.1 0.2 0.3 0.4 0.5 0.6 0.7 0.8 Velocity (m/s) P eak Moori ng Load (MN )
Sheet Ice Tests ; 1.6 m ice thickness
Broken Ice Tests with 9+/10 Ice Concentration ; 1.6 m ice thickness
Broken Ice Tests with 9+/10 Ice Concentration ; 1.21 m ice thickness
Sheet Ice Tests ; 1.21 to 1.26 m ice thickness 0.00 2.00 4.00 6.00 8.00 10.00 12.00 14.00 16.00 18.00 0 0.2 0.4 0.6 0.8 1 1.2 1.4 1.6 1.8 Ice Thickness (m) P eak Moori ng Loads (MN )
Sheet Ice Tests ; Peak Mooring Loads ; 0.25 to 0.35 m/s speed
Broken Ice Tests for Ice Concentration of 9.5 to 10/10 ; Peak Mooring Loads ; 0.025 m/s speed
Sheet Ice Tests for Ice Concentration of 9.5 to 10/10 ; Peak Mooring Loads ; 0.025 m/s speed
Broken Ice Tests for Ice Concentration of 9.5 to 10/10 ; Peak Mooring Loads ; 0.25 to 0.35 m/s speed
Figure 3.30 Comparison : Mean Loads Measured in Sheet Ice and Broken Ice During Tests With the Kulluk at ACL
Figure 3.31 Comparison : Mean and Peak Loads Measured in Sheet Ice and Broken Ice During the 1985 Tests With the Kulluk at the IIHR
0 2 4 6 8 10 12 0 0.5 1 1.5 2 Ice Thickness (m) Mean Moori ng Loads (MN )
Broken Ice Tests for Ice Concentration of 9.5 to 10/10 ; Mean Mooring Loads ; 0.025 m/s speed
Broken Ice Tests for Ice Concentration of 9.5 to 10/10 ; Mean Mooring Loads ; 0.25 to 0.35 m/s speed
Sheet Ice Tests ; Mean Mooring Loads ; 0.025 m/s speed
Sheet Ice Tests ; Mean Mooring Loads ; 0.25 to 0.35 m/s speed 0 1 2 3 4 5 6 0 0.2 0.4 0.6 0.8 1
Ice Drift Speed (m/s)
Moori
ng Force (MN
)
Broken Ice Tests at 10/10 Concentration ; Peak Mooring Forces ; 1.35 to 1.43 m ice thickness
Broken Ice Tests at 10/10 Concentration ; Mean Mooring Forces ; 1.35 to 1.43 m ice thickness
Rubble Ice Tests ; Peak Mooring Forces ; 1.35 m ice thickness
Sheet Ice Tests ; Peak Mooring Forces ; 1.35 to 1.43 m ice thickness
Sheet Ice Tests ; Mean MooringForces ; 1.35 to 1.43 m ice thickness
Figure 3.32 Comparison : Peak Loads Measured in Sheet Ice and Rubble Ice During the 1988 Tests With the Kulluk at the IIHR
Figure 3.33 Comparison : Mean Loads Measured in Sheet Ice and Rubble Ice During the 1988 Tests With the Kulluk at the IIHR
0.00 5.00 10.00 15.00 20.00 25.00 30.00 0.00 1.00 2.00 3.00 4.00 5.00 Ice Thickness (m) P eak Moori ng Load (MN )
Rubble Ice Tests ; Ice Moved and Platform Stationary ; 0.27 m/s speed ; 0.5 kN/m stiffness
Rubble Ice Tests ; Platform Moved and Ice Stationary ; 0.27 m/s speed ; 0.5 kN/m stiffness
Rubble Ice Tests ; Platform Moved and Ice Stationary ; 0.13 m/s speed ; 0.5 kN/m stiffness
Rubble Ice Tests ; Ice Moved and Platform Stationary ; 0.13 m/s speed ; 0.5 kN/m stiffness
Sheet Ice Tests ; 0.27 m/s speed ; 0.5 kN/m stiffness
Sheet Ice Tests ; 0.13 m/s speed ; 0.5 kN/m stiffness 0.00 2.00 4.00 6.00 8.00 10.00 12.00 14.00 16.00 18.00 0.00 1.00 2.00 3.00 4.00 5.00 Ice Thickness (m) Mean Moori ng Load (MN )
Rubble Ice Tests ; Ice Moved and Platform Stationary ; 0.27 m/s speed ; 0.5 kN/m stiffness Rubble Ice Tests ; Platform Moved and Ice Stationary ; 0.27 m/s speed ; 0.5 kN/m stiffness
Rubble Ice Tests ; Platform Moved and Ice Stationary ; 0.13 m/s speed ; 0.5 kN/m stiffness
Rubble Ice Tests ; Ice Moved and Platform Stationary ; 0.13 m/s speed ; 0.5 kN/m stiffness Sheet Ice Tests ; 0.27 m/s speed ; 0.5 kN/m stiffness
Sheet Ice Tests ; 0.13 m/s speed ; 0.5 kN/m stiffness
4.0 TESTS WITH SEMI-SUBMERSIBLES 4.1 Available Information
The available information is summarized in Table 4.1.
Table 4.1 The Available Semisubmersible Database
Organiz. Structure Waterline Test Approach Ice Conditions
& Reference
Shape Scale Model Ice
Material (notes 3&4) Ice Pushed or model Towed ?
Sheet Ice Managed
Ice ACL (Noble and Singh, 1982) Generic – column legs only
Vertical 1:30 MOD-ICE Model
Towed Not tested Tested ACL (Comfort and Ritch, 1986) Aker D-6 Semi-submersible 1 vertical 2.45° down-breaking cone 1:40 MOD-ICE Ice Pushed Tested Not tested ACL (Free et al, 1985)
Mobil SPSV 1. vertical &
no riser 2. 60° downbreaking cone & no riser 3. 60° downbreaking cone and riser
1: 39.37 MOD-ICE Ice Pushed Tested Tested IMD (Szeto and Rowe, 1987) Mobil SPSV vertical 1: 39.37 EGAD-Ice Model Towed Not tested Tested IMD (Williams, 1989) Nekton 8000 Semi-submersible
vertical 1:45 EGAD-Ice 1. model
fixed to carriage and towed 2. model moored to carriage and towed Tested Tested but not included (note 2) Tested Tested (note 5) Notes :
1. Legend : ACL ARCTEC Canada Ltd.
IMD Institute of Marine Dynamics
SPSV Semisubmersible Storage and Production Vessel
2. Only the mooring line tensions are presented in the report. Total forces are not provided in the report.
3. MOD-ICE is a proprietary mixture that was used by the ARCTEC group as a material for ice modelling (Schultz and Free, 1984).
4. EGAD-Ice is prepared by freezing water with Ethylene Glycol and Aliphatic Detergent added to it (Timco, 1985).
5. Williams, 1989 only presents mooring line tensions. The total forces used in the analyses presented here were determined based on the system stiffness, and the measured displacements.
4.1.2 Method of Analysis and Comparison
Table 4.1 shows that the available data were collected under a wide range of conditions, which makes comparisons difficult.
The generic tests were done with only one row of column legs, which was oriented at 90° to the relative ice motion. The semisubmersible models were tested with all columns, and hence their shape was rectangular (for the Nekton 8000 which had 6 legs) and square for the Mobil SPSV and the Aker D-6 (which both had 4 legs). Furthermore, all of the semisubmersibles were tested at several ice attack angles, which had an important effect as it affected the overall width of the structure “seen” by the ice.
This variation had to be taken into account in making comparisons among the various test programs, and a number of approaches were tried. The load per unit “beam” was used as an index. In this case, the “beam” was defined as the overall projected width of the
semisubmersible in the direction facing the ice, and hence, the “beam” varied with the ice attack angle. As will be shown subsequently, this relatively simple approach allowed several trends to be identified with reasonable precision.
The proportion of the semisubmersible “beam” that was structure (as opposed to being a “gap” in the semisubmersible’s “beam”) was introduced as a parameter for some analyses. However, this was not helpful as it usually tended to obscure the trends, or at best, it did not provide any more clarity or information, than the simple line load index.
Consequently, comparisons are only made in this report based on the line load.
4.2 Managed Ice Tests 4.2.1 Presentation of Results
The results are plotted in the figures listed below. It should be noted that all values are full scale values.
(a) Figure 4.1 – peak line loads measured during generic tests with a single row of vertical column legs done by ACL (Noble and Singh, 1982). Model scale and full scale values are both presented in this paper. All of the plotted values were converted to full scale using Froude scaling.
(b) Figure 4.2 – line loads measured during tests with the Mobil SPSV done by IMD (Szeto et al, 1987a;b). Model scale values are presented in Szeto et al, 1987a;b. These were
converted to full scale by FTL for this project using Froude scaling.
(c) Figure 4.3 – mean line loads measured during tests with the Nekton 8000 semisubmersible done by IMD (Williams, 1989) for the case where the model was moored to the carriage,
and towed through the ice pack. Model scale values are presented in Williams, 1989. These were converted to full scale by FTL for this project using Froude scaling.
(d) Figures 4.4 and 4.5 – mean and peak line loads, respectively, measured during tests with the Nekton 8000 semisubmersible done by IMD (Williams, 1989) with the model being fixed without a mooring to the carriage, and towed through the ice pack. Model scale values are presented in Williams, 1989. These were converted to full scale by FTL for this project using Froude scaling.
(e) Figures 4.6 and 4.7 – mean and peak line loads, respectively, measured during tests with the Mobil SPSV during tests done by ARCTEC (Free et al, 1985). Full scale values obtained using Froude scaling are presented in Free et al, 1985.
4.2.2 Results : Effect of Ice Concentration
All of the tests show that the ice concentration is a very important factor. The line loads start to rise significantly at concentrations of 7/10 to 8/10.
4.2.3 Results : Effect of Floe Size
Intuitively, it was expected that the load would increase with the floe size because flexure, crushing and other “sheet-type” ice failure processes are likely to become more predominant (than ice clearing processes) as the floe size is increased. Also, more jamming of the ice pieces would be expected to occur in the test basins, which have limited width, as the ice floe size is increased. Unfortunately, the available data are insufficient to test this hypothesis.
The floe size was only varied parametrically during the Nekton 8000 test program conducted by Williams, 1989. At first glance, these data suggest that the load increases with the floe size, as much higher line loads were measured for the 18 m and 45 m diameter floes, compared to the 7 m diameter ones (Figure 4.3). However, definitive statements cannot be made because the semisubmersible’s heading was also varied. The tests with the 7 m diameter floes were done at a 45° heading which would tend to allow the ice to clear more easily around the
semisubmersible, compared to headings of 0° and 90°. 4.2.4 Results : Effect of Ice Drift Rate
The ice drift rate did not affect the loads significantly over the range of speeds tested. 4.2.5 Results : Effect of Ice Thickness
The ice thickness did not affect the loads significantly over the range tested. This probably indicates that ice clearing processes were predominant, which are not significantly affected by ice thickness.
4.2.6 Results : Line Load Magnitudes
Direct comparisons are difficult because the line load is highly sensitive to the ice
concentration, and this was not standardized among the test programs. Also, information is not available to evaluate the precision to which this parameter was controlled during the individual tests. This is no doubt one of the reasons for large degree of variability that is evident in the data.
For relatively high concentrations (of >8/10), there is reasonable correlation among the
measured line loads, as they agree with in a factor of about 2. The tests done by ARCTEC with generic semisubmersible column legs (by Noble and Singh, 1982 – Figure 4.1) are the only exception to this statement as they indicate line loads that are about 10 times higher than the other test programs. The reasons for this variation are unclear.
4.2.7 Results : Effect of Ice Modelling Material
In general, the tests done with MOD-ICE and EGAD-ice indicate similar results and trends.
Figure 4.1 Peak Line Loads During Generic Tests With 0.000 100.000 200.000 300.000 400.000 500.000 600.000 700.000 800.000 900.000 0 1 2 3 4 5 6 7 8 9 10
Ice Concentration (tenths)
P eak Li ne Load (kN /m) on W hol e Length of Model
Model No. 1 - Two columns @ 15.7 m dia. & 61 m C-C spacing
Model No. 2 - Three columns @ 12.8 m dia. & 74.9 m C-C spacing
Model No. 3 - Four columns : 2 outer columns @ 13.7 m dia. & 2 inner columns @ 7.6 m dia. ; C-C column spacing : inner columns @ 21.3 m & inner-outer columns @ 68.9 m
Comment by FTL: The higher line loads for Model no. 3 (vs Models 1
and 2) are probably due to interaction effects with the tank
Semisubmersible Columns in Managed Ice (Noble and Singh, 1982)
Figure 4.2
Line Loads During Tests With the Mobil SPSV in Managed Ice (Szeto et al, 1987a;b) 0.000 10.000 20.000 30.000 40.000 50.000 60.000 0 1 2 3 4 5 6 7 8 9 10
Ice Concentration (tenths)
Li ne Load (kN /m) on W hol e S e mi submersi bl e S ide (paper doesn’ t speci fy w h ther thi s i s a peak or an average load)
Vertical columns & no riser protection ; 0° heading ; 1.0 m ice thickness ; 0.5 m/s
Vertical columns & no riser protection ; 0° heading ; 1.0 m ice thickness ; 1.0 m/s
Vertical columns & no riser protection ; 20° heading ; 1.0 m ice thickness ; 0.5 m/s
Vertical columns & no riser protection ; 20° heading ; 1.0 m ice thickness ; 0.8 m/s
Vertical columns & no riser protection ; 20° heading ; 1.0 m ice thickness ; 1.5 m/s
Figure 4.3
Mean Line Loads Measured During Tests With the Nekton 8000 in 9/10 Managed Ice : Model Moored to the Carriage and Towed Through the Ice Pack (Williams, 1989)
0 20 40 60 80 100 120 140 160 0.00 0.10 0.20 0.30 0.40 0.50 0.60 0.70 0.80 Velocity (m/s) Mean Li ne Load (kN /m) on S e mi submersi bl e E dge
18 m diameter floes ; 90° heading ; 1.0 m ice thickness 45 m diameter floes ; 90° heading ; 1.0 m ice thickness 18 m diameter floes ; 0° heading ; 1.0 m ice thickness 45 m diameter floes ; 0° heading ; 1.0 m ice thickness 7 m diameter floes ; 45° heading ; 1.0 m ice thickness 7 m diameter floes ; 45° heading ; 0.5 m ice thickness
90° heading
45° heading
Figure 4.4
Mean Line Loads Measured During Tests With the Nekton 8000 in 9/10 Managed Ice : Model Fixed to the Carriage Without a Mooring and Towed (Williams, 1989)
Figure 4.5
Peak Line Loads Measured During Tests With the Nekton 8000 in 9/10 Managed Ice : Model Fixed to the Carriage Without a Mooring and Towed (Williams, 1989) 0 10 20 30 40 50 60 70 80 90 100 0.00 0.10 0.20 0.30 0.40 0.50 0.60 0.70 0.80 Velocity (m/s) Peak Li ne Load ( k N /m )
1.02 m ice thickness ; 0° heading 1.01 m ice thickness ; 90° heading 0.54 m ice thickness ; 90° heading Note : All of the semisubmerisble columns had vertical faces.
0 5 10 15 20 25 30 35 40 45 50 0.00 0.10 0.20 0.30 0.40 0.50 0.60 0.70 0.80 Velocity (m/s) Mean Li ne Load (kN /m) on S e mi submeri s bl e Face
1.02 m ice thickness ; 0° heading 1.01 m ice thickness ; 90° heading 0.54 m ice thickness ; 90° heading
Figure 4.6
Mean Line Loads During Tests With the Mobil SPSV in Managed Ice (Free et al, 1985) 0.00 2.00 4.00 6.00 8.00 10.00 12.00 0 1 2 3 4 5 6 7 8 9 10
Ice Concentration (tenths)
A v erage Li ne Load on S e mi -S ubmeri s bl e Face (kN /m)
Vertical columns & no riser protector ; 0.80 m ice thickness ; 0.98 m/s ; 0° Attack angle Vertical columns & no riser protector ; 0.80 m ice thickness ; 0.25 m/s ; 0° Attack angle Vertical columns & no riser protector ; 0.80 m ice thickness ; 0.49 m/s ; 0° Attack angle 60° Cone on columns & no riser protector ; 1.52 m ice thickness ; 1.41 m/s ; 0° Attack angle 60° Cone on columns & no riser protector ; 1.52 m ice thickness ; 0.24 m/s ; 0° Attack angle 60° Cone on columns & no riser protector ; 1.52 m ice thickness ; 0.49 m/s ; 22.5° Attack angle 60° Cone on columns & no riser protector ; 1.01 m ice thickness ; 0.50 m/s ; 0° Attack angle 60° Cone on columns & no riser protector ; 1.52 m ice thickness ; 0.49 m/s ; 22.5° Attack angle 60° Cone on columns & no riser protector ; 1.52 m ice thickness ; 0.47 to 0.48 m/s ; 0° Attack angle 60° Cone on columns & riser protector included ; 1.01 m ice thickness ; 0.49 m/s ; 0° Attack angle
Note : A number of other broken ice tests were carried out during this project. However, these results are not plotted here
because steady-state conditions were not achieved.
Figure 4.7
Peak Line Loads During Tests With the Mobil SPSV in Managed Ice (Free et al, 1985) 0.00 10.00 20.00 30.00 40.00 50.00 60.00 0 1 2 3 4 5 6 7 8 9 10
Ice Concentration (tenths)
P eak Li ne Load on S e mi -S ubmeri s bl e Face (kN /m) (the peak l oad w a s defi
ned as the average of the top thi
rd of the measured forces)
Vertical columns & no riser protector ; 0.80 m ice thickness ; 0.98 m/s ; 0° Attack angle Vertical columns & no riser protector ; 0.80 m ice thickness ; 0.25 m/s ; 0° Attack angle Vertical columns & no riser protector ; 0.80 m ice thickness ; 0.49 m/s ; 0° Attack angle 60° Cone on columns & no riser protector ; 1.52 m ice thickness ; 1.41 m/s ; 0° Attack angle 60° Cone on columns & no riser protector ; 1.52 m ice thickness ; 0.24 m/s ; 0° Attack angle 60° Cone on columns & no riser protector ; 1.52 m ice thickness ; 0.49 m/s ; 22.5° Attack angle 60° Cone on columns & no riser protector ; 1.01 m ice thickness ; 0.50 m/s ; 0° Attack angle 60° Cone on columns & no riser protector ; 1.52 m ice thickness ; 0.49 m/s ; 22.5° Attack angle 60° Cone on columns & no riser protector ; 1.52 m ice thickness ; 0.47 to 0.48 m/s ; 0° Attack angle 60° Cone on columns & riser protector included ; 1.01 m ice thickness ; 0.49 m/s ; 0° Attack angle
Note : A number of other broken ice tests were carried out during this project. However, these results are not plotted
here because steady-state conditions were not achieved.