HAL Id: inserm-00770251
https://www.hal.inserm.fr/inserm-00770251
Submitted on 4 Jan 2013
HAL is a multi-disciplinary open access
archive for the deposit and dissemination of sci-entific research documents, whether they are pub-lished or not. The documents may come from teaching and research institutions in France or abroad, or from public or private research centers.
L’archive ouverte pluridisciplinaire HAL, est destinée au dépôt et à la diffusion de documents scientifiques de niveau recherche, publiés ou non, émanant des établissements d’enseignement et de recherche français ou étrangers, des laboratoires publics ou privés.
Contribution in analyzing directional propagation flow
in EEG recordings investigating entropic methods and
realistic physiological models
Chunfeng Yang, Régine Le Bouquin Jeannès, Jean-Jacques Bellanger, Fabrice
Wendling, Huazhong Shu
To cite this version:
Chunfeng Yang, Régine Le Bouquin Jeannès, Jean-Jacques Bellanger, Fabrice Wendling, Huazhong Shu. Contribution in analyzing directional propagation flow in EEG recordings investigating entropic methods and realistic physiological models. Biomedical Engineering and Informatics 2011, Oct 2011, Shanghai, China. pp.703 - 707, �10.1109/BMEI.2011.6098416�. �inserm-00770251�
Contribution in analyzing directional propagation
flow in EEG recordings investigating entropic
methods and realistic physiological models
Chunfeng Yang1, 2, 4, Régine Le Bouquin Jeannès 1, 2, 4
, Jean-Jacques Bellanger1, 2, 4, Fabrice Wendling1, 2, 4
1
U642, INSERM
2
LTSI, Université de Rennes 1 Rennes, France
Huazhong Shu3, 4, Senior Member, IEEE 3
Laboratory of Image Science and Technology, School of Computer Science and Engineering
Southeast University Nanjing, China
4
Centre de Recherche en Information Biomédicale sino-français (CRIBs)
Abstract—Our objective is to analyze EEG signals recorded with
depth electrodes during seizures in patients with drug-resistant epilepsy. Usually, different phases are observed during the seizure process, including a fast onset activity (FOA). We aim to determine how cerebral structures get involved during this FOA, in particular whether some structures can “drive” some other structures. We compare a transfer entropy based measure with a measure related to linear Granger causality index to detect causal interdependences in multivariate signals generated either by a linear autoregressive model or by a physiology-based model of coupled neuronal populations. Experimental simulation results support the relevance of the new measure for characterizing the information flow for direct and indirect relations.
Keywords - EEG signal; transfer entropy; physiology-based model; causality
I. INTRODUCTION
Epilepsy is a neurological disorder characterized by repetitive seizures. In 30% of cases, seizures remain drug-resistant and considerably affect all aspects of the patient’s life [1]. Drug-resistant epilepsies are often partial, with an epileptogenic zone (EZ) located in a relatively circumscribed brain area. For these partial epilepsies, surgical treatment can be considered. The difficulty that arises is then to determine the organization of the EZ and, thus, the part of the brain that should be excised to remove seizures. In some patients, the pre-surgical evaluation may include recording of intracerebral electroencephalographic (iEEG) signals using intracerebral depth electrodes. The analysis of such signals which remains a difficult task is aimed at determining which sites of the brain belong to the EZ, prior to surgery. In this context, signal processing techniques can provide some quantitative information that cannot be easily obtained by visual inspection. This is typically the case of correlation (wide-sense) measures that proved useful for assessment of functional couplings between distant brain sites. Besides functional connectivity, effective connectivity provides complementary information on the directionality of couplings, i.e. the way one neural population does influence another one. A concept of causality between time series was proposed and formulated by Granger [2] and led to the so-called Granger Causality Index (GCI).
Recently, a theoretical information measure named Transfer Entropy (TE) was proposed to identify the direction of the information flow and to quantify the strength of coupling between complex systems [3]. This “model-free” technique is based on the transition probabilities between states of the considered systems from output signals. This method has been applied and tested in some nonlinear benchmark models and real EEG signals with no ground reference [4, 5]. In this paper, we derive a transfer entropy based measure (named DTE) and compare it to a Linear Granger Causality Index based measure (named DLGCI) on the basis of a physiologically-plausible model used as ground-truth.
II. METHODS AND MATERIALS
A. Linear Granger Causality Index
Granger causality is classically tested in the context of linear regression models [2]. Let X and Y be two random zero-mean signals whose time observations (realizations) are denoted x t
( )
and y t( )
, t=1, 2,...,T , where T is the signal length. If we model independently each observation x t( )
and( )
y t by introducing an univariate AR model of order p [6], we have
( )
( ) ( )
( )
1 -p x k x x t α k x t k = =∑
+u t y + (1) (2)( )
( ) ( )
( )
1 -p y k y t α k y t k u t = =∑
where ux
( )
t and uy( )
t are white Gaussian noises realizations. If we model conjointly the pair (x t( )
, y t( )
) by bivariate AR models of order p, we write( )
( ) ( )
( ) ( )
(
1 1 p p xx xy x k k)
x t α k x t k α k y t k w = = =∑
− +∑
− + t (3)
( )
( ) ( )
( ) ( )
( )
1 1 p p yx yy y k k y t α k x t k α k y t k w t = = =∑
− +∑
− + (4)where wx
( )
t and wy( )
t are white Gaussian noises realizations. The LGCI from y to x is evaluated by( )
(
)
( )
(
)
var ln var x y x x u t LGCI w t → = . (5)Considering the more complicated issue of real data [7], we define a selective index of the flow direction, named DLGCI, as y x x y y x y x x y LGCI LGCI DLGCI LGCI LGCI → → → → − = + → (6) if the denominator is non null. Otherwise, this index is set to zero.
B. Transfer Entropy
In the sequel, ( )unp denotes a p-tuple . Considering a -order Markov process X, the conditional probability measures (continuous or discrete) are such that:
1 , ..., n n n p u u − u − + ⎡ 1 ⎣ ⎤⎦ th k ( ) ( )
(
)
( ) ( )' '(
)
1/ 1 1/ 1 ' : k k k k n n n n n n n n X X x X X x k k P dx P dx + = + + = + ∀ > = .(7)The relation in (7) can be extended to the case of “Markov interdependence” of two random processes X and Y. In the same way, the absence of information flow from Y to X can be formalized by ( ) ( )
( )
( ) ( ) ( ) ( )' '( )
1/ 1/ , . k k k k l l n n n n n n n n X X x X X x Y y P P + = = + = = . . (8)So, in this absence of information flow, the Y process values ( )l
n
y have not influence on the X transition probabilities from state value ( )xnk to state value xn+1. The deviation from this assumption can be quantified using the Kullback entropy, which leads to the definition of the transfer entropy
( ) ( )
(
( ) ( ))
( ) ( ) ( ) ( ) ( ) ( )(
)
' 1 1, , ' 1 ' 1 1 / , 2 / , , log k l k l Xn Xn Yn k k l l n n n n n k k n n n k l X Y n n n X X x Y y n X X x TE P dx dx dy dP x dP + + + + + → + = = + = = ⎛ ⎡ ⎜ ⎢ × ⎜ ⎢ ⎜ ⎣⎝∫
{ 1 ⎞ ⎤ ⎟ ⎥ ⎟ ⎥ ⎟ ⎦ ⎠ (9)where the ratio in (9) corresponds to a derivative of the conditional measure in the numerator with respect to the conditional measure in the denominator. This measure is not symmetric
(
TEX→Y ≠TEY→X)
. The value of k can bedetermined heuristically from the autocorrelation function of
X. For the parameter l , a natural choice is to take l= , if we 1 consider that the current state of the driving system is sufficient to modify the dynamics of the driven one. The estimation of TE from the observations
(
xn,yn)
,n=1,...,N, can be obtained [3] using a discrete kernel estimation ofdistribution: ( ) ( )
(
1, ,)
k l n n n X + X Y ( ) ( )(
)
( ) ( ) ( ) ( ) 1 1 1 , ˆ , , , 1,..., 1 n m k l k k n n n n m m l l n m n r x x P x x y x x r y y C n k N + + + ⎛⎛ − ⎞ ⎞ ⎜⎜ ⎟ ⎟ ⎜ ⎟ ∝ Θ ⎜ − ⎟− ⎜⎜⎜ ⎟⎟ ⎟ ⎜⎝ − ⎠ ⎟ ⎝ ⎠ = + −∑
5 (10)which depends on a neighborhood size (radius ). Then, it can be used to compute the estimation
r «
(
( ) ( ))
(
( ) ( ))
( )(
1)
1 2 1 ˆ | , ˆ , , log ˆ | k l n n n k l y x n n n k n n n P x x y TE P x x y P x x + → + + =∑
(11)Practically, the estimations of conditional probabilities in (11) are computed from estimated joint probabilities in (10).
The function Θ
( )
. is defined by the step kernel(
x 0)
1Θ > = , Θ ≤ =
(
x 0)
0; the norm • is the maximum distance norm and the summation is performed for[
1,..., 1]
m∈ +k N− by excluding some evident redundancies. The value of r is chosen in the linear region of the curve
( )
ln C r vs. ln obtained as an average of n over . As previously, we define a selective index of the flow direction, named DTE, by r Cn r, y x x y y x y x x y TE TE DTE TE TE → → → → → − = + (12)
if the denominator is non null. Otherwise, this index is set to 0.
C. Model of iEEG Signals Generation
We used a physiology-based time continuous (Stochastic Differential Equation) model to represent the electrical field activity of some distant - and possibly coupled - neuronal populations. Each of them generates a local field activity that can be converted to an iEEG signal in a proximal electrode using a quasi-static transfer function [8]. In the model, each population contains three subpopulations of neurons that mutually interact via excitatory or inhibitory feedback linking main pyramidal cells and two other types of local interneurons. Since pyramidal cells are excitatory neurons that project their axons to other areas of the brain, the model accounts for this organization by using the average pulse rate of action potentials from the main cells of one population as an excitatory input to main cells inputs of another population j. In addition, this connection from population i to j is represented by a parameter K
i
ij
which is proportional to the number of corresponding axonal links. Appropriate setting of this parameter allows for building systems where the neuronal populations are unidirectionally or bidirectionally coupled. Other introduced parameters are intra-population parameters. They include excitatory and inhibitory gains in feedback loops as well as coefficients related to the numbers of synaptic contacts between subpopulations. These parameters are adjusted to control the intrinsic activity of each population (normal background versus epileptic activity).
III. RESULTS
Simulations were carried out 100 times on 4096-point signals (which corresponds to 8 s of real EEG signals in current acquisition systems). In the following tables, the first value represents the mean of the indicator and the value in parentheses is the standard deviation. Simulation models were of two types: a “black box” linear three-population model (subsection A) and a physiological non linear three-population model (subsection B). Indices DLGCI (6) and DTE (12) were estimated for populations pairs by using LGCI and TE respectively in place of their theoretical values.
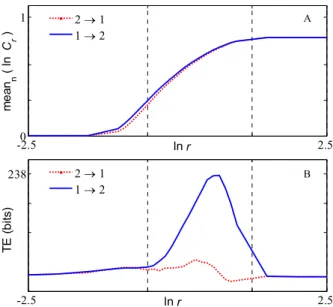
-2.50 2.5 1 ln r me a n n ( ln C r ) -2.5 2.5 238 ln r T E ( b it s ) 2 → 1 1 → 2 2 → 1 1 → 2 A B
Fig. 1. Results of Transfer Entropy between signals x1 and x2 in linear system. A. Plot of the mean of Cn,r with respect to n vs. r (in ln scale), where Cr and r denote average joint probability and radius in the state space respectively. B. Plot of TE (bits) vs. radius r (in ln scale), for direction of flow 1 2 (blue solid line) and 2 1 (red dotted line).
TABLEIII
RESULTS ON TE IN LINEAR SYSTEM
i j x → x i = 1 i = 2 i = 3 j = 1 - -1.8172 (1.2036) 15.5103 (2.2014) j = 2 235.1368 (9.0220) -4.0365 (1.0664) j = 3 91.4938 (4.5943) 40.4462 (2.3031) - TABLEIV
RESULTS ON DTE IN LINEAR SYSTEM
x1 x2 1.0000
x1 x3 0.7101
x2 x3 0.8185
A. Linear System
For the linear stochastic system we considered, the following three signals were generated:
( )
( )
( )
(
( )
( )
( )
( )
( )
( )
1 1 1 2 1 2 3 2 3 0.95 2 1 0.9025 2 0.5 1 0.8 2)
1 x t x t x t w x t x t w t x t x t w t ⎧ = − − − + ⎪ = − − + ⎨ ⎪ = − + ⎩ t (13)where wj
( )
t , , were independent white Gaussian noises with zero means and unit variances. For each pair of signals, k and l were estimated by Akaike’s criterion.1, 2, 3 j=
• Results on LGCI and DLGCI
The means and standard deviations of these indices are reported in Table I. From Table I, when a causality relation exists (e.g. x1→ , x2 x1→ , x3 x2→ ), the corresponding x3
reveals an important value, and when there is no causal relation (
LGCI
2 1
x → , x x3→ , x1 x3→ ), the LGCI remains x2
close to zero. In the same way, the selective index DLGCI correctly points up all information flow directions (see Table II) with the same order of magnitude.
• Results on TE and DTE
From the Section II.B, the estimation of TE also depends on the neighborhood size (radius r). The results of the mean of
Cn,r with respect to n vs. r (in ln scale) between signals x1 and
x2 are plotted in Fig. 1A. The corresponding TE values vs. ln r
are plotted in Fig. 1B. From this figure, we can find that TE can correctly point out the information flow direction in the linear region (delimited by the two vertical dash lines). For all pairs of signals, the parameters k and were in the range [2; 7], and
l
[
1; 2.2]
r . In Table III, TE values correspond to the optimal values of r for the different pairs. From this table, we note a very high value of TE from signal 1 to signal 2 compared to the other ones. The strong relation is highlighted in Table IV using DT , and this index is also successful in drawing up the complete propagation graph.
TABLEI
RESULTS ON LGCI IN LINEAR SYSTEM
i j x → x i = 1 i = 2 i = 3 j = 1 - 0.0010 (0.0019) 0.0016 (0.0023) j = 2 0.8802 (0.0619) - 0.0115 (0.0071) j = 3 0.4644 (0.0376) 0.8782 (0.0469) - TABLEII
RESULTS ON DLGCI IN LINEAR SYSTEM
x1 x2 0.9977 x1 x3 0.9931 x2 x3 0.9741 ∈ E B. Physiology-based Model
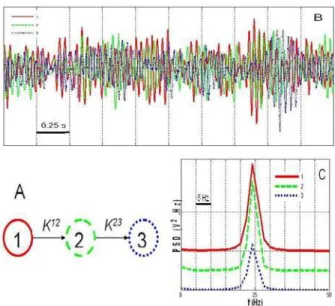
The model described in Section II.C was used to simulate long duration signals (400 s) for a fixed connectivity pattern (“ground truth”) among neuronal populations, as illustrated in Fig. 2A and Fig. 2B. Sampling rate was equal to 256 Hz. Model parameters were such that a fast quasi-sinusoidal (25 Hz) activity (similar to that observed at seizure onset) was
generated by the three populations when they were uni-directionally coupled (Fig. 2C). The coupling parameters were such as: K12=K23= =K 1500.
Fig. 2. Simulated signals. A. Considered scenario for connectivity among neuronal populations. Epileptic activity in population 2 (resp. 3) is caused by excitatory drive from population 1 (resp. 2). B. An example of output signals when populations are coupled. Time delays are not constant over time. C. Power spectral densities (PSD) of the signals are similar and match those observed in depth-EEG signals at the onset of seizures.
TABLEV
RESULTS ON LGCI IN PHYSIOLOGY-BASED MODEL
i j P→ P i = 1 i = 2 i = 3 j = 1 - 0.0064 (0.0046) 0.0058 (0.0054) j = 2 0.0209 (0.0099) - 0.0062 (0.0047) j = 3 0.0059 (0.0057) 0.0107 (0.0073) - TABLEVI
RESULTS ON DLGCI IN PHYSIOLOGY-BASED MODEL
P1 P2 0.5311
P1 P3 0.0085
P2 P3 0.2663
TABLEVII
RESULTS ON TE IN PHYSIOLOGY-BASED MODEL
i j P→ P i = 1 i = 2 i = 3 j = 1 - -0.1384 (0.3601) 0.1237 (0.1662) j = 2 2.9467 (1.0288) -0.1405 (0.1672) j = 3 0.3689 (0.1487) 0.3474 (0.1579) - TABLEVIII
RESULTS ON DTE IN PHYSIOLOGY-BASED MODEL
P1 P2 1.0000
P1 P3 0.4978
P2 P3 0.4241
• Results on LGCI and DLGCI
From Tables V and VI, when no causal relation exists, i.e.
2 1
P → , P P3→ and P1 P3→ , the averaged LGCI are very P2 similar (around 0.006). In comparison, is much
greater, but and are not so important
in spite of the relation between populations 2 and 3. As for
1 2 P P LGCI → 1 3 P P LGCI → 2 3 P P LGCI →
DLGCI , this index allows detecting the causal relation
between populations 2 and 3, but, in this particular case, it fails in detecting the indirect relation from population 1 to 3.
• Results on TE and DTE
Simulations were carried out with the following parameters: , and
16
k= l=1 r∈
[
0.2; 3.0]
. From Tables VII and VIII, it comes out that all information flows are correctly detected ( P1→P2 , P1→P3 and P2→P3 ). andare significant and the indicator succeeded in finding the indirect causal relation
1 2 P P DTE → 2 3 P P DTE → 1 3
P → which was not the P
case with the LGCI based measure.
C. Disconnected Populations
For pairs of disconnected populations ( Kij=Kji=0 , results not reported here), DLGCI and DTE are theoretically equal to zero, but an error in estimating LGCI and TE can induce large errors in DLGCI and DTE estimations. This is not a major issue. It only implies to first test the existence of a statistically significant link between X and Y (without searching directionality information) before measuring DLGCI and/or DTE. A standard method to perform this test is to use the H2 regression index as in [9].
IV. CONCLUSION
In this paper, we focused on extracting information on the flow direction in multi-channel EEG recordings. For iEEG signals simulated by a physiologically-plausible model, the TE based approach performs better than the LGCI based one, particularly in the detection of indirect causal relations. Furthermore, the DTE index places emphasis on the direction of propagation. In a future work, we plan to test other types of epileptic signatures and to extend this study to the case of bidirectional flows.
ACKNOWLEDGMENT
This work was supported by China Scholarship Council (CSC) under Grant No. 2008609145.
REFERENCES
[1] J. J. Engel, P. C. Van Ness, T. B. Rasmussen, and L. M. Ojemann, Outcome with respect to epileptic seizures. New York: Raven Press, 1993.
[2] C. W. J. Granger, "Investigating causal relations by econometric models and cross-spectral methods," Econometrica, vol. 37, pp. 424-438, 1969. [3] T. Schreiber, "Measuring information transfer," Physical review letters,
vol. 85, pp. 461-464, 2000.
[4] S. Sabesan, K. Narayanan, A. Prasad, L. D. Iasemidis, A. Spanias, and K. Tsakalis, Information Flow in Coupled Nonlinear Systems: Application to the Epileptic Human Brain. New York: Springer, 2007. [5] S. Sabesan, L. Good, K. Tsakalis, A. Spanias, D. Treiman, and L.
Iasemidis, "Information Flow and Application to Epileptogenic Focus Localization From Intracranial EEG," IEEE transactions on neural systems and rehabilitation engineering: a publication of the IEEE
Engineering in Medicine and Biology Society, vol. 17, pp. 244-253, 2009.
[6] C. M. Hurvich and C. L. Tsai, "A corrected Akaike information criterion for vector autoregressive model selection," Journal of time series analysis, vol. 14, pp. 271-279, 1993.
[7] J. W. H. Schnupp, T. M. Hall, R. F. Kokelaar, and B. Ahmed, "Plasticity of temporal pattern codes for vocalization stimuli in primary auditory cortex," Journal of Neuroscience, vol. 26, pp. 4785-4795, 2006. [8] F. Wendling, A. Hernandez, J. J. Bellanger, P. Chauvel, and F.
Bartolomei, "Interictal to ictal transition in human temporal lobe epilepsy: insights from a computational model of intracerebral EEG," Journal of Clinical Neurophysiology, vol. 22, pp. 343-356, 2005. [9] F. Wendling, F. Bartolomei, J. J. Bellanger, and P. Chauvel,
"Interpretation of interdependencies in epileptic signals using a macroscopic physiological model of the EEG," Clinical neurophysiology, vol. 112, pp. 1201-1218, 2001.