Publisher’s version / Version de l'éditeur:
Journal of The Electrochemical Society, 151, 7, pp. A950-A957, 2004
READ THESE TERMS AND CONDITIONS CAREFULLY BEFORE USING THIS WEBSITE. https://nrc-publications.canada.ca/eng/copyright
Vous avez des questions? Nous pouvons vous aider. Pour communiquer directement avec un auteur, consultez la première page de la revue dans laquelle son article a été publié afin de trouver ses coordonnées. Si vous n’arrivez pas à les repérer, communiquez avec nous à [email protected].
Questions? Contact the NRC Publications Archive team at
[email protected]. If you wish to email the authors directly, please see the first page of the publication for their contact information.
NRC Publications Archive
Archives des publications du CNRC
This publication could be one of several versions: author’s original, accepted manuscript or the publisher’s version. / La version de cette publication peut être l’une des suivantes : la version prépublication de l’auteur, la version acceptée du manuscrit ou la version de l’éditeur.
For the publisher’s version, please access the DOI link below./ Pour consulter la version de l’éditeur, utilisez le lien DOI ci-dessous.
https://doi.org/10.1149/1.1753580
Access and use of this website and the material on it are subject to the Terms and Conditions set forth at
Functionally graded cathode catalyst layers for polymer electrolyte fuel
cells. I, Theoretical modeling
Wang, Qianpu; Eikerling, Michael; Song, Datong; Liu, Zhongsheng;
Navessin, Titichai; Xie, Zhong; Holdcroft, Steven
https://publications-cnrc.canada.ca/fra/droits
L’accès à ce site Web et l’utilisation de son contenu sont assujettis aux conditions présentées dans le site
LISEZ CES CONDITIONS ATTENTIVEMENT AVANT D’UTILISER CE SITE WEB.
NRC Publications Record / Notice d'Archives des publications de CNRC:
https://nrc-publications.canada.ca/eng/view/object/?id=ea82abd5-7ec8-471c-80e4-1e7e7560696a
https://publications-cnrc.canada.ca/fra/voir/objet/?id=ea82abd5-7ec8-471c-80e4-1e7e7560696a
Functionally Graded Cathode Catalyst Layers for Polymer
Electrolyte Fuel Cells
I. Theoretical Modeling
Qianpu Wang,aMichael Eikerling,a,bDatong Song,aZhongsheng Liu,a,z Titichai Navessin,a,bZhong Xie,aand Steven Holdcrofta,b
aInstitute for Fuel Cell Innovation, National Research Council Canada, Vancouver, British Columbia V6T 1W5, Canada
bDepartment of Chemistry, Simon Fraser University, Burnaby, British Columbia V5A 1S6, Canada
The effect of Nafion loading on the electrode polarization characteristics of a proton exchange membrane fuel cell is studied with a macrohomogeneous model. The composition dependence of performance is rationalized by first relating mass fractions of the different components to their volume fractions and thereafter involving concepts of percolation theory to parameterize effective properties of the cathode catalyst layers. In particular, we explore systematically the effect of Nafion content on the performance. For a uniform layer, the best performance is obtained with a Nafion content of about 35 wt %, representing an optimum balance of proton transport, oxygen diffusion, and electrochemically active surface area. With the help of this modeling tool, we propose a nonuniform Nafion catalyst layer and the modeling indicates that such a layer improves performance. Our preliminary experi-ments ~to appear in Part II! confirm this claim. The two cases of nonuniform Nafion distribution across the entire thickness include: a three-sublayer structure with equally thick layers, simulating a constant gradient, and a two-sublayer structure with variable thickness of the sublayers. Compared with the optimum Nafion content ~35 wt %! in uniform distribution, the three-sublayer structure with higher Nafion content on the membrane side exhibits significantly enhanced performance.
© 2004 The Electrochemical Society. @DOI: 10.1149/1.1753580# All rights reserved.
Manuscript submitted August 11, 2003; revised manuscript received January 6, 2004. Available electronically May 19, 2004.
Despite enormous improvements, major voltage losses in poly-mer electrolyte fuel cells ~PEFCs! are still due to the poor kinetics of the oxygen reduction reaction ~ORR! and transport limitations of protons and reactants in cathode catalyst layers. The kinetics of ORR at platinum/polymer electrolyte interfaces has been investi-gated extensively for several decades1-8with the objective of im-proving catalyst efficiency and reducing voltages losses.9,10 High efficiencies for ORR with electrodes containing low platinum load-ings have been achieved by incorporating Nafion ionomer into the matrix of carbon-supported Pt/C.11-13
Cathode catalyst layers in PEFCs are thin films sandwiched be-tween membranes and gas diffusion layers ~GDL, carbon paper or carbon cloth!. The major ingredients of catalyst layers are Nafion and Pt/carbon black. The common methods of preparation, including brushing, printing, and spray deposition followed by drying, lead to a porous microstructure. The distribution of ingredients and the fab-rication process dictate the distribution of pores and networks, which form the pathways of reactant transport to the three-phase boundaries where the electrochemical reactions take place.
Many experimental studies have been performed on the optimi-zation of the catalyst layer composition.9,14-23The study by Uchida
et al.15,16 focused on the role of the gas-supplying network. Lee
et al.18 evaluated the effect of Nafion loading on charge-transfer resistance and mass transport. Recently, Antolini et al.19and Passa-lacqua et al.23 determined an optimum Nafion content of 33-40 wt %. Experimental findings suggest that Nafion primarily fills macropores, thereby increasing the Ptuionomer contact area and im-proving proton conductivity.15,16At high Nafion loading, however, extensive blocking of macropore space results in diminishing both the rate of oxygen supply and the rate of water removal.
The purpose of this work is to further understand the role of Nafion in fuel cell catalyst layers. This is achieved by exploring a macrohomogeneous modeling approach, which relates the contents of C, Pt, and Nafion to the current-voltage characteristics. An at-tempt to theoretically rationalize the experimentally observed com-position dependence was first described in Ref. 8 and 24 based on a two-phase balance of electrolyte and gas pores within preformed void space within the carbon/catalyst matrix. Following this, the full
interplay between volume portions of ionomer, carbon/catalyst, and pores was considered in Ref. 25, using concepts of percolation theory.
In this work, we first establish relations between weight fractions and volume fractions. Thereafter, the effect of Nafion loading on the electrode performance is rationalized using the macrohomogeneous model.8,26-30 After determining the optimum Nafion content of a uniform catalyst layer as a baseline, alternative design options using nonuniform distributions of Nafion are systematically explored.
Model Description
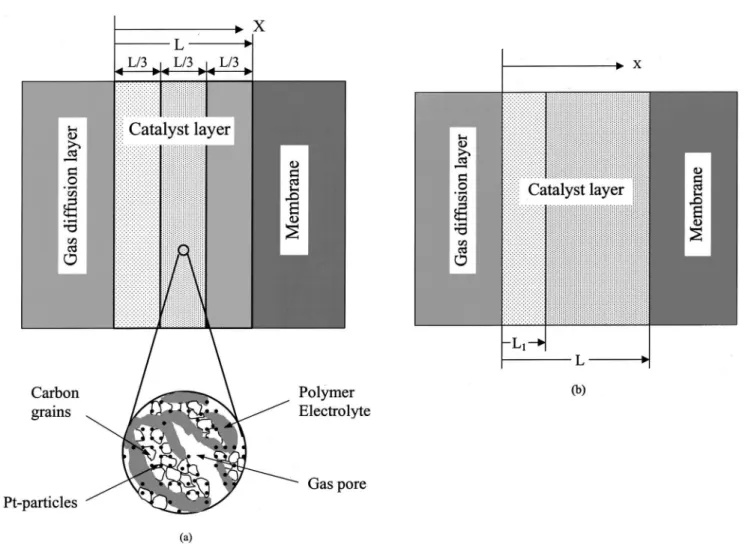
For modeling purposes, the cathode catalyst layer ~CL! is as-sumed to consist of a matrix of carbon and catalyst platinum, with ionomer electrolyte and pore space distributed homogeneously within. The microstructure of the catalyst layer, which identifies the distinct solid phases and gas pores, is shown in Fig. 1a. The spatial coordinate x is defined in Fig. 1, with positive direction pointing from the gas GDLuCL interface toward the membrane. Protons dif-fuse into the catalyst layer from the membrane side on the right and oxygen diffuses into the layer from the GDL on the left. On the surfaces of finely dispersed catalyst particles, oxygen is consumed together with protons, producing liquid water along with waste heat. The cathodic half-reaction is
4H11 4e21 O
2→ 2H2O @1#
The dissolution of oxygen in the electrolyte is considered to be a fast process. The local concentration of oxygen in the electrolyte is assumed to be proportional to the gas-phase oxygen concentration in the same local volume element, determined by Henry’s law. The product water is assumed to be removed efficiently. The oxygen flux, NO2, through the catalyst layer is assumed to be driven by a concentration gradient. It is thus determined by Fick’s law of diffu-sion dcO2 dx 5 2 NO2 DO 2 eff @2# with zE-mail: [email protected]
NO
2~ x ! 5 2
j~ x ! 2 I0
4F @3#
Here, cO2 represents the oxygen concentration, DO2
eff is an effective oxygen diffusion constant, j(x) is the local proton current density, and I0is the total current density through the cell.
Ohmic losses due to electronic transport are neglected, assuming a good conductivity of the carbon/catalyst phase. The Pt/C phase is thus considered to be equipotential, fm5 0. The local electrode potential, h(x), defined as the difference in electrical potentials be-tween metal phase ~Pt/C! and electrolyte phase, is thus solely deter-mined by the local electrolyte potential, h(x) 5 fs2 fm 5 fs(x). Proton migration in the ionomer phase can be described by Ohm’s law
dh~ x !
dx 5 j~ x !
seff @4#
seffis the effective ionic conductivity of the layer. The boundary conditions are
x 5 0 j~ x 5 0! 5 0 cO 25 cO*2 @5# x 5 L j~ x 5 L! 5 I0 dcO 2 dx 5 0 @6#
which express that the oxygen flux is zero at the catalyst layer/ membrane interface and the oxygen concentration at the GDLuCL interface is cO*2.
The ORR kinetics follows Tafel law and is of first order in oxy-gen concentration4 d j~ x ! dx 5 Sa effi 0 ref
FS
cO2,l c0refD
expS
acF RT h~ x !D
2 expS
2~ 1 2 aRTc!Fh~ x !D
G
@7# where c0ref is the reference oxygen concentration and i0refis the ref-erence exchange current density, Saeffis the electrochemically active Ptuionomer contact area per unit volume, and cO2,lis the dissolved oxygen concentration in the electrolyte, determined by Henry’s law26cO
2,l5 cO2/KO2 @8#
KO2is Henry’s constant for oxygen gas dissolution in the ionomer. It
is calculated from the empirical relation28-30
KO25
1
RTexp
S
2666
T 1 14.1
D
@9#Figure 1.Schematic picture of the of cathode catalyst layer with nonuniform composition: ~a! three-sublayer design with ‘‘constant’’ Nafion gradient and ~b! two-sublayer design with nonconstant Nafion gradient.
Three effective parameters DOeff2, seff, and Saeffare determined by the volume fractions of the catalyst layer components, which are dis-cussed in the next section.
Percolation Properties
Parameterizations of catalyst layer properties as functions of composition refer to the class of percolation problems, cf. Ref. 8, 24-28,31,32. The percolation model was discussed by Hammersley33in 1957 and has since found numerous applications. Here we employ the percolation model proposed in Ref. 8 and 25 for the cathode catalyst layer.
The effective proton conductivity is determined by the volume fraction of the ionomer electrolyte, expressed as8,24
seff 5 ss
~ Xel2 X0!t ~ 1 2 X0!t
Q~ Xel2 X0! @10#
where ssis the bulk proton conductivity; t is the critical exponent, t ' 2,34-36; Q is the Heaviside step function, which accounts for zero conductivity below the percolation threshold; X0 is the perco-lation threshold; and Xelis the volume portion of the electrolyte.
Consideration of oxygen transport in the catalyst layer is more complex. Oxygen transports to the reaction sites in two ways: gas phase diffusion through a percolation cluster of gas pores and re-sidual diffusion of dissolved oxygen through ionomer electrolyte. The bulk diffusion coefficient in the gas channel is larger than in the electrolyte by a factor of 104-105. The latter is considered by a residual diffusivity, and the effective diffusion coefficient can be expressed as,8,24,25,34,35 DOeff25 DO2 ~ 1 2 X0!t1 d @~ 1 2 XPt2 XC2 Xel2 X0!tQ 3 ~ 1 2 XPt2 XC2 Xel2 X0! 1 d# @11# where DO2is the bulk oxygen diffusion coefficient. The coefficient d
accounts for the resident diffusivity due to diffusion through mi-cropores or polymer materials as these pathways remain intact, if even all macropores are blocked by electrolyte. XPtis the volume fraction of platinum and XC, the volume fraction of carbon. The volume fraction of the remaining open pore space is then given by
XV5 1 2 XPt2 XC2 Xel. The critical exponent of diffusion, t, is universal for standard lattice percolation.35Values of t ' 2 are suggested in three dimensions by theoretical studies. However, we are aware that for specific structures, including fibrous structures32
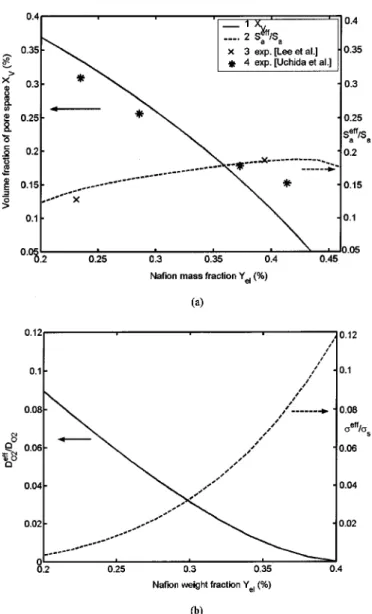
Figure 2. Dependence of catalyst layer parameters on Nafion weight frac-tion: ~a! comparison of volume fraction of pore space XVand
electrochemi-cally active surface area (Saeff/S
a) with experimental data15-16,18and ~b!
oxy-gen diffusion coefficient (DO
2 eff/D
O2) and effective proton conductivity
(seff/s
s) ~no experimental measurement available!.
Table I. The base-case conditions and physical properties.
Parameter Value
The platinum surface area per unit mass of the platinum, As 1120 cm
2/mg
Oxygen concentration on the interface of GDL and catalyst layer, cO
2
* 7.9239 3 10
26mol/cm3
Oxygen reference concentration, c0ref 1.2 3 1026mol/cm3
Residual diffusivity, d 1 3 1024
Bulk oxygen diffusion coefficient, DO2 0.2585 cm2/s
Reference exchange current density, i0ref 1.3183 3 1029A/cm2
Catalyst layer thickness, L 1.8 3 1023cm
Platinum loading in the catalyst layer, mPt 0.42 mg/cm
2
Cell temperature, T 323 K
Percolation threshold, X0 0.1
Platinum mass fraction on carbon black, YPt 20%
Density of carbon, rC 2 3 103mg/cm3
Density of platinum, rPt 2.15 3 104mg/cm3
Density of electrolyte ~Nafion!, rel 1.9 3 103mg/cm3
Proton bulk conductivity, ss 0.07 S/cm
and for distinct types of continuum percolation models, e.g., the so-called Swiss cheese model,37different critical exponents could be found. However, in view of the yet unresolved structural picture of CL we believe that t ' 2 is a reasonable choice, because it appar-ently can be used for a broad class of random heterogeneous struc-tures.
The platinum electrochemical active area is the specific area of the Pt/ionomer interface which is accessible for protons as well as for oxygen and it depends on the volume fractions of Pt/C, electro-lyte, and pore space. It is logical to adopt a parameterization that rests on the theory of active bonds in dual porous composite materials25so that
Saeff5 Sa$P~ Xel!P~ XPt1 XC!⌊~ 1 2 x!~1 2 @1 2 P~XV!#M! 1 x@1 2 P~ XV!#M⌋% @12#
Here, Sa is the total specific platinum area ~in cm2/cm3!, propor-tional to the platinum loading and catalyst layer thickness, which can be expressed by
Sa5 As
mPt
L @13#
where mPtis the platinum loading and Asis the platinum surface area per unit mass of the platinum. x accounts for the residual elec-trochemical active area of fully flooded domains in the catalyst layer. The factor P(Xel) P(XPt1 XC) in Eq. 12 takes into account the probability of an interface between a carbon/catalyst and an electrolyte particle with both of them connected to their correspond-ing infinite clusters. P(X) is the density of an infinite cluster of a percolating component, determined by25
P~ X ! 5 X
@1 1 exp@2a~X 2 X0!##b
@14#
with a 5 53.7, b 5 3.2, and the parameter M is the average number of bond neighbors (M 5 4).
Constitutive Relations between Weight Fractions and Volume Fractions
From a statistical or mathematical modeling point of view, the effective properties are determined by the volume fractions of dis-tinct components. By using percolation theory the effect of these volume fractions on proton conductivity, oxygen diffusion coeffi-cient, and exchange current density can be rationalized. In experi-mental investigations, the composition is usually specified in terms of weight fractions, which are readily controlled during the fabrica-tion process. It would, thus, be very useful to link the performance directly to the weight fractions of the catalyst layer components. The volume fractions of distinct components can be expressed via weight fractions, catalyst loading, and catalyst layer thickness using the following relations
XV5 1 2
F
r1 Pt 1 1 2 YPt YPtrc 1 Yel ~ 1 2 Yel!YPtrelG
mPt L @15# XPt5 mPt L 1 rPt @16# XC5mPt L 1 2 YPt YPtrC @17# Xel5 mPt L Yel ~ 1 2 Yel!YPtrel @18# where YPtis the platinum mass fraction on the supported carbon black. Yelis the mass fraction of electrolyte ~electrolyte loading!, which is determined from the percentage of electrolyte and total catalyst weight using the following relation19Yel
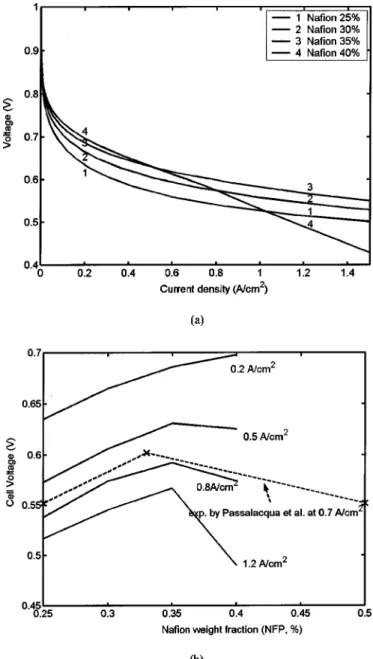
Figure 3. Dependence of catalyst layer performance on Nafion weight frac-tion for uniform layers: ~a! I-V plots of the catalyst layer and ~b! cell poten-tial as a function of Nafion weight fraction for different current densities. Experimental data23are shown for comparison. The experimental data have
been corrected for the membrane contribution, displaying only the contribu-tion of the cathode catalyst layer to the fuel cell voltage.
Table II. Influence of Nafion loading on fuel-cell performance, comparison of modeling and experimental data.
Reference Conditions Optimum Nafion content wt % Pt/C wt % Pt loading ~mg/cm2!
Modeling, this work 20 0.42 35
Exp. by Uchida et al.15 25 2 33
Exp. by Paganin et al.17 10 4 30-35
Exp. by Antolini et al.19 20 1 40
Exp. by Passalacqua et al.23 20 0.5 33
5 mg electrolyte cm 22
~ mg electrolyte cm22! 1 mg Pt cm221 mg carbon cm22 @19# Here, adopting the catalyst layer preparation method of impregnat-ing Nafion into the electrode, we assume that the carbon and Pt phases form a solid matrix with an initial volume fraction of void space XV(Yel5 0). The voids are either filled by Nafion or remain Nafion-free. It is assumed that Nafion can impregnate the void space without affecting the thickness of catalyst layer or its total volume.
Results and Discussion
The set of governing differential equations, Eq. 2-4, was solved using MATLAB software.38The base-case conditions and physical properties are given in Table I.
Parameterization of composition dependence.—Based on Eq. 10-12, the dependencies of the elementary parameters on the elec-trolyte content can be determined. Figure 2a shows the resulting volume fraction of pore space and electrochemically active surface area ~ESA! as functions of the Nafion weight fraction. The volume fraction of the pore space decreases with increasing Yel. Saeffgoes up gradually with Yeland peaks at Yel5 43 wt %; after that it falls slowly. In Fig. 2b, dependencies of the effective oxygen diffusion coefficient and effective proton conductivity on Yelare presented. The effective oxygen diffusion coefficient drops with an increase of
Yel, but there is an opposite trend in the proton conductivity. These data clearly reflect the competition between the three major param-eters ~proton transport, oxygen supply, and ESA!.
The experimental studies relating the effects of Yelto the catalyst layer parameters have been presented by Uchida et al.15,16and Lee
et al.18Uchida et al. prepared the electrode by directly mixing the ionomer with 25 wt % platinum-loaded carbon to form colloids, while Lee et al. impregnated the Pt/C catalyst layer with different loadings of solubilized Nafion, in a manner similar to the conditions assumed in our model. The specific pore volume ~cm3/g! was mea-sured for varying ionomer content by Uchida et al., and active sur-face area ~cm2/cm2! was measured by Lee et al. These data are reproduced in Fig. 2a. According to Uchida et al., the volume of secondary pores ~macropores of size 40-200 nm formed between agglomerates! decreases linearly with increase in Yel, but that of the primary pores ~micropores of size 20-40 nm formed within agglom-erates! remains unchanged. Compared with experimental results by Uchida et al., the predicted volume fraction by assuming constant thickness in a certain Nafion content range is in reasonable agree-ment. The ESA of the electrode was measured by cyclic voltamme-try by Lee et al. The results show it increases with an increase in Yel up to 57.45 wt % Nafion. The theoretical result indicates that ESA decreases after the Nafion content exceeds 43 wt %. In the range of Nafion content between 20 and 40 wt %, the modeling is in reason-able agreement with experimental data. The adoption of parameter-izations that rest on the theory of active bonds in dual porous com-posites ~Eq. 12! is, thus, a reasonable approach to study composition-dependent physical properties of catalyst layers.
Effect of Nafion content on performance.—The dependence of catalyst layer performance on Yelfor a uniform CL is illustrated in Fig. 3. The curves demonstrate that there is an upward trend in performance in relation to Yel, and in the performance peaks at
Yel5 35 wt %, further increase in Yelenhances performance only at
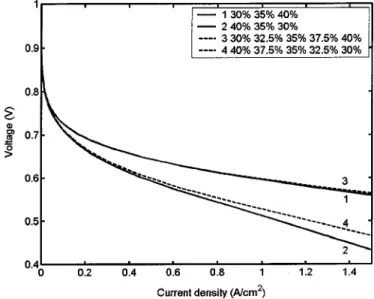
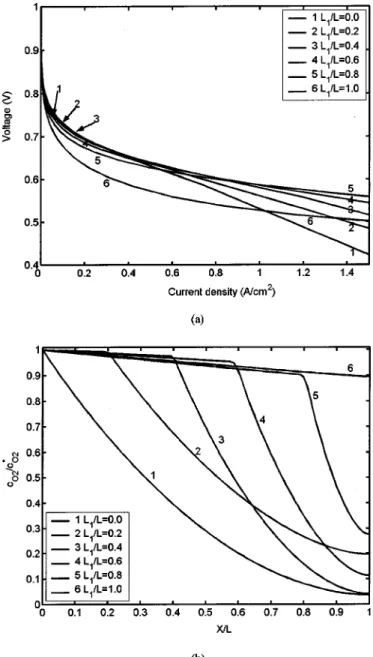
Figure 4.Performance dependence on Nafion weight fraction for nonuni-form Nafion distributions in the catalyst layer ~percent values refer to Nafion weight fraction in the sublayer!: ~a! catalyst layer polarization curves and ~b! oxygen concentration profiles at 0.6 V. In the legend, percent values refer to Nafion content in the sublayer. GDL is to the left and membrane is to the right.
Figure 5. Comparison of the polarization curves for three- and five-sublayer structure.
lower current densities, for which oxygen diffusion is not rate lim-iting. In this range, larger values of Yellead to a reduction of ohmic losses and thereby to improvement of the performance. At higher current density ~.0.5 A/cm2!, increasing Yelabove 35 wt % leads to the reduced performance because of its deleterious impact on oxy-gen diffusion.
The cell potential at several current densities is shown in Fig. 3b as a function of Yel, and is compared with experimental data re-ported by Passalacqua et al.23In the model, only the catalyst layer was considered. The experimental data reported by Passalacqua
et al. included the whole membrane electrode assembly ~MEA!. Therefore, an ohmic membrane contribution of 0.1225 V ~Nafion 117 with thickness 175 mm and proton conductivity 0.1 S/cm! was added to the experimental data at 0.7 A/cm2, so that only the effect of the cathode catalyst layer is displayed in Fig. 3b. The anodic overpotential is considered to be negligible. With this correction, Fig. 3b reveals good agreement between model results and experi-mental data. The same trend was reported by Uchida et al. Table II shows a comparison between the modeling results and the literature data. It was found that modeling results of optimal Yelare in the range of the literature data, particularly close to the results reported by Uchida et al. and Passalacque et al.
Nafion gradient in catalyst layer design.—The previous results demonstrated the competition between the three major parameters in the way that improving one parameter could lead to worsening of the other two. In order to further temper the distinct catalyst layer functions, we explore simple variants of functionally graded catalyst layer compositions. In this kind of design, the catalyst layer is pro-cessed as a sublayer structure with gradually varying composition. Two different options are investigated here: a three-sublayer struc-ture with equally thick sublayers, simulating a linear gradient, and a two-sublayer with varying thickness of sublayers simulating a non-linear gradient. The selection of the distinct sublayer structures was made in view of their possible practical fabrication. A simple way is to deposit additional Nafion into existing impregnated catalyst lay-ers. The Nafion solution penetrates to a certain depth, which can establish Nafion gradient in two-sublayer structures.
Three-sublayer structure (‘‘constant’’ gradient).—The catalyst layer is divided into three sublayers of identical thickness, shown in Fig. 1a. Three combinations of Yelare investigated. From the calcu-lation described previously, the optimum Yelfor homogeneous cata-lyst layer is 35 wt %; this is chosen as the baseline Yel. Figure 4a shows the effect of different Nafion distributions on the polarization curves. Case 1 is the baseline-homogeneous case, in which the vol-ume fraction of void spaces is about 19%. In case 2, Yelis 30 wt % on the GDL side, 35 wt % in the middle, and 40 wt % on the membrane side, in which the volume fractions of void spaces in the sublayers are about 26% ~GDL side!, 19% ~middle!, and 12% ~mem-brane side!. Case 3 is the reverse configuration to case 2. The results demonstrate that the Nafion gradient in the catalyst layer can play a significant role on the catalyst layer performance. Voltage losses are reduced by 3% at 0.8 A/cm2for case 2, in reference to the homoge-neous case. For case 3 with the higher Nafion content near the GDL side, the voltage loss increases by 10% at 0.8 A/cm2. The reason is straightforward as illustrated in Fig. 4b, which shows oxygen con-centration profiles along the thickness coordinate at cell potential 0.6 V. Compared with the baseline case, case 2 exhibits a more homo-geneous oxygen distribution throughout the catalyst layer; even though the oxygen concentration decreases fast in the sublayer on the membrane side, it is compensated by the increase of proton transport in this region. In case 3, a rapid decrease of the oxygen concentration is found in the catalyst layer near the GDL side. Due to the reduced rate of mass transfer, two thirds of catalyst layer operate under oxygen depletion.
Figure 5 shows comparisons of polarization curves for three and five sublayers. The results indicate no improvement by further sub-division of the catalyst layer for the favorable gradient with
en-hanced Yelon the membrane side. However, the performance of five sublayers is improved slightly for the opposite case because the oxygen diffusion resistance is reduced.
Nonconstant gradient.—The two-sublayer structure with non-constant composition gradient is shown in Fig. 1b. In the GDL side (L1), the Nafion loading is varied from 20 to 25 wt %. In the membrane side (L 2 L1), the Nafion loading is varied from 35 to 40 wt % and L1/L is varied from 0 to 1.
Figure 6 represents the polarization curves and the oxygen con-centration profiles in the catalyst layer in which the Nafion weight fraction is 25 wt % on the GDL side and 40 wt % on the membrane side. It can be seen that the voltage losses increase at lower current density and decrease at high current density when L1/L is changed from 0 to 1, which means the thickness with 25 wt % of Yel in-creases. This behavior can be explained physically as follows: at low current density the rate of oxygen diffusion is sufficiently fast com-pared to the rate of electrochemical reaction; as a result, higher Yel
Figure 6. Performance dependence on Nafion weight fraction for a noncon-stant Nafion gradient in the catalyst layer: ~a! catalyst layer polarization relations and ~b! oxygen concentration profiles at 0.6 V. ~Nafion weight fraction: 25u40 %.!
helps to increase the exchange current density and reduces voltage losses associated with proton transfer. A high cell current density consumes a large quantity of reactants, making oxygen supply the controlling process. Hence, a decrease in Yelis required for faster mass transfer of the reactant. Figure 6b shows the concentration profiles at cell voltage 0.6 V. It is found that with the Yeldecrease, the oxygen concentration profiles get more uniform.
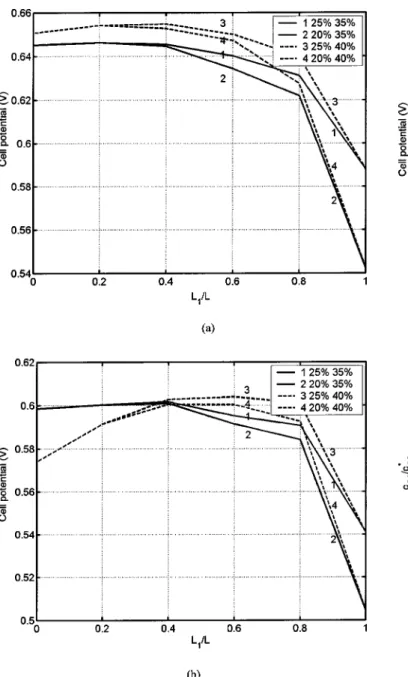
Figure 7 shows the cell potential with different L1/L and com-bination of Nafion gradients at current densities 0.4 and 0.8 A/cm2. Within the limited number of considered cases, the highest cell po-tential is obtained at L1/L ' 0.4 for 0.4 A/cm2 and at L1/L ' 0.6 for 0.8 A/cm2. Compared to the baseline case with uniform Nafion loading 35 wt %, the cell potential could be increased by 3-5% at 0.4 A/cm2and by 1-2% at 0.8 A/cm2.
Figure 8 presents the comparison of performance dependence on
Yelin two- and three-sublayers of catalyst layer. It can be found that the three-sublayer design with Nafion gradient ~30u35u40 wt %! has better performance than two-sublayer design ~30u35 or 25u40 wt %!.
Conclusions
The dependence of oxygen diffusion coefficient, proton conduc-tivity, ESA, and cathode performance on Nafion loading has been investigated. The model results reported in this paper indicate that an optimum Nafion content exists at 35 wt %. This finding is in accordance with experimental data in the literature.
The Nafion gradient for cathode catalyst layer has been demon-strated theoretically to have a significant influence on the cathode performance. Compared with the optimum Nafion content ~35 wt %! in uniform distribution, a simple variation of Nafion loading with lower Nafion content ~30 wt %! in the GDL side and higher Nafion content ~40 %! in the membrane side could reduce the voltage losses in the catalyst layer by 3-5%. This is the way to improve the catalyst layer structure by optimizing both oxygen diffusion and proton transport.
Furthermore, potential advantages of this design are lower ohmic resistance in the interfaces and better water management. In the interface between GDL and CL, lower Nafion loading decreases the
Figure 7. Cell potential with different L1/L at current density ~a! 0.4 and
~b! 0.8 A/cm2.
Figure 8. Comparison of performance dependence on Nafion weight frac-tion in two- and three-sublayer structures of catalyst layers ~two-sublayer
L1/L 5 0.5): ~a! polarization relations and ~b! oxygen concentration
probability of blockage of pores by Nafion and thereby facilitates water removal via the GDL. In the interface between CL and mem-brane, a higher Nafion loading increases the contact area between the electrolyte phases in the two media and thereby improves proton transport. Due to these effects, which are not considered in the present version of the model, even greater improvements in perfor-mance are expected with functionally graded catalyst layers.
Compared with constant Nafion gradient design in three-sublayer, nonconstant Nafion gradient with the two sublayers does not show much advantage in performance compared to the three sublayers; neither does a further subdivision into five or more sub-layers.
Experimental evaluation of the model is currently underway and will be reported later. However, the preliminary experiments showed an agreement. Further refinements of the model will involve a more detailed structural picture based on the agglomerate model and con-sideration of the water balance in the electrode.
Acknowledgment
The authors thank Dr. David Wilkinson for his comments of this paper.
The Institute for Fuel Cell Innovation, National Research Council of Canada, assisted in meeting the publication costs of this article.
List of Symbols
As the platinum surface area per unit mass of the platinum, cm2/mg cO*2 oxygen concentration on the interface of GDL and catalyst layer, mol/cm3 c0ref oxygen reference concentration, mol/cm3
cO2,l dissolved oxygen concentration in electrolyte, mol/cm 3 cO2 oxygen concentration in the gas phase, mol/cm3 DO2 bulk oxygen diffusion coefficient, cm2/s DO
2 eff
effective oxygen diffusion coefficient in gas phase, cm2/s F Faraday’s constant, C/mol
i0ref reference exchange current density, A/cm2 I0 total current density, A/cm2
j(x) local proton current density, A/cm2 KO2 oxygen Henry’s constant
L catalyst layer thickness, cm
L1 thickness of catalyst sublayer, cm
mPt platinum loading in the catalyst layer, mg/cm2 NO2 oxygen flux, mol/~cm2s!
R gas constant, 8.314J/~mol K!
Sa catalyst specific area per unit volume, cm2/cm3 Saeff effective catalyst specific area per unit volume, cm2/cm3
T cell temperature, K
X0 percolation threshold XC volume portion of carbon phase
XPt volume portion of platinum phase Xel volume portion of electrolyte XV volume portion of pore space YPt platinum mass fraction Yel mass fraction of electrolyte
Greek
rC density of carbon black, mg/cm3
rPt density of platinum, mg/cm3
rel density of electrolyte, mg/cm3
ss proton bulk conductivity, S/cm
seff
effective proton conductivity, S/cm ac cathode transfer coefficient
h(x) local electrode potential, V
References
1. A. Damjanovic and J. O’M. Bockris, Electrochim. Acta, 11, 376 ~1961!. 2. A. Damjanovic and V. Brusic, Electrochim. Acta, 12, 615 ~1967!.
3. A. Damjanovic, in Modern Aspects of Electrochemistry, Vol. 5, J. O’M. Bockris and B. E. Conway, Editors, p. 369, Plenum Press, New York ~1969!.
4. A. J. Appleby, in Modern Aspects of Electrochemistry, Vol. 19, B. E. Conway and J. O’M. Bockris, Editors, p. 369, Plenum Press, New York ~1974!.
5. S. Gottesfeld, I. D. Raistrick, and S. Srinivasan, J. Electrochem. Soc., 134, 1455 ~1987!.
6. E. Parthasarathy, S. Srinivasan, and J. Appleby, J. Electrochem. Soc., 139, 2530 ~1992!.
7. P. D. Beattie, V. I. Basura, and S. Holdcroft, J. Electroanal. Chem., 468, 180 ~1999!.
8. M. Eikerling and A. A. Kornyshev, J. Electroanal. Chem., 453, 89 ~1998!. 9. Z. Poltarzewski, P. Staiti, A. Redondo, and S. Srinivasan, J. Electrochem. Soc., 139,
761 ~1992!.
10. E. Passalacqua, F. Lufrano, G. Squadrio, A. Patti, and L. Giorgi, Electrochim. Acta,
43, 3665 ~1998!.
11. E. A. Ticianelli, J. G. Berry, and S. Srinivansan, J. Appl. Electrochem., 21, 597 ~1991!.
12. I. D. Raistrick, U.S. Pat. 4,876,115 ~1989!.
13. S. Srinivansan, E. A. Ticianelli, and C. R. Derouin, J. Power Sources, 22, 359 ~1988!.
14. M. S. Wilson and S. Gottesfeld, J. Appl. Electrochem., 22, 1 ~1992!.
15. M. Uchida, Y. Aoyama, E. Eda, and A. Ohta, J. Electrochem. Soc., 142, 463 ~1995!. 16. M. Uchida, Y. Aoyama, E. Eda, and A. Ohta, J. Electrochem. Soc., 142, 4143
~1995!.
17. V. A. Paganin, E. A. Ticianelli, and E. R. Gonzalez, J. Appl. Electrochem., 26, 297 ~1996!.
18. S. J. Lee, S. Mukerjee, J. McBreen, Y. W. Rho, Y. T. Kho, and T. H. Lee,
Electro-chim. Acta, 43, 3693 ~1998!.
19. E. Antolini, L. Giorgi, A. Pozio, and E. Passalacqua, J. Power Sources, 77, 136 ~1999!.
20. J. M. Song, S. Y. Cha, and W. M. Lee, J. Power Sources, 94, 78 ~2001!. 21. F. A. Uribe and T. A. Zawodzinski, Electrochim. Acta, 47, 3799 ~2002!. 22. S. C. Thomas, X. Ren, and S. Gottesfeld, J. Electrochem. Soc., 146, 4354 ~1999!. 23. E. Passalacqua, F. Lufrano, G. Squadrio, A. Patti, and L. Giorgi, Electrochim. Acta,
46, 799 ~2001!.
24. M. Eikerling and A. A. Kornyshev, J. Electroanal. Chem., 475, 107 ~1999!. 25. M. Eikerling, A. A. Kornyshev, and A. A. Kulikovsky, in Encyclopedia of
Electro-chemistry, Vol. 5, Electrochemical Engineering, D. D. Macdonald, Editor, To be published.
26. R. P. Iczkowski and M. B. Cutlip, J. Electrochem. Soc., 127, 1433 ~1980!. 27. S. J. Ridge, R. E. White, Y. Tsou, R. N. Beaver, and G. A. Eisman, J. Electrochem.
Soc., 136, 1902 ~1989!.
28. D. M. Bernardi and M. W. Verbrugge, AIChE J., 37, 1151 ~1991!.
29. T. E. Springer, M. S. Wilson, and S. Gottesfeld, J. Electrochem. Soc., 140, 3513 ~1993!.
30. C. Marr and X. Li, J. Power Sources, 77, 17 ~1999!.
31. M. Mezedur, M. Kaviany, and W. Moore, AIChE J., 48, 15 ~2002!. 32. J.-H. Nam and M. Kaviany, J. Heat Mass Transfer, 46, 4595 ~2003!. 33. J. M. Hammersley, Proc. Cambridge Philos. Math. Phys. Sci., 53, 642 ~1957!. 34. A. Ioselevich, A. A. Kornyshev, and W. Lehnert, Solid State Ionics, 124, 221
~1999!.
35. D. Stauffer and A. Aharony, Introduction to Percolation Theory, Rev. 2nd ed., Taylor and Francis, London ~1994!.
36. M. B. Isichenko, Rev. Mod. Phys., 64, 961 ~1992!.
37. S. Feng, B. I. Halperin, and P. N. Sen, Phys. Rev. B, 35, 197 ~1987!.
38. S. J. Chapman, MATLAB Programming for Engineers, Pacific Grove, CA ~2002!.