Publisher’s version / Version de l'éditeur:
XIV DBMC: 14th International Conference on Durability of Building Materials and Components, 29-31 May 2017, Ghent University, Belgium, 2017-05-30
READ THESE TERMS AND CONDITIONS CAREFULLY BEFORE USING THIS WEBSITE. https://nrc-publications.canada.ca/eng/copyright
Vous avez des questions? Nous pouvons vous aider. Pour communiquer directement avec un auteur, consultez la
première page de la revue dans laquelle son article a été publié afin de trouver ses coordonnées. Si vous n’arrivez pas à les repérer, communiquez avec nous à [email protected].
Questions? Contact the NRC Publications Archive team at
[email protected]. If you wish to email the authors directly, please see the first page of the publication for their contact information.
NRC Publications Archive
Archives des publications du CNRC
This publication could be one of several versions: author’s original, accepted manuscript or the publisher’s version. / La version de cette publication peut être l’une des suivantes : la version prépublication de l’auteur, la version acceptée du manuscrit ou la version de l’éditeur.
Access and use of this website and the material on it are subject to the Terms and Conditions set forth at
Approach to assessing the long-term performance of wall assemblies: durability of low-rise wood-frame walls
Lacasse, Michael A.; Morelli, Martin
https://publications-cnrc.canada.ca/fra/droits
L’accès à ce site Web et l’utilisation de son contenu sont assujettis aux conditions présentées dans le site
LISEZ CES CONDITIONS ATTENTIVEMENT AVANT D’UTILISER CE SITE WEB.
NRC Publications Record / Notice d'Archives des publications de CNRC: https://nrc-publications.canada.ca/eng/view/object/?id=f10348a8-14ce-4651-8e74-0d468bf1a53f https://publications-cnrc.canada.ca/fra/voir/objet/?id=f10348a8-14ce-4651-8e74-0d468bf1a53f
Approach to Assessing the Long-term Performance of Wall
Assemblies – Durability of Low-rise Wood-frame walls
LACASSE, Michael A.
1, a *, and MORELLI, Martin
2, b1National Research Council Canada, NRC Construction, 1200 Montreal Road, Building M24,
Ottawa, Ontario, Canada, K1A 0R6
2Danish Building Research Institute, Aalborg University, Department of Building
Technology and Management, A.C. Meyers Vænge 15, DK-2450 Copenhagen, Denmark
a[email protected], b[email protected]
*corresponding author
Keywords: drainage components; limit-states design; long-term performance; wall
assembly; wood frame.
Abstract. The long-term performance or durability of wall assemblies in respect to the
moisture management of components of which comprise the wall depends on the
hygrothermal response of the wall to local climate loads. Critical factors in estimating the longevity of wood frame structures include limiting the temperature range, wood moisture content and time of exposure to conditions suitable for the onset, growth and propagation of mould and rot to occur. Several approaches to assessing the vulnerability of wood frame structures to deterioration have been developed in recent years some of which suggest applying a limit-states design (LSD) approach to the performance assessment of the assembly. In this paper emphasis is placed on a further development of the LSD approach within the context of requirements set out in ISO 13823 “General principles on the design of structures for durability”. An example is presented in which the LSD approach is applied to low-rise wood-frame walls, as are built in North America, and that incorporate drainage components, such components forming part of a rain screen wall assembly. The use of this approach permits determining whether wall assemblies incorporating novel components are suitable for use in walls exposed to climates having extreme wind-driven rain conditions. The performance assessment is based on the results derived from hygrothermal simulation.
Introduction
The durability, indeed the longevity of building assemblies having a wood frame structure, depends on whether the wood components remain dry and if not, the time over which they are exposed to conditions that generate temperatures and elevated levels of moisture content conducive to the formation of wood damaging fungi. In ISO 13823 [1] recommendations are made on the use of different methods for the design and verification of structures for
durability. For example, verifying a component of a structure for durability can be done by applying service-life formats such as: the factor method or the limit-states format. When employing the factor method the design life is specified and the predicted service life is thereafter determined for the component or structure based on sets of factors that relate service life as determined from field studies to the expected life of a component for a similar use and subjected to a like environmental load.
The limit-states design (LSD) approach is a format that in recent years has been developed for assessing the vulnerability of wood frame structures to premature deterioration. Applying the
systematic framework for limit-state design in respect to the durability of building envelopes.
Isakssonet al. [3] employed a performance-based dose-response model to predict the onset of mould growth, this threshold being used as a limit state. Moisture management in structures has been investigated from the results of hygrothermal simulation where the threshold values for mould growth and wood decay are expressed in terms of temperature, relative humidity, moisture content and time. As such, the results from hygrothermal simulations can be transformed into an evaluation of limit states using e.g., mould isopleths [4] or mould growth and wood decay models as developed by Viitanen [5], and Viitanen and Ojanen [6].
In this paper, the intent is to demonstrate a systematic method for the performance
assessment of wood frame wall assemblies that follows a limit-states design (LSD) approach and additionally respects the requirements set out in ISO 13823 “General principles on the design of structures for durability” [1]. The use of the method set out in ISO 13823 [1] is highlighted by applying it to a project focused on a performance evaluation of proprietary drainage components and sheathing membranes used in wood frame wall assemblies when subjected to the climate of Canada as described by Saber and Lacasse [7].
The basis for the evaluation of the durability of the wood frame wall assemblies
incorporating drainage components and sheathing membranes described in [7] was the method designated in the project on Moisture Management of Exterior Wall Systems (MEWS) [8], [9] and in which the concept referred to as the Relative Humidity Temperature-index (RHT-index) was used as a performance attribute of the wall assembly. This use of the RHT-index as a performance attribute for assessing the hygrothermal performance of wall assemblies, and where the approach for the assessment followed the broad precepts set out in ISO 13823 [1], has previously been described by Lacasse and Morelli [10].
In the present paper, further advances to this approach are described for which a second performance attribute is given in additional to that of the RHT-index. The mould index (M-index), as was developed by Viitanen [5], [6] is shown to be a highly useful performance criterion from which the hygrothermal performance of a wood frame wall may be estimated. The intent in this paper is to further demonstrate that this revised and enhanced approach, as was previously demonstrated by Lacasse and Morelli [10], is likewise consistent with the guidelines described in ISO 13823 [1]. The improvements to that which had previously been described as a standard and systematic method for assessing the durability of wall assemblies include a more robust performance attribute in the M-index, this index being based on mould growth results obtain from experimental work in a laboratory setting.
The LSD approach as provided in ISO 13823 [1] is first briefly described and thereafter, an example of LSD approach for assessing the durability of a wood-frame wall assembly is explained.
Limit States Design – ISO 13823 [1]
The principle of the limit-states method for durability, illustrated in Figure 1, is for the designer of any component or structure to recognise the structure environment, transfer mechanisms, environmental actions, collective contributing to the effects of actions that over time result in the failure of the component or structure, as illustrated in ISO 13823 [1] and as demonstrated by Lacasse and Morelli [10].
The durability requirements for structures or components of structures are maintenance of their required minimum level of performance during their design life with sufficient
reliability for their intended use. The concept of the limit-states method is to verify the
performance against a threshold value (limiting performance state). The effect of exceeding a limit-state may be irreversible or reversible. For example, an irreversible case relates, in respect to structural design, to collapse or similar structural failure, whereas a reversible case
relates to requirements to maintain the component, assembly or structure serviceable over time; hence serviceability limit states are not as severe as those that define an irreversible limit state or what might be referred to as the ultimate limit state. Accordingly, limit states have been classified into the following two categories [11]:
Ultimate Limit States (ULS) - In respect to structural design, corresponds to the maximum load-bearing capacity or, in some cases, to the maximum applicable strain of deformation.
Serviceability Limit States (SLS) - concerns the normal in use conditions but beyond which the component, assembly or structure may not adequately perform all its intended functions.
The basic requirement for ULS is defined in Eq. (1) and expresses that the load effect (S(t)) must be smaller than the resistance. Serviceability Limit States is defined in Eq. (2) and expresses that the load effect must be smaller than the limit indicating onset of
serviceability failure [11]. These two requirements must be satisfied at any time, t, during the design life, ts, of the component; in more formal terms:
R(t) ≥ S(t)...(1) Slim> S(t) ...(2)
where, R(t) is the resistance capacity of the structural component at time t; S(t) represent the action effect, e.g., an internal force, stress, deformation, at any time t; and Slimis the
serviceability limit state.
In Figure 1, tstartis the time to reach the initiation of deterioration of a component, i.e., the
Initiation Limit State (ILS). For a component protected against agents, e.g. preservative treatment of wood, the service life, ts, can be determined as in Eq. (3).
ts= tstart+ texposed...(3)
where, texposedis the service life after initiation of deterioration.
Example: LSD Approach for Performance Assessment of Wood Frame Wall Assemblies Project overview. The information presented in this paper reflects a portion of the work that
was completed in assessing the expected hygrothermal performance of stucco-clad wood-frame wall assemblies incorporating drainage media [7]. Given that the objective of that project was to assess the hygrothermal performance of wall assemblies incorporating several different combinations of drainage components and sheathing membrane, it was of interest to evaluate the ability of wall assemblies to provide sufficient moisture dissipation through the process of drainage and drying of water from these components when subjected to moisture loads as prevail in specified Canadian climates. More specifically, the climates of interest were those prevalent in coastal areas having a moisture index (MI) [12] greater than 0.9 and less than 3400 degree-days, or MI greater than 1.0 and degree days ≥ 3400. In such climate zones the 2010 National Building Code of Canada (NBC) requires a capillary break behind claddings of all housing and small buildings [13].
Figure 1 - Limit states method for durability as provided in ISO 13823 [1]
Moisture index (MI) and climate loads on wall structures. The MI was representative of
the climate loads to which a given wall would be subjected in simulation and was based on the potential offered for wetting and drying of wall assemblies for a given climate. As such, and given the broad range of climates as might be found in North America, the climate was categorized into 5 severity classes, from low (MI < 0.7) to severe (MI ≥ 1.0) [14]. The MI was thus representative of the climate load to which wall assemblies were subjected; a map of North America showing these different MI classes can be found in [7], [8].
Hygrothermal performance and performance criteria. Currently, acceptable solutions to the NBC requirement (§ 9.27) for a capillary break include [13]:
(i.) A drained and vented air space not less than 10 mm deep behind the cladding;
(ii.) An open drainage material behind the cladding, not less than 10 mm thick and with a cross-sectional area that is not less than 80% open;
(iii.) A cladding loosely fastened, with an open cross section (e.g. vinyl, aluminum siding); (iv.) A masonry cavity wall or masonry veneer constructed according to NBC § 9.20 (i.e.
25 mm vented air space).
As part of this project focused on assessing the hygrothermal performance of stucco-clad wall assemblies incorporating drainage media [7], the hygrothermal performance of a
proposed alternative solution for the capillary break, and that incorporated a specific combination of drainage component and sheathing membrane, was compared to the performance of a NBC code-compliant “reference” wall built to minimum NBC
requirements. The walls were subjected to laboratory testing and simulation, the results from simulation being used with the following performance criteria:
(1) RHT index criterion, and; (2) Mould index criterion.
t
startt
exposedThus if a proposed wall system that incorporated a drainage component and sheathing membrane combination exhibited a level of performance equal to or better than the NBC-compliant reference wall, it would be deemed an alternative solution to the 2010 NBC requirement for a capillary break and could be used with all presently recognized code compliant claddings as an acceptable solution [13].
The hygrothermal performance of wall assemblies incorporating drainage components was assessed against the results obtained from numerical simulation of a NBC code-compliant reference wall assembly when subjected to environmental loads for the selected climate locations in Canada and conforming to interior boundary conditions as described in the ASHRAE Standard S-160 [15].
RHT-index criterion: Wall moisture response indicator — The RHT-index is a
moisture response indicator derived from simulation of a selected period of time (e.g. two years of simulation period) for any specified area of a wall cross-section [8]. The index captures the duration of the coexistence of moisture and thermal conditions above set threshold levels for which the risk to the formation of, e.g., mould growth or wood rot is considered too high, and is given as:
RHT (Cumulative value (1st& 2ndyear of simulation)) = ∑ (RH – RH
x) x (T – Tx).. (4)
where, RH > RHx(%) and T > Tx(°C) are values averaged over 10 day intervals of
simulation.
Hence, a single-numbered indicator RHT is formed by summing only non-zero values over a two year simulation period for a target region in the wall. During any time step when either or both RH < RHxand T ≤ Tx, the RHT value for that time step is zero. The
user-defined values used in the project and being nominal conditions for the initiation of damage to wood were: RHx= 95 % and Tx= 5 °C; whereas the limiting values for the initiation of
mould growth were assumed to be: RHx= 80 % and Tx= 5 °C. The higher RHT-index
values indicate an increased severity of the hygrothermal response; a greater risk for damage. The RHT-index was used for evaluating the response of wall assemblies to climate loads and from which could be inferred the durability of wood frame structures. The MI together with the RHT-index revealed the hygrothermal wall response under different climate conditions and differing wall configurations and in relation to the degree of water ingress to the wall assembly due to inadvertent rain penetration of the cladding.
Mould index criterion — The development of the mould index has been on-going for
several years with the most recent work, as was used in this project, having being provided by Ojanen et al. [16].
A description of the mould index levels as relate to growth rates is provided in Table 1, whereas the mould growth sensitivity classes for specified materials and corresponding minimum levels of relative humidity needed for mould growth are provide in Table 2. The mould index levels range in value from 0 to 6, with 0 being equivalent to no growth and 6 indicating 100% coverage of either heavy or tight mould growth. The visual identification of mould growth on surfaces is given an index level value of 3.
As provided in Table 2, the sensitivity of different construction materials to the formation of mould growth was divided into four (4) classes: very sensitive, sensitive, medium resistant and resistant. For this project, the sensitivity class for the sheathing panel (e.g. OSB) was considered “Sensitive”, and are the only values on which the relative performance of the respective wall assemblies was determined.
Table 1 - Description of Mould Index (M) levels [6]
M Mould Index (M) - Description of Growth Rate
0 No growth
1 Small amounts of mould on surface (microscope), initial stages of local growth
2 Several local mould growth colonies on surface (microscope)
3 Visual evidence mould on surface, < 10% coverage, or < 50% coverage of mould (microscope) 4 Visual evidence surface mould; 10-50% coverage, or >50% coverage of mould (microscope)
5 Plenty of growth on surface, > 50% coverage (visual)
6 Heavy and tight growth, coverage about 100%
Table 2 - Mould growth sensitivity classes and some corresponding materials [6]
Sensitivity Class Materials RHmin
[%]*
Very Sensitive Pine sapwood 80
Sensitive Glued wooden boards, PUR with paper surface, spruce 80
Medium Resistant Concrete, aerated and cellular concrete, glass wool, polyester wool 85
Resistant PUR with polished surface 85
* Minimum relative humidity needed for mould growth
LSD approach applied to a stucco-clad NBC-compliant wood-frame wall assembly
In this example, consideration is given to the attack mechanism by decay fungi in a stucco-clad NBC-compliant wood frame wall assembly. Simulations were completed where it was assumed that rainwater ingress through inadvertent leakage in the wall was ultimately deposited in the cavity between the cladding and the backup wall and on the sheathing membrane. The sources of data for this example are available in the detailed report by Saber and Lacasse [7].
Defining “structure” & “environment” — Referring to Figure 1, the two primary and
initial elements of the LSD method for durability are defining the structure and the environment. In this instance the structure is defined as the stucco-clad NBC-compliant wood frame wall assembly, as configured for simulation. Whereas the environment relates to the conditions and loads to which the structure is to be subjected, through which
environmental actions (e.g. wood decay, mould growth) arise and from which the effects of these actions manifest themselves (heightened risk to formation of damage, health issues); both of these elements are further described in the subsequent sections.
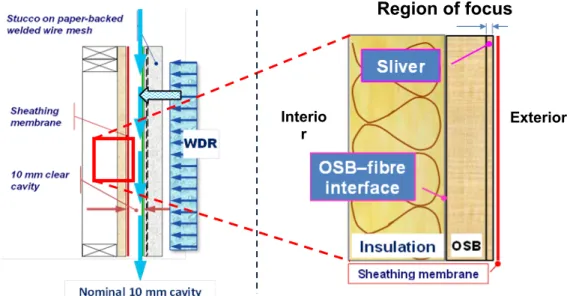
Stucco-clad wood frame wall assembly — The wall configuration is shown in Figure 2
together with the region of focus that in the simulations was a thin slice (1 mm) of the of the exterior OSB sheathing panel, in close contact with the sheathing membrane. It was
understood that the onset of wood damage or mould formation in this particular location would be considered an under-performing wall assembly of inadequate design.
Boundary conditions — The exterior environment influencing the wall structure was
described by hourly values of exterior temperature and relative humidity, solar radiation, cloud index, and wind driven rain (i.e. for WDR: hourly rainfall, wind speed and wind direction) for specified climatic locations of interest in the study; these included, amongst a set of 3 locations: : St. John’s (East coast climate – wet and cool, MI = 1.41), Vancouver (West coast climate – wet and mild, MI = 1.44) and Tofino (Extreme coastal climate having MI = 3.4).
From multi-year weather data (> 30 years), two years were selected for each location defining a “wet” and an “average” year. A “wet” year represented the wettest year that also exceeded the average year by at least one standard error of the mean (i.e. 1σ). These two years defined the 2-year weather cycle (wet-average) to which the wall assemblies were
Figure 2 - Stucco wall X-section, regions of focus; regions include: 11 mm thick OSB panel; exterior 1 mm sliver of OSB; back 10 mm portion of OSB; OSB-fibre-insulation interface [7]
subjected in the simulation; derived values for RHT-index and M-index were however based on the results of the last year of simulation.
The interior climate was represented by two parameters: temperature (T) and relative humidity (RH). Interior room T and RH were varied following the criterion given in the ASHRAE handbook [17]; winter values of 22ºC, 25% (when mean monthly outdoor T was < 11ºC); summer values 25ºC, 55%.
Defining transfer mechanisms — These are mechanisms by which loads (e.g. structural,
or environmental) are transferred to the structure. In respect to a wood-frame wall assembly, the hygrothermal simulation model is capable of transferring moisture loads to the structure provided these are compatible with the basic variables that affect heat, air, and moisture transfer across the wall. As such, and given that the hygrothermal model used in these studies could resolve the basic equations for transfer of heat, air and moisture, and thus provide the response of the components to the boundary conditions imposed on it, there were nonetheless a number of elements that required specific mechanisms to be defined; these included: (i) Wind-driven rain (WDR) to be converted to a rain load on the vertical surface of the wall; (ii) Proportion of water at the surface of the wall from WDR that might enter the wall assembly; (iii) Location of water deposition in the wall (i.e. the moisture load; ML).
In regard to the a rain load on the wall due to WDR (i), the method described in
ISO 15927; Part 3 [18] was used to determine the WDR load on a vertical wall from hourly wind and rainfall data.
The proportion of water at the surface of the wall that might enter the wall assembly (ii) was based on the results of water penetration tests of a series of stucco clad wall assemblies [19] and from which an empirical function was derived for water entry to the wall that considered both the quantity of water being deposited on the wall and the pressure difference across the assembly; this function was given as:
Q (L/h) = Rw* f(ΔP) ... (6)
Where Q is the rate of water entry to the wall; Rwthe rate of water striking the wall; ΔP
pressure difference across the wall assembly; water entry functions (i.e. f(ΔP)) for stucco-clad
Region of focus
Exterior Interio
LSD approach, and given that there was a clear cavity behind the cladding, the ML was applied entirely on the backside of the cladding. It was surmised that in the case of a clear cavity, the capillary break would prevent any substantial ML from reaching the sheathing membrane, whereas in the presence of a drainage component, it was supposed that there was an equal risk that the ML would remain on the backside of the cladding, or percolate to the surface of sheathing membrane over a storey height. Thus, had the drainage cavity included a drainage component (not given in this example for LSD), the assumption would have been that 50 % of the ML remain on the backside of the cladding and the remaining 50% to the surface of the sheathing membrane. Evidently, those locations on the sheathing membrane in contact with water were also those where water tended to migrate across the membrane and into the outer fibre of the OSB.
Defining environmental actions — Environmental actions arise as a result of the
response of a wall to the effects of climate loads and interior environmental conditions based on the different transfer mechanisms that affect moisture transfer to the structure. Actions such as damage to wood-based components or the formation of mould result from specific conditions of T and RH in the wood-based component for a sufficiently long period to increase the risk to the formation of rot or mould fungi.
In the current example both the RHT-index and the M-index are the two performance attributes that capture the degree of risk over time for the formation of mould in the
components of the wall assembly. These are representative of the environmental actions, as provided in Figure 1, arising from the hygrothermal response of the wall components to the effects of the climate and interior conditions; as such, these actions have been defined as prescribed in ISO 13823 [1]; these actions are shown to be damage (e.g. loss in resistance) or change in appearance. This is entirely consistent with the manner in which the M-index has been implemented in this program, and where a value of M-index = 3 is indicative of the visible presence of mould, as provided in Table 1. As such, using the values of RHT-index, or those of the M-index, both derived from simulation results, one can readily compare the performance of different wall assemblies for a given climate, or the effect of different climates on a specific assembly, as is subsequently demonstrated below.
Reference Wall Simulation — Mould- and RHT-Index Performance
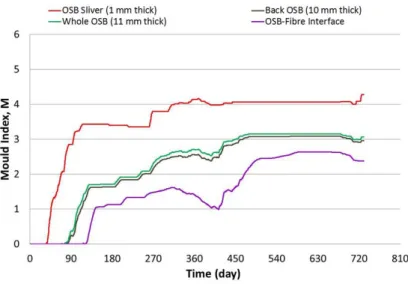
Comparison in M-index response amongst different locations within wall. The results of
hygrothermal simulation of the stucco wall assembly are provided in terms of values for temperature (T) and relative humidity (RH) for each of the discrete elements of which the wall is configured. Results are first provided with respect to variations in values of M-index for the simulated response of the 4-storey reference wall over a 2-year simulation period for the specified locations within the wall (i.e. OSB Sliver; Back of OSB; Whole OSB; OSB-Fibre Interface) and in respect to the three locations for which simulations were completed; i.e. this for Tofino, BC, in Figure 3, for Vancouver, BC in Figure 4 and in Figure 5 for St. John’s, NL.
The values for M-index performance are based on an M-index sensitivity class “S” (Sensitive) for wood components (re: Table 2). Information in tabular form and adjacent to the figures, provides the average and maximum values of M-index attained for the different locations within the wall section over the 2-year simulation period and for each of the locations for which simulations were completed.
In general, for any given climate location, the average and maximum values for M-index are greatest for locations in the wall assembly closest to the source of the moisture load; values for M-index decrease as the gap between the moisture source and the location of interest increases. Thus, for example in Tofino, the “sliver” of OSB panel has the greatest average value for M-index (3.9), followed by the back portion of the OSB panel (M-M-index = 2.5) and thereafter, the
interface between the OSB and fibrous insulation (M-index = 1.8). Thus the onset for mould growth on or within the OSB panel, for any given location, is more evident for the sliver as compared to the interface between the OSB and fibrous insulation. In Tofino, for example, the onset for mould growth at the 1 mm thick OSB panel “sliver” occurred after the first 15 days whereas this was 120 days for the interface between the OSB and fibrous insulation.
The most severe location, in respect to the response as measured by the average and maximum values for the M-index amongst the three for which simulations were completed was Tofino, BC. The average and maximum M-index values for the “OSB sliver” were greatest in Tofino, and thereafter, in descending order, in Vancouver and St. John’s. The % increase from average to the maximum value for M-index were, respectively, for Tofino, Vancouver and St. John’s, +15%, +23% and +36%. As such, the M-index values correlate with the respective values for moisture index (MI) for each climate location.
Reductions in values for M-index during the 2-year simulation period are less pronounced in milder climates as compared to colder climates. For example, the colder climate of St. John’s (HDD = 4800) offers significant reductions in M-index values (Sliver: M-index = 4 to = 3; OSB-fibre interface: M-index =2 to = ~ 0.2) over the winter months (i.e. from ca. day 360 to day 450), whereas for the milder climates of Vancouver (HDD = 2950) and Tofino (HDD = 3150), the reductions in M-index are much less pronounced.
Comparison in M-index response within wall for selected climate locations. The results
derived from hygrothermal simulation of the fourth storey reference wall for each of three selected locations in Canada over a 2-year simulation period with respect to the
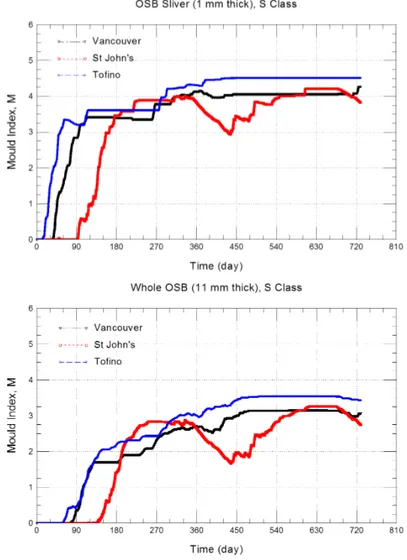
M-index performance values are provided for the 1 mm thick sliver of the OSB sheathing panel and the “whole OSB panel in Figure 6, whereas the results for the back 10 mm of the OSB panel and the interface between the OSB and fibrous insulation are given in Figure 7.
Mould index values for 1 mm “Sliver” (Figure 6 – top Fig.) — The M-index values for a
1 mm “Sliver” at the exterior face of OSB panel of a 4thstorey wall located in Tofino, generally
increases over the simulation period, although there is a long period in the initial simulation year where the value of M-index remains stagnant at a value of ca. 3.6. The response for Vancouver is similar to Tofino, but less severe. For Vancouver, the maximum value for M-index attained after 2-years of simulation is ca. 4.3 whereas for Tofino it is 4.5. In the case of the simulated response of the wall located in St. John’s, the colder climate retards the growth of the M-index and provides for a reduction in the M-index with the onset of the second winter period; thereafter, it attains a maximum similar in value to that of Vancouver.
Mould index for “Back” 10 mm portion of OSB panel (Figure 7 – top Fig.) — The
M-index values for the “Back” 10 mm portion of the OSB panel of a wall located in Tofino gradually attains a maximum valve of 3.5 for M-index over the simulation period ; a similar pattern of gradual increase in M-index is evident for Vancouver, although the maximum for M-index over the 2-year simulation period is 3. For the colder climate of St. John’s, the simulated response of the reference wall again is retarded in the initial simulation months, but does achieve a M-index value of ca. 2.8 in about month 9 of simulation, only to diminish over the winter months to values of ca. 1.5; thereafter, there is a steady increase over the
subsequent 9 months to attain a maximum of ca. 3.2 for this climate location.
Mould index for the “Whole” 11 mm portion of OSB panel (Fig. 6; bottom Fig.) —
The M-index values for the “Whole” 11 mm portion of OSB panel of a wall at the 4thstorey
for the selected climate locations is essentially the same as that achieved for the “Back” 10 mm portion of the OSB panel.
Figure 3 – Mould index for specified locations in wall assembly as a
function of time over a 2 year simulation period for Tofino, BC function of time over a 2 year simulation period for Vancouver, BCFigure 4 – Mould index for specified locations in wall assembly as a Layer or Interface
M-index
value (1 mm thick)OSB Sliver (10 mm thick)Back OSB (11 mm thick)Whole OSB OSB-Fibre Interface
Tofino, BC Average 3.91 2.51 2.60 1.82 Maximum 4.51 3.48 3.54 2.98 Vancouver, BC Average 3.50 2.18 2.27 1.52 Maximum 4.27 3.08 3.15 2.63 St. John’s, NL Average 3.085 1.941 2.035 1.147 Maximum 4.210 3.191 3.261 2.562
Mould index: Interface between OSB panel & fibrous insulation (Figure 7; bottom Fig.) The M-index values for the interface between the OSB panel and the fibrous insulation
within a wall section at the fourth storey are reduced as compared to the values obtained at the back or for the entire portion of OSB achieving a maximum value for M-index of ca. 3 for Tofino and ca. 2.6 for either Vancouver or St. John’s. This is simply due to lower moisture contents of the OSB at this location in the wall as compared to locations in the OSB closer to the source of the moisture load.
There is a more pronounced effect of the colder seasons on the M-index values as is evident from the lag in accumulation of M-index values for the initial stages of the simulation and the reduction in M-index values at the onset of the second as well as the subsequent fall-winter season. Of the three climate locations, this effect is most prominent for St. John’s, the coldest of the three climates (i.e. 4800 HDD for St. John’s as compared to 3150 and 2950 for Tofino and Vancouver, respectively).
RHT-index response — Reference Wall Simulation. The results derived from simulation for the response of the fourth storey reference wall subjected to the climate of Tofino over a
simulation period are shown in Table 3. The values given in Table 3 are the cumulative values for RHT indices achieved after 2 years simulation for a 1 mm “sliver” of the exterior surface of an OSB panel within a section of the reference wall. Values for RHT(80), RHT(85), and RHT(92) are provided for which lower RH threshold values yield higher values for RHT-index. Values have been provided in Table 3 for the respective RHT indices of Vancouver (MI = 1.44), BC and
St. John’s (MI = 1.41), NL. The severity of the Tofino climate is evident from a review of the values for RHT-index; Tofino has the highest RHT-index value for each of the respective indices. As well, it is difficult to distinguish between the severity of the climate in Vancouver and St. John’s given that the RHT(92) index value for either of these locations is essentially the same. However, one is able to obtain more discerning index values from the RHT(85) and RHT(80) indices.
Concluding Remarks
There are several other examples of how the RHT-index of wall response can be used to assess the relative performance of wall assemblies; these can be found in reports by Beaulieu et al. [8] and Mukhopadhyaya et al. [20] and the several additional papers that have been
published on these results. Not as many examples of the use of the M-index approach are available as these have only more recently been implemented to the approach for durability assessment; however, these likewise can be found in the NRC publications archives. The intent here was not to delve into an in-depth explanation of the results but to demonstrate that the proposed approach is consistent with the broad precepts described in ISO 13823 [1] and as such, offers a systematic and standard method of assessing the durability of wall assemblies. The ultimate limit state (ULS) is related to the structural integrity of the wall assembly, and the proposed approach, as described in this paper, does currently not provide a means to determine whether the ULS is attained. However given the development of wood decay models by Viitanen [22], and more recent developments as relate to wood decay, mass loss and loss in structural resistance, for example, the work of Bastidas-Arteaga et al. [23] and Saito et al.
Table 3 – Values of RHT index for Selected climate locations
Figure 6 – Mould index for 1 mm “Sliver” & for “Whole” 11 mm portion of exterior face of OSB panel of 4-storey wall for selected climate locations as a function of time over 2-year simulation period
Figure 7 - Mould index for “Back” 10 mm portion & interface between OSB panel & fibrous insulation of a fourth storey wall for
selected climate locations as a function of time over a 2-year simulation period
Although the approach as currently developed more appropriately relates to assessing the serviceability limit state (SLS) of components in the wall assembly, how is the durability determined on the basis of the proposed LSD approach? Two methods are proposed: (i) by demonstrating performance of a wall assembly equivalent to that of a wall having known or accepted performance as obtained from observations of in-service performance in the field; (ii) by subjecting the wall assemblies to climate loads of a specified return period.
The first of the two proposed methods is what is currently being used at NRC as the basis for assessing the hygrothermal performance of wall assemblies when technical opinions are rendered on new construction products to demonstrate compliance to the National Building Code of Canada. Comparisons are made between the performance of a code-complaint reference wall of known or accepted minimum level of performance and that of a proponent’s wall; provided the performance of the proponent’s wall equals or is better than the reference wall, the proponent’s wall is deemed to have met an acceptable level of performance.
Although the second method has not yet been fully explored it nonetheless has merit given that structural loads as arise from the effects of the climate (e.g. wind, snow, rain loads) are typically based on a given return period. As is known, for a given climate location, the greater the return period the more severe the climate loads. The severity of climate loads in respect to their return period and as regards the water tightness performance of wall assemblies has been explored by Cornick and Lacasse [24]; this suggests that the SLS can be adapted to the proposed LSD approach in the context of achieving adequate in-service hygrothermal performance for walls.
Acknowledgments
Thanks are extended to the Construction program of the National Research Council Canada for support of this work and to the following staff who contributed to the project: Mr. S. M. Cornick, Dr. W. Maref, Dr. P. Mukhopadhyaya, and Mr. M.C. Swinton.
References
[1] ISO 13823, 2008. General Principles on the Design of Structures for Durability.
[2] Bomberg, M. and Allen, D., 1996. Use of Generalized Limit States Method for Design of Building Envelopes for Durability. J. of Thermal Insulation & Bldg. Envel., vol. 20, pp. 18-39. [3] Isaksson, T., Thelandersson, S., Ekstrand-Tobin, A. and Johansson, P., 2010. Critical Conditions
for Onset of Mould Growth Under Varying Climate Conditions. Building & Environment, vol. 45(7); pp. 1712-1721.
[4] Sedlbauer, K. 2002. Prediction of mould growth by hygrothermal calculation. Journal of Building Physics, vol. 25(4); pp. 321–336.
[5] Viitanen, H.A., 1997. Modelling the Time Factor in the Development of Mould Fungi-the Effect of Critical Humidity and Temperature Conditions on Pine and Spruce Sapwood. Holzforschung-Intl. J. of the Biology, Chemistry, Physics and Technology of Wood, vol. 51(1); pp. 6-14.
[6] Viitanen H.A. and Ojanen, T. (2007), Improved Model to Predict Mould Growth in Building Materials, Proceedings of the Buildings X International Conference on the Thermal Performance of the Exterior Envelopes of Whole Buildings (Dec. 2-7), Clearwater, FL, 8 p.
[7] Saber, H. H. and M. A. Lacasse (2015) Performance Evaluation of Proprietary Drainage Components and Sheathing Membranes when Subjected to Climate Loads – Task 6 – Hygrothermal Performance of NBC-Compliant Reference Wall for Selected Canadian Locations; Research Report; National Research Council Canada; Ottawa, ON; 59 pgs.
[8] Beaulieu, P. et al. (2002), Final Report from Task 8 of MEWS Project (T8-03) - Hygrothermal Response of Exterior Wall Systems to Climate Loading: Methodology & Interpretation of
[9] Kumaran, M.K.; Mukhopadhyaya, P.; Cornick, S.M.; Lacasse, M.A.; Maref, W.; Rousseau, M.Z.; Nofal, M.; Quirt, J.D.; Dalgliesh, W.A. (2002), A Methodology to develop moisture management strategies for wood-frame walls in North America: application to stucco-clad walls; 6thNordic Building Phys. Symp., Trondheim, Norway, June 17-19, 2002, pp. 651-658.
[10] Lacasse, M. A. and Morelli, M. (2016), “A Systematic Method of Assessing the Durability of Wood-Frame Wall Assemblies: Towards the Limit-States Design Approach”; Thermal Performance of the Exterior Envelopes of Whole Buildings XIII; International Conference; December 4–8, 2016; Clearwater (FL), USA, ASRHAE, Atlanta (GA), USA, pp. 235-245
[11] ISO 2394, 1998. General Principles on Reliability for Structures.
[12] Cornick, S. M. and K. Abdulghani (2013), Performance Evaluation of Proprietary Drainage Components and Sheathing Membranes when Subjected to Climate Loads – Task – Defining Exterior Environmental Loads; Research Report; Natl. Res. Council Canada; Ottawa, ON; 99 pgs. [13] NBCC 2010 Part 9; Housing and Small Buildings; Cladding conforming to § 9.27
[14] Cornick, S.M. ; Dalgliesh, W.A (2003b) A Moisture index to characterize climates for building
envelope design; Journal of Thermal Envelope & Building Science, v. 27(2); pp. 151-178.
[15] ASHRAE Standard 160-2009, Criteria for Moisture-Control Design Analysis in Buildings; American Society of Heating, Refrigerating, & Air-Conditioning Engineers, Inc.: Atlanta, GA, 16 pgs.
[16] Ojanen, T., Viitanen, H.A., Peuhkuri, R, Lähdesmäki, K., Vinha, J., and Salminen, K., "Mould Growth Modeling of Building Structures Using Sensitivity Classes of Materials", 11th Itnl.
Conference on Thermal Performance of the Exterior Envelopes of Whole Buildings XI (Clearwater, (FL), USA, December-05-10), 10 p., 2010.
[17] ASHRAE Applications Handbook (1999), Chapter 3 - Commercial and Public Buildings
[18] ISO 15927-3:2009. Hygrothermal performance of buildings - Calculation & presentation of climatic data-Part 3: Calculation of a driving rain index for vertical surfaces from hourly wind & rain data [19] Lacasse, M. A.; O'Connor, T.; Nunes, S. C.; Beaulieu, P. (2003), Report from Task 6 of MEWS
Project: Experimental Assessment of Water Penetration and Entry into Wood-Frame Wall Specimens - Final Report; Research Report, RR-133; NRC Institute for Research in Construction; National Research Council Canada, Ottawa; 309 p.
[20] Mukhopadhyaya, P.; Kumaran, K.; Tariku, F.; van Reenen, D. (2003), Long-Term Performance: Predict the Moisture Management Performance of Wall Systems as a Function of Climate, Material Properties, Through Mathematical Modelling; Final Report Task 7 Mews Project; Research Report, RR-132 Institute for Research in Construction, National Research Council Canada, Ottawa; 390 p.
[21] Nofal, M. (1998), Hygrothermal Damage of Building Materials and Components: State-of-the-Alt Report on Studies of Hygrothermal Damage & Proposed Approach for Damage Assessments; Internal Report No. 757; Institute for Research in Construction; National Research Council Canada, Ottawa; 150 p.
[22] Viitanen, H., Toratti, T., Makkonen, L., Peuhkuri, R.., Ojanen. T., Ruokolainen, L., Räisänen, J. (2010), “Towards modelling of decay risk of wooden materials”; Eur. J. Wood Prod. 68: 303–313 [23] Bastidas-Arteaga, E., Aoues, Y., Chateauneuf, A. (2015), Optimal Design Of Deteriorating
Timber Components Under Climate Variations, 12th Intl. Conf. on Applications of Statistics &
Probability in Civil Engineering, ICASP12; Vancouver, Canada, July 12-15, 2015
[24] Saito, H., Fukuda, K., Sawachi, T. (2012), Integration model of hygrothermal analysis with decay process for durability assessment of building envelopes; Building Simulation 5: 315–324 [25] Cornick, S. M & Lacasse, M. A. (2009), “An Investigation of climate loads on building façades for
![Figure 1 - Limit states method for durability as provided in ISO 13823 [1]](https://thumb-eu.123doks.com/thumbv2/123doknet/14064948.461860/5.892.240.662.106.579/figure-limit-states-method-durability-provided-iso.webp)
![Table 1 - Description of Mould Index (M) levels [6]](https://thumb-eu.123doks.com/thumbv2/123doknet/14064948.461860/7.892.99.801.115.500/table-description-mould-index-m-levels.webp)