Publisher’s version / Version de l'éditeur:
Vous avez des questions? Nous pouvons vous aider. Pour communiquer directement avec un auteur, consultez la première page de la revue dans laquelle son article a été publié afin de trouver ses coordonnées. Si vous n’arrivez pas à les repérer, communiquez avec nous à [email protected].
Questions? Contact the NRC Publications Archive team at
[email protected]. If you wish to email the authors directly, please see the first page of the publication for their contact information.
https://publications-cnrc.canada.ca/fra/droits
L’accès à ce site Web et l’utilisation de son contenu sont assujettis aux conditions présentées dans le site LISEZ CES CONDITIONS ATTENTIVEMENT AVANT D’UTILISER CE SITE WEB.
Building Research Note, 1978-06
READ THESE TERMS AND CONDITIONS CAREFULLY BEFORE USING THIS WEBSITE. https://nrc-publications.canada.ca/eng/copyright
NRC Publications Archive Record / Notice des Archives des publications du CNRC : https://nrc-publications.canada.ca/eng/view/object/?id=6f36a018-f1b5-4197-a86e-001de006824c https://publications-cnrc.canada.ca/fra/voir/objet/?id=6f36a018-f1b5-4197-a86e-001de006824c
NRC Publications Archive
Archives des publications du CNRC
This publication could be one of several versions: author’s original, accepted manuscript or the publisher’s version. / La version de cette publication peut être l’une des suivantes : la version prépublication de l’auteur, la version acceptée du manuscrit ou la version de l’éditeur.
For the publisher’s version, please access the DOI link below./ Pour consulter la version de l’éditeur, utilisez le lien DOI ci-dessous.
https://doi.org/10.4224/40000581
Access and use of this website and the material on it are subject to the Terms and Conditions set forth at
Patterns of lighting use in a large open-plan oOffice. Pt. 1. Preliminary study and evaluation
ISSN 0703-5232 ~013(-?
PATTERNS OF LIGHTING USE IN A LARGE OPEN-PLAN OFFICE
1. PRELIMINARY STUDY AND EVALUATION by
A.W. Levy
In order to formulate programs to reduce the e l e c t r i c i t y consumed by artificial lighting in offices, it is necessary to collect data m
t y p i c a l conswrrption p a t t e r n s far present types of buildings. Such data, if callecred in a meaningful way, can be used in three ways. F i r s t l y , xhe p o t e n t i a l effectiveness of alternative conservation strategies
(e. g.
,
automatic controls) can be compared. Secondly, an indication can be obtained o f the percentage of electricity consumed by lighting alone compared to other building services and its e f f e c t on peak demand f o r electricity. Thirdly, profiles of use needed as i n p u t t o building energy analysis computer programs can be obtained.The data required at any given i n s t a n t include:
[i) the f r a c t k a n of maximum lighting load switched an,
(ii] the contribution o f natural daylight to internal illuminance levels and its effect on the use o f artificial light,
(iii) the number of occupants in the space. [iv) the activity being performed I n the space.
Time-lapse photography can be employed t o collect the information periodically in a single photographic frame. This Note describes a pilot survey of a government office in O t t a w a , Ontario, u s i n g t h i s photographic technique. The study was performed in order to evaluate t h e potential value and limitations o f the present apparatus and
technique before a larger survey is undertaken. DESCRIPTION OF APPARATUS
A Sankyo ES 44XL camera fitted with a Micador 55 mm wide-angle lens i s suspended from t h e ceiling, positioned in such a way t h a t its field
o f view contains the luminaires in the c e i l i n g and mast of the floor space [Figmes 1 and 2). In certain installations the switching
arrangement of t h e luminaires allows the f i e l d of view to be limited t o a s i n g l e luminaire in each switching circuit. Knowing that a particular luminaire has been switched on also indicates that the remainder in t h a t
particular switching c i r c u i t are similarly activated. Restricting t h e
f i e l d of view of t h e ceiling in this way can enable a larger floor area
A small analogue quartz watch is mounted i n f r o n t of the camera to indicate the time in hours and minutes. A t i m i n g circuit, placed above the ceiling, controls the a c t i v a t i o n of the automatic camera exposure mechanism and the shutter control.
A
single frame can be exposed typically at 6- to 8-min intervals. With 3600 frames on a 50-ft film(colour, super 83 t h e film cassette must be changed every 20 days. The timing circuit and camera a r e powered by a s i n g l e 6 V lantern battery w i t h a typical l i f e of up to 6 months.
NATURAL DAYLIGHT
Data on the natural daylight contribution to interior illumination levels are important to t h e present study for two reasons. Firstly, it
can he used to predict t h e savings t h a t can be a t t a i n e d with automatic
light controls t h a t switch or d i m a ~ t i f i c i a l l i g h t in sympathy with daylight. Secondly, patterns of switching behaviour can be discerned, such as t h e determination of the threshold interior illuminance at which artificial l i g h t s a r e a c t i v a t e d .
The daylight illumination in a building can be expressed e i t h e r in
absolute terms, as an illuminance, or as a r a t i o to the t o t a l daylight
simuLtaneously available out-of-doors from the whole unobstructed sky. This r a t i o , expressed as a percentage, is known as t h e Daylight Factor.
Absolute values of illuminance have been considered suitable for daylight specification in d ~ y t ~ o p i c a l regions where the sky luminance
distribution is p r e d i c t a b l e and the average sky luminance and r e f l e c t e d
sunlight f ~ s m external surfaces remain reasonably constant throughout the day.
The Daylight Factor ratio has been utilized for cloudy and h m i d
climates where the outdoor illumination varies continuously throughout the day. Assuming that interior illuminances vary in the same way as
outdoor illumination the daylight factor then provides a means of evaluating interio~ illuminance levels.based on o u t d o o ~ illumination data. A CIE standard overcast sky luminance distribution is assumed to p r e v a i l for both calculation and measurement of d a y l i g h t factor.
C h a r a c t e r i s t i c s o f t h i s standard sky include a sky luminance independent of azimuth and a luminance at. the zenith three times t h a t at the horizon. The contribution of direct sunlight is excluded from Daylight Factor
methods, 5 0 t h a t to predict the illuminance at a point indoors both the Daylight Factor and the outdoor illuminance musz be known f o r skylight
( d i f f u s e daylight) only.
Ideally one would wish t o measure or calculate the separate
c o ~ l t r i b u t i o n s of skylight and sunlight to interior illuminance levels at
chosen points within an o f f i c e i n t e r i o r . Present rrtethods do not allow t h i s to be achieved e i t h e r conveniently or accurately. The most practical procedure is t o measure o r calculate the daylight factor distribution w i t h i n the building o f i n t e r e s t and t h e r e a f t e r calculate interior d a y l i g h t illuminance levels from r a d i a t i o n data collected at a nearby s t a t i o n .
Unfortunately, only at Jean Brebeuf, Montreal, Goose Rawinside, Newfoundland, Resolute A, Northwest Territories, and Toronto Is sky r a d i a t i o n measured with the exclusion of the direct contribution from the
sun. It is with sky r a d i a t i o n as apposed to global r a d i a t i o n [sun + sky] t h a t illuminating engineers measure the contribution of daylight to
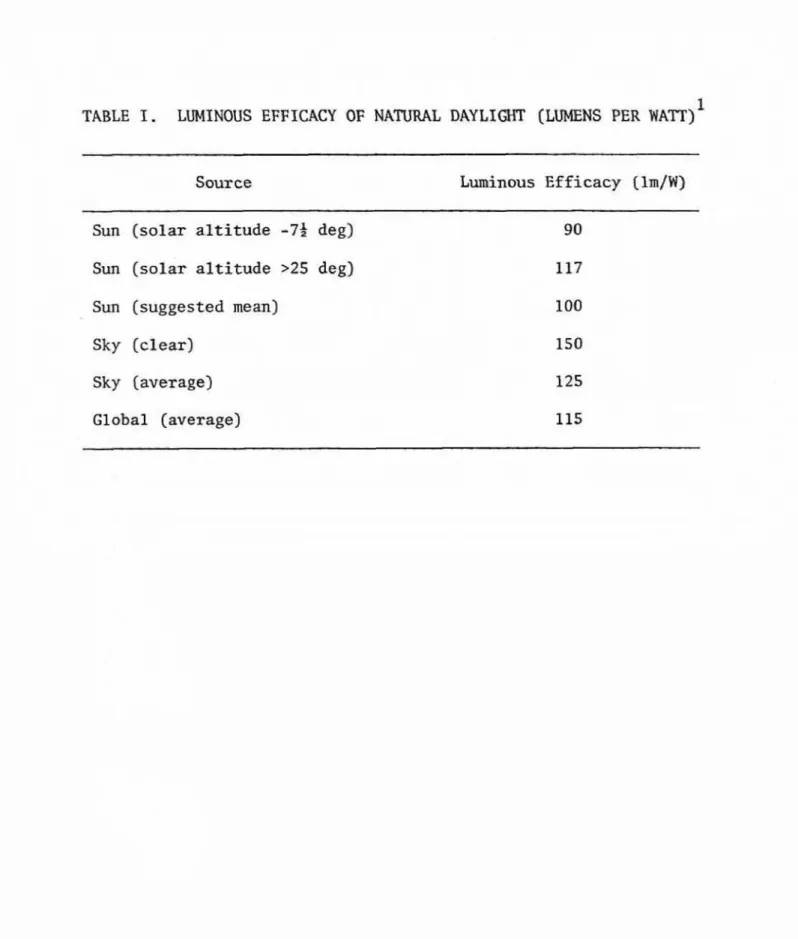
interior illumination. Radiation data can be readily converted to units
o f visible r a d i a t i o n by using the appropriate luminous efficacy factor
{see Table
I].
Hourly global radiation data collected at NRC, Ottawa,have been converted to units of illuminance using a lumlnous e f f i c a c y of 115 Im/W. The luminous efficacy of global radiation changes with the
temporal changes in the spectral power distribution of t h e sun and sky.
The v a l u e chosen for the present study i s an average value f o r global radiation (Table I]
.
In the time available it has not been possible to measure accurately
ar to calculate daylight factors. As t h e office has opposite walls almost e n t i r e l y glazed, however, it is estimated that a substantial part of the space will have Daylight Factors greater than 2 per cent, with m i n i m u m values of 5 per cent for locations within 3 m of the window.
DESCRIPTION OF OFFTCE
Data were collected f o r approximately three weeks between 23 August and 17 September 1977 in the Sir Charles Tupper Building, Confederation Heights, O t t a w a . A plan of t h e o f f i c e , with furniture and luminaire
l a y o u t , is given in F i g u r e 3 . Only the southwest p o r t i o n of the office was monftsred, since there was a large obstruction on t h e northeast side; three cameras would be required t o monitor the entire space. The major a c t i v i t y carried out in this space could be described as general office work, i . e . , reading, writing, and working discussions. Hours of
attendance f o r the occupants are f l e x i b l e between a starting time of 0730 h and f i n i s h i n g t h e of 1800 h. The cleaning schedule is n o t well defined, but in p r a c t i c e cleaning takes place between 1630 and 1830 h, with a l l cleaning staff out of the building by 2000 h.
The switching arrangement f o r the luminaires is indicated in
Figure 3 . A 24 V low voltage switching system is used with wall-mounted r o c k e r switches. The individual switches are labelled in accordance with t h e f l o o r area They control. In addition, the floor areas marked Al, A2, 01, e t c . , are clearly indicated on t h e pillars on e i t h e r side of
t h e central corridor of the office area. Twin-tube 4 8 - i n . (1220 mm), 40 W cool white lamps were f i t t e d in t h e general o f f i c e area w i t h 4-tube 24-in. (610 mm), 20 Pl cool white lamps in t h e c e n t r a l c o r r i d o r .
The average horizontal illuminance at desk h e i g h t was 50 f o o t - candles (538 lux) with a lighting power load of approximately 1.8 w / f t Z
RESULTS
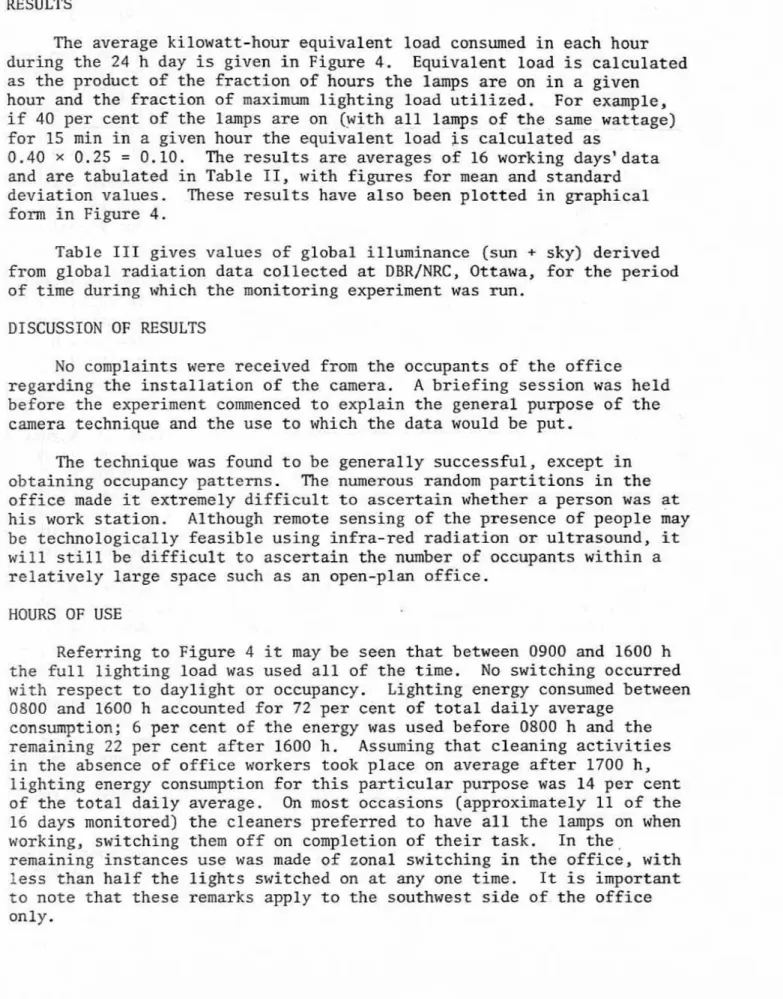
The average kilowatt-hour equivalent load consumed in each hour
during t h e 24 h day is given in Figure 4. Equivalent load is calculated
as the product of t h e f r a c t i o n of hours the lamps are an in a given
hour and the f r a c t i o n of maximum l i g h t i n g load utilized. For example, if 40 per cent of the lamps are on (with a l l lamps of t h e same wattage) far 15 min in a given hour the equivalent load is calculated as
0.40 x 0.25 = 0.10. The results are averages of 16 working days'data and are tabulated in Table TI, with figures for mean and standard d e v i a t i o n values. These r e s u l t s have a l s o been p l o t t e d i n graphical form in Figure 4 .
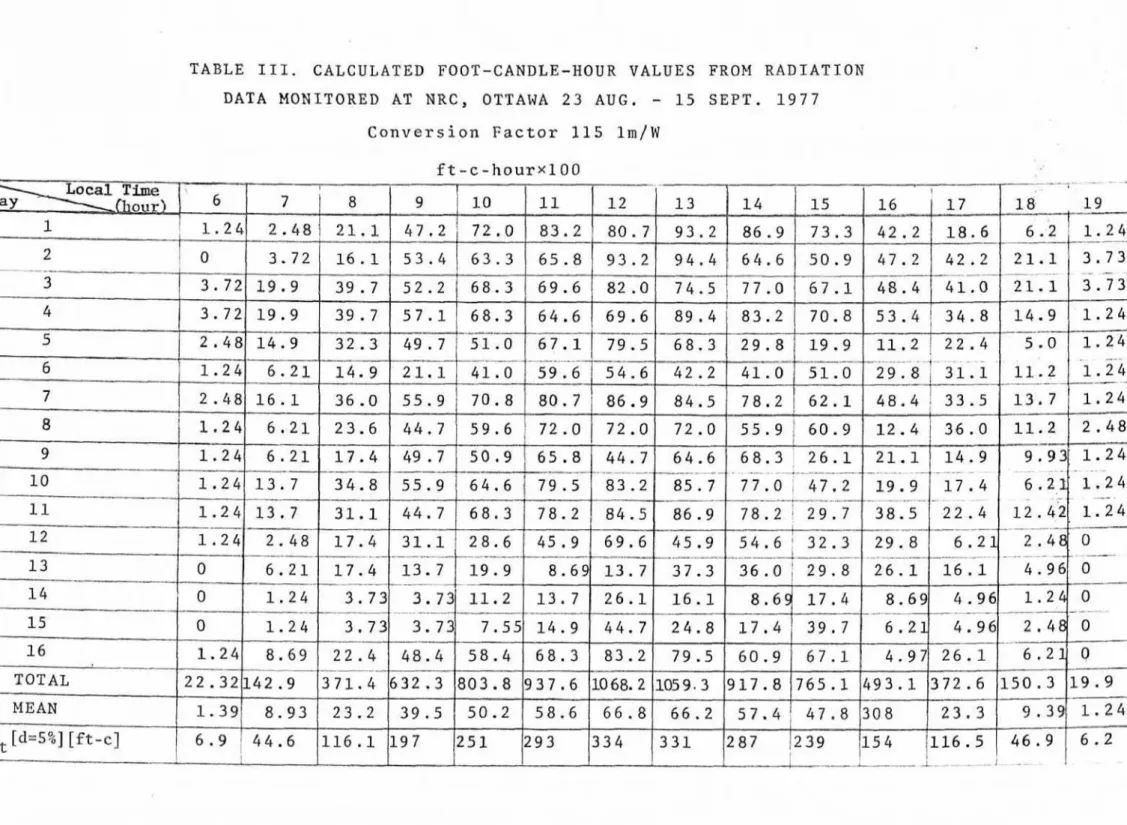
Table 111 gives values of global illuminance [sun + sky) derived from global r a d i a t i o n data c o l l e c t e d at DBRINRC, Ottawa, for the p e ~ i o d of time during which the monitoring experiment was run.
DISCUSSION OF RESULTS
No complaints were received from the occupants of t h e office regarding the installation of the camera. A b r i e f i n g session was h e l d before the experiment commenced t o explain t h e general purpose of the
camera technique and t h e use to which the d a t a would be put.
The technique was found to be generally successful, except in o b t a i n i n g occupancy patterns. The numerous random partitions in the office made it extremely d i f f i c u l t t o a s c e r t a t n whether a person was at his work station. Although emote sensing of the presence of people may
be technologically feasible using infra-red radiation or ultrasound, it will still. be difficult t o a s c e r t a i n the number of occupants w i t h i n a relatively large space such as an open-plan office.
HOURS OF USE
Referring to Figure 4 it may be seen t h a t between 0900 and 1600 h the full lighting load was used a l l of the time. No switching occurred with respect to d a y l i g h t or occupancy. Lighting energy consumed between
0800 and 1600 h accounted for 72 per cent o f total daily average consumption; 6 per cent of t h e energy w a s used before 0800 h and t h e
remaining 22 per cent a f t e r 1600 h . Assuming t h a t cleaning activities in the absence of office workers took place on average a f t e r 1700 h, lighting energy consumption f o r t h i s particular purpose was 14 per cent of the t o t a l daily average. On most occasions [approximately 11 of the
16 days monitored] the cleaners preferred to have all t h e lamps on when working, switching them o f f on completion o f their task. In the-
remaining instances use w a s made of zonal switching in the office, with less than half t h e l i g h t s switched on at any one time. It is important
to note t h a t these remarks apply to the southwest side of the office
PREDICTED USE IVITbIOUT ZONAL SWLTCI IING
Also illustrated in Figure 4 is the predicted use of artificial
l i g h t within the space if there is no zonal switching. This can be
calculated from t h e raw data by assuming t h a t each time the l q s are switched on or o f f t h e entire lighting load is under control, i . e . , t h e c o n d i t i o n s t h a t would prevail i f a s i n g l e switch controlled the e n t i r e space. The predicted quantities may be considered cmservative estimates because it is probable t h a t the lamps would be switched less frequently if there were only one switch control available. The difference in t o t a l
equivalent load between t h i s estimated use and the actual consumption provides a consewative estimate of the savings achieved from a zonal s w i t c h i n g facility to be 9 per cent. The t r u e savings lie somewhere
between this f i g u r e and savings that accrue when t h e zonal switching system is compared t o the s i t u a t i o n where the e n t i r e lighting load is completely o u t of control of t h e occupants, Then, the pattern of use would be similar to profile C in F i g u r e 4 . The d i f f e r e n c e between
p r o f i l e C and profile A represents a saving of 31 per cent. This saving indicates t h e d i f f e r e n c e in l i g h t i n g energy consumption t h a t can occur between an installation where the luminaires are on a s i n g l e switch circuit, out of t h e control of t h e occupants themselves, and an installation where zonal switching by the occupants is p o s s i b l e .
NATURAL DAYLIGHT
I n s u f f i c i e n t data do n o t p e m i t correlation of the probability of switching lights and internal illumtnance Levels from d a y l i g h t , but t h i s
will be an area of i n t e r e s t for future s t u d i e s . The global illuminance values in Table IT1 do indicate t h a t during t h e study t h e r e w a s a
considerable contribution from natural daylight to indoor light levels and t h a t this does not seem to have influenced the switching of luminaires during the "core-time" of 0800 to 1700 h, when t h e largest psoportim of l i g h t i n g energy is consumed. Interior illumination levels have been
calculated for a d a y l i g h t f a c t o r of 5 per cent and are given in Table 1 1 1 .
CONCLUSIONS
P a t t e r n of L i g h t i n g Use
The time-lapse camera technique proved successful in o b t a i n i n g
patterns of lighting use. It provided detailed information on t h e use of i n d i v i d u a l switching circuits and, thereby, the energy consumed. Although, f o r c e r t a i n installations, information on detailed occupancy patterns may be d i f f 5 c u l t to extract, it should be p o s s i b l e to d i s t i n g u i s h activities, e . g . , office work, cleaning. F u r t h e r data can be used to
analyse t h e i n f l u e n c e of design and location of the switch panel on the
u s e of a r t i f i c i a l l i g h t s .
To make the a n a l y s i s complete some information an n a t u r a l daylight contribution t o indoor illuminance levels will be needed. The collection
d i f f i c u l t y . Ideally, one would wish to measure indoor d a y l i g h t illuminance levels continuously or periodically. Problems arise,
however, from o b s t r u c t i o n s (including people) if measurements are taken at desk height, if curtains and blinds are used, and in subtracting t h e
contribution of a r t i f i c i a l l i g h t . Combining measured or calculated daylight factors with r a d i a t i o n data also has limitations. Firstly, s u i t a b l e radiation data [skylight only) must be available from a nearby
meteoralogical s t a t i o n . Apart from inaccuracies in measuring and calculating d a y l i g h t factor, by d e f i n i t i o n t h e f a c t o r excludes direct sunlight and is independent of e f f e c t s due to t h e orientation of the building.
Proposed Conse~vatian Measures f o ~ t h e Office Under Study
1. The high percentage of glazing i n t h e office i n r e l a t i o n to the
~ e l a t i v e l y narrow o f f i c e depth between g l a z e d walls i n d i c a t e s that the cost-effectiveness of daylight-linked control of a r t i f i c i a l light should be examined. The complete absence of zonal switching d u r i n g the core-time when a large contribution of natural daylight
to indoor illuminance levels occurs, guarantees significant energy savings over the present consumption l e v e l s .
More frequent use of the zonal switching facility could be realized if t h e wall-panel switches were located nearer t h e areas they serve. The possibility of using conventional or ceiling mounted pull-cord switches a d j a t e n t to t h e columns close t o these individual areas should be investigated. In addition, the zones t h e switches control should be decreased in area so t h a t each occupant can c o n t r o l the
artificial l i g h t w i t h i n h i s own o f f i c e space. Of cwrse, more switches must t h e n be installed, but t h i s should not prove t o e expensive since the low-voltage system is already installed.
The author wishes to thank R. Jaekel for h i s assistance in collecting and analysing the data; D . N . Heming, J.M. Matthew and colleagues, E . J , Mewman and C, Zwierzchowski of Public Works, Canada, f o r their invaluable co-operation.
REFERENCE
1. Hopkinson, R . G . , P. Perherbridge and J. Longmore, Daylighting,
TABLE I. LUMINOUS EFFICACY OF NATURAL DAYLIGHT (LWFENS PER WA'IT) 1
Source Luminous Efficacy (lm/W)
Sun (solar altitude -79 deg)
Sun (solar altitude 325 deg)
Sun (suggested m e a n ) Sky (clear)
Sky (average)
TABLE TII. C A L C U L A T E D FOOT-CANDLE-HOUR V A L U E S F R O M R A D I A T I O N DATA M O N I T O R E D AT N R C , OTTAWA 2 3 A U G .
-
1 5 S E P T . 1 9 7 7 Conversion F a c t o r 1 1 5I ~ / w
7 8 9 10 1 I 1 2 13 1 4 1 5'
1 . 2 4 1 . 2 4 1.24 1.24 1 . 2 4 0 0 0 2 . 4 8 1 6 . 1 6.21 1 16-
TQTAL MEAN-79.51
1059.3 6 6 . 2 3 6 . 0 2 3 . 6 1 - 2 4 8.69 2 2 1 3 2 - 3 8 0 3 . 8 937.6 1068.2 1.39 6 . 2 1 6 0 . 9 915.8 5 7 . 4 nt [d=5%] [ft-c] 17.4 5 5 . 9 4 4 . 71
765.1 4 7 . 83341-287239
8 . 9 3-
-116.1 6.9 4 4 . 6 I 70.8 5 9 . 6 , 4 9 . 7-
55.9 44.7 31.1..-
3 3 . 7 3 3 . 7 3 4 - 9 7 4 9 3 . 1 308 80.7 72.0 5 0 . 9 6 4 . 6 68.3 28.6 19.9 11.2 7 . 5 5 26.1 3 7 2 . 6 2 3 . 3---
13.7 1 3 . 7 2 . 4 8 .----. 6 . 2 1 1 . 2 4 1 . 2 4 PP 6.21 150.3 9 . 3 9--
4 6 . 9 2 3 . 2 197 84.5 7 2 . 0 I 8 6 . 9 72.0 6 5 . 8 --- ' 79.5 7 8 . 2 4 5 . 9 . 13.7---
1 4 . 9 3 4 . 8 31.1 17.4 17.4 ----. 3 . 7 3 -.---. 3 . 7 3 0 19.9 1.24 46.9*2 6 4 . 6 85.7 -- 4 5 . 9 3 7 . 3 16.1 2 4 . 8 4 4 . 7 .. 8 3 . 2 8 4 . 5 6 9 . 6 .---.-..-l.----.,-..-- 8 . 6 9 1 3 . 7 26.1 4 4 . 7 3 9 - 5 2 5 1 7 8 . 2 i 6 2 . 1 5 5 . 9 ; 60.9 2 9 3 5 0 . 2 6 8 . 3 , 26.1 -- 7 7 . 0 I 4 7 . 2 --+--- --. .- 8 6 . 9 - 7 8 . 2 ! 2 9 . 7 5 4 . 6 ! 3 2 . 3 4 3 6 . 0 i 2 9 . 8 . - -8 . 6 4 17.4 1 3 . 7 ' 1 - 2 4 1 1 . 2 ' 2 . 4 8 I 17.4-
5 8 . 6 1 2 . 4 21.1 -- 1 9 . 9 "-. ~- .- 3 8 . 5 29-,-8 . " --.+--.-- 26.1 8 . 6 9 - -* - 6.21--
3 9 , 7 6 6 . 8 9.93 . 6.21' ' 1 2 . 4 2 2 . 4 P . Q - 4 . 9 6 6 1 . 2 4 4 8 . 4 . 3 3 . 5 3 6 . 0 14.9 - - - 17.4-
2 2 . 4 6.21-
16.1 4 . 9 6 -- 4 . 9 6 1 . 2 4 - 1 - 2 4 1 . ~ 2 4-
0 2 . 4 P 0 .. -F i g u r e 1
Picture o f camera in ceiling
I-.
F i g u r e 2
TIJPPE R 3 A west D S W I T C H P A N E L L O C A T l O N C A M E H A L O C A I I O N S W I T C H C O N T R O L A R t A 5 T O T A L O F b S W I T C H E S F i 91rc -3
o f o f f i c e i n c l u d i n g f ~ ~ r n i t u r e and Euminai re layout
A l , A 7 A > . A * A S . A 6 8 2 , B J 8 4 , I35 & 6
.
S C A L E u 1 . 5 rnA ACTUAL USE OF LIGHTING E M R G Y
W
D PREOlETEO ADDIT1OMAL USE WlTHDUT ZmAL
SWIRHIMG
4 I. 2
0
PREDtCTED USE IF SVI ITCHING OUT E CONTAM OF DCCUPAlyfi