HAL Id: in2p3-00125255
http://hal.in2p3.fr/in2p3-00125255
Submitted on 18 Jan 2007HAL is a multi-disciplinary open access
archive for the deposit and dissemination of sci-entific research documents, whether they are pub-lished or not. The documents may come from teaching and research institutions in France or abroad, or from public or private research centers.
L’archive ouverte pluridisciplinaire HAL, est destinée au dépôt et à la diffusion de documents scientifiques de niveau recherche, publiés ou non, émanant des établissements d’enseignement et de recherche français ou étrangers, des laboratoires publics ou privés.
Additional Evidence for Low Mass Exotic Baryons
B. Tatischeff, E. Tomasi-Gustafsson
To cite this version:
B. Tatischeff, E. Tomasi-Gustafsson. Additional Evidence for Low Mass Exotic Baryons. 11th Inter-national Conference on Nuclear Reaction Mechanisms, Jun 2006, Varenna, Italy. pp.339-348. �in2p3-00125255�
Additional Evidence for Low Mass Exotic Baryons
B. Tatischeff
1∗Institut de Physique Nucl´eaire
CNRS/IN2P3, F–91406 Orsay Cedex, France
E. Tomasi-Gustafsson
2†DAPNIA/SPhN, CEA/Saclay
91191 Gif-sur-Yvette Cedex, France
This paper aims to give further evidence for the existence of low mass exotic baryons. It consists of two parts:
- first it recalls some results, already shown or even previously published, which reflect the existence of narrow low mass baryonic states,
- then it presents new results obtained through the analysis of recent data from JLAB. We will show that these results are compatible with our previous observation, namely that the broad PDG baryonic resonances can be shared into several more narrow ones .
1
Already shown
(although not always known) results
The first observation of narrow baryonic structures was done nine years ago in the missing mass of the pp→pπ+X reaction at Saturne (SPES3 beam line) [1]. Fig. 1 shows the pres-ence of small narrow structures, located between the neutron and the ∆(3,3) missing mass peaks. These structures were observed at nearly all angles and incident energies available. Later on, smaller structures were observed at other masses, in the missing mass and invari-ant mass of the previous reaction as well as in pp→ppX reaction. The results concerning the 1.0≤M≤1.46 GeV mass range [2], then the 1.47≤M≤1.68 GeV mass range [3], pointed out to the presence of several narrow and weakly excited structures. These structures were observed at the same masses, indicating that we observe genuine baryonic states.
In the mass range 1.47≤M≤1.68 GeV, we suggest, see fig. 2, that the broad PDG bary-onic resonances are collective states of several weakly excited and narrow resonances, which can be single-particle-or-quasi-particle states, more complicated than |q >3
. The reason for which the PDG resonances have so large widths may be due to the lack of experimental precision in previous experiments.
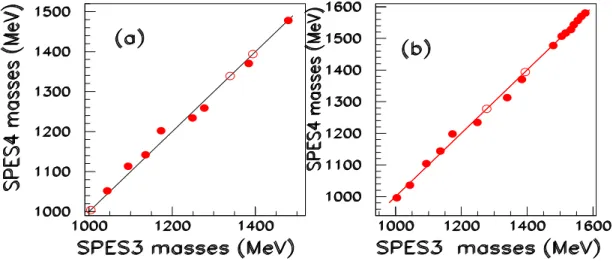
We observe sometimes, in previously published data by various authors, narrow discon-tinuities in their spectra, which were not discussed. This is observed as well for reactions using incident hadron beams, as for reactions using lepton beams. However the structures below pion production threshold are not observed in reactions using incident leptons. The authors of these papers, where data exhibit small and narrow structures, did not take into account the possibility to associate the discontinuities of their spectra with possible narrow baryonic low mass structures. Fig. 3 shows one of the most striking example: the p(α, α′)X
reaction was studied at SPES4 (Saturne) in order to study the excitation of the Roper resonance. Above projectile and target excitations, both histograms taken at θ=0.80
[4]
∗e-mail : tati@ipno.in2p3.fr †e-mail : etomasi@cea.fr
and 20
[5], exhibit well statistically defined structures. Their masses agree with the masses observed in the SPES3 data [3] (see fig. 4).
600 800 1000 1200 1400 1600 950 1000 1050 1100 600 800 1000 1200 1400 1600 1800 950 1000 1050 1100 300 400 500 600 700 800 900 1000 1100 950 1000 1050 1100 300 400 500 600 700 800 900 1000 1100 1200 950 1000 1050 1100
Figure 1: Missing mass spectra of the pp→pπ+
X reaction [1] measured at SPES3 (Saturne).
Figure 2: Disintegration channels of the narrow baryonic resonances experimentally ob-served [3] and attempt to associate them with broad PDG resonances using the disintegra-tion channels pη and pπ, or pπ alone.
Fig. 5 illustrates some narrow structures observed with leptons. Inserts (a) and (b) show low energy Compton scattering from the proton, measured at Saskatchewan [6]. A narrow structure is observed, close to M=1094 MeV. A structure at the same mass was extracted from SPES3 data. Insert (c) shows a narrow peak at M=1050 MeV in the Compton scattering data measured at Mainz [7]. This mass is close to M=1044 MeV (SPES3 value). The Mainz cross-sections at θ=590
, 850
, 1070
, 1350
, and 1550
are added, in order to reduce the statistical errors. Insert (d) shows a small peak corresponding to a narrow dibaryon at M=2053.4 MeV observed in data from JLAB [8]. This value is very close to the SPES3 mass M=2052 MeV.
Figure 3: p(α, α′)X spectra at T
α=4.2 GeV, θ = 0.80 in upper insert [4], and θ = 20 in
lower insert [5], measured at SPES4 (Saturne).
Figure 4: Comparison between masses of narrow baryons extracted from SPES3 and SPES4 data. Inserts (a) and (b) correspond respectively to θ=0.80
[4] and θ=20
[5].
2
Analysis of recent data from JLAB
Three reactions of virtual photons scattered on protons are discussed here: - ep→e’pγ [9] studied by the Hall A Collaboration
- ep→e’pπ0
[10] studied by the Hall A Collaboration. - ep→e’nπ+
[11] studied by the CLAS Collaboration,
The two last experiments have measured the same (except isospin) structure functions, but at different kinematical values of Q2
, and θ∗. The corresponding data are presented
with 20 MeV bins. The resolution is better in Hall A than in CLAS, but in both cases it is not well suited for the study of narrow structures since the experiments were not performed
Figure 5: Narrow hadrons produced by leptons. Inserts (a) (θ = 900
) and (b) (θ = 1410
) show sections of Compton scattering from the proton [6], insert (c) shows total cross-section of Compton scattering [7](see text). Insert (d) shows a narrow dibaryonic peak observed at θe ≈ 200 in the ed scattering data [8], with Ee = 4.05 GeV (see text).
for such study. These structures can be found in spectra corresponding to many different kinematical conditions; a selection among the many histograms is done for the present discussion.
Some figures presented later exhibit structures below and above M=1230 MeV. Since there is no PDG broad resonance with the same quantum numbers as those of N, before M=1440 MeV, such results cannot be attributed to interferences between several PDG resonances. An interference between the ∆(1230)P33 and the non resonant background is
possible, but it will unlikely give rise to several narrow oscillations as those observed in several figures shown later. It is likely that the non-resonant background amplitudes vary slowly and steadily for increasing baryonic masses. Alternative explanation, consistent with previous observations [3], is the existence of some narrow baryonic states in the mass region discussed here. We have not adjusted the masses and have kept those found in the analysis of the SPES3 data (two structures at M=1173 MeV and M=1249 MeV are described here by one structure at M=1220 MeV). A constant gaussian width is kept for each set of data. In the discussion concerning the γ∗p→pπ reactions, we compare the experimental data to
the calculations performed with the MAID model [12].
2.1
ep
→e’pγ
The virtual Compton scattering cross sections were measured by the Hall A Collaboration [9]. They are given at backward angles versus the mass of the hadronic system (C.M.S.). No background was subtracted. It was shown [9] that the BH+Born as well as BH+Born+π0
exchange cross sections are smooth. Fig. 6 shows, for three different kinematical conditions, the need of several narrow structures to describe the histograms. The masses are those ex-tracted from the SPES3 results. The same width (FWHM=36 MeV) allows to get a good fit, when only the heights of the peaks are varied. More results of the same quality are available in several different kinematical conditions and always the structures are extracted at the same positions.
The mass values are: α:1004 MeV, β:1044 MeV, γ:1094 MeV, δ:1136 MeV, ǫ:1173 MeV, η:1212 MeV, φ:1249 MeV, λ:1277 MeV, and µ:1339 MeV. We observe in (a) a well defined
(β) structure, and the absence of a ∆(1220) peak. All three inserts display an oscillatory behaviour, specially for the first lower mass structures. A ∆(1220) peak exists in insert (c) but with a width much lower than Γ1/2=120 MeV. Such approach ignores all interferences,
otherwise the number of free parameters will strongy increase.
In order to enhance the precision, the cross sections at different Φ values are added. Φ is the azimutal angle between the leptonic and the hadronic planes. Fig. 7 shows, that the same comments as those done for Fig. 6, can be done for data plotted in insert (b): narrow β peak and nearly no ∆(1220) peak. Six different cross sections corresponding to different Φ angles are added in fig. 8 for Q2
= 1 GeV2
and cos(θ∗
γγ)=-0.975. The ∆ peak,
if considered alone, is located here at M=1194 MeV, a value too low by ∆M≈30 MeV (FWHM=118 MeV). It is plotted with a dashed line, as well as the nucleon peak. It is unlikely to have, in the context of the PDG baryons, any coherent contribution between 1.0 and 1.2 GeV since there is no interference between N and ∆. An interference with non coherent background is possible but we observe that the experimental cross section is larger than half the ∆ cross section.
Figure 6: Cross sections of the γ∗p→ γp reaction [9] at Q2
= 1 GeV2
. Inserts (a), (b), and (c) correspond respectively to the following kinematical conditions: cos(θ∗
γγ)=-0.65, Φ = 450 , cos(θ∗ γγ)=-0.65, Φ = 105 0 , and cos(θ∗ γγ)=-0.975, Φ = 15 0 .
The extracted yields of the narrow structures are continuous and are well fitted by the formula d2
σ/dΩ∗
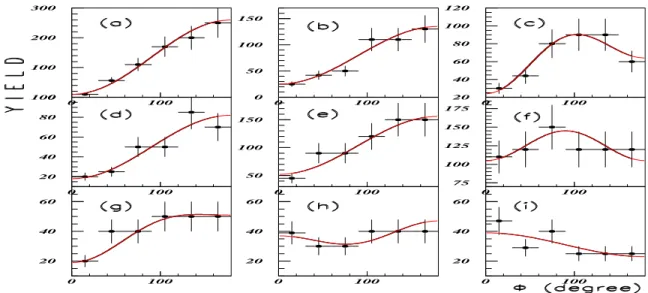
π=a + b cos(Φ) + c cos(2Φ). Fig. 9 shows these fits.
2.2
ep
→e’pπ
0Backward π0
electroproduction on protons were measured by the Hall A Collaboration [10]. No background is introduced in the figures corresponding to this subsection, since the cross sections of the interference structure functions versus W, the mass of the hadronic system, present positive as well as negative values. Fig. 10 shows, in the four inserts, the cross section of the same structure function σT T at Q2=1 GeV2 at four backward polar angles:
0 200 400 600 800 1000 0.95 1 1.05 1.1 1.15 1.2 1.25 0 100 200 300 400 500 600 700 800 900 0.95 1 1.05 1.1 1.15 1.2 1.25 1.3 1.35
Figure 7: Cross sections of the γ∗p→ γp reaction [9] at Q2
= 1 GeV2
. Both inserts correspond respectively to the following kinematical conditions. (a): cos(θ∗
γγ)=-0.875 and Φ = 1350 plus Φ = 1650 , (b): cos(θ∗ γγ)=-0.65 and Φ = 45 0 plus Φ = 750 plus Φ = 1050 .
Figure 8: Cross sections of the γ∗p→ γp reaction [9] at Q2
= 1 GeV2
and cos(θ∗
γγ)=-0.975
(see text).
A good adjustment is obtained with again the same narrow structure masses as before, and a common width FWHM=56 MeV. Here the oscillatory structure is not present, but the width of a single gaussian, would be close to FWHM=66 MeV (dashed line), and not 120 MeV as quoted in PDG.
Fig. 11 shows the dσT/dΩ + ǫ dσL/dΩ structure function for the same kinematical
condi-tions as in fig. 10. In these two figures the dashed lines show the MAID results. Although the global shape is reproduced, we observe a decrease of the quantitative agreement with decreasing angles and, of course, the missing of the small experimental structures in the 1.35≤M≤1.43 GeV range.
2.3
ep
→e’nπ
+Some cross sections of the structure functions from ep→e’nπ+
reaction, measured by the CLAS Collaboration [11], are plotted versus the mass of the hadronic system W. No back-ground is subtracted, here again, since the cross sections of the interference structure func-tions present positive and negative values. Fig. 12 shows three cross-section corresponding to the following structure functions:
0 100 200 300 0 100 0 50 100 150 0 100 20 40 60 80 100 120 0 100 20 40 60 80 100 0 100 50 100 150 0 100 75 100 125 150 175 0 100 20 40 60 0 100 20 40 60 0 100 20 40 60 0 100
Figure 9: Fits versus Φ of the narrow structures (a): 1004 MeV, (b): 1044 MeV, (c): 1094 MeV, (d): 1136 MeV, (e): 1173 MeV, (f): 1212 MeV, (g): 1249 MeV, (h): 1277 MeV, and (i): 1339 MeV (see text).
-0.35 -0.3 -0.25 -0.2 -0.15 -0.1 -0.05 0 0.05 0.1 1.2 1.4 1.6 -1.2 -1 -0.8 -0.6 -0.4 -0.2 0 1.2 1.4 1.6 -1.8 -1.6 -1.4 -1.2 -1 -0.8 -0.6 -0.4 -0.2 0 1.2 1.4 1.6 -2.5 -2 -1.5 -1 -0.5 0 1.2 1.4 1.6
Figure 10: Cross sections of the σT T structure function [10] corresponding to the backkward
π0
electroproduction on p at Q2
= 1 GeV2
(see text).
σT + ǫ σL, σT L, and σT T corresponding to four transfer squared Q2=0.4 GeV2 and
θγγ = 22.50. The FWHM of the main peak, for inserts (a), (b), and (c), equal respectively
235 MeV, 57 MeV, and 61 MeV, when the analysis with the same structure masses as before, and again a single width (FWHM=82 MeV), allows good fits.
Fig. 13 shows the σT + ǫ σL structure function at θ=7.50 and Q2=0.3 GeV2 in
in-sert (a) and Q2
=0.4 GeV2
in insert (b); and the σT T structure functions at θ=37.50 and
Q2
=0.3 GeV2
in insert (c) and Q2
=0.4 GeV2
in insert (d). The dashed curves correspond to MAID. We observe that the MAID results miss a large part of the experimental spectra, mainly in fig. 12(b), 12(c), 13(a), 13(c), and 13(d).
Fig.14 shows at Q2
=0.3 GeV2
, the σT L in insert (a) and σT T insert(b) at θ=52.50, and
the same for θ=67.50
in inserts (c) and (d). The data are not correctly reproduced by MAID for W≥1280 MeV in inserts (a) and (b).
0 0.5 1 1.5 2 2.5 3 3.5 4 4.5 1.2 1.4 1.6 0.5 1 1.5 2 2.5 3 3.5 4 4.5 5 1.2 1.4 1.6 0 1 2 3 4 5 6 1.2 1.4 1.6 0 1 2 3 4 5 6 1.2 1.4 1.6
Figure 11: Cross sections of the σT T structure function [10] corresponding to the backward
π0 electroproduction on p at Q2 = 1 GeV2 (see text). 2 4 6 8 10 12 14 16 1100 1200 1300 1400 1500 -2 -1 0 1 2 3 4 1100 1200 1300 1400 1500 -4 -3 -2 -1 0 1 2 1100 1200 1300 1400 1500
Figure 12: Cross section of the structure functions from the ep→e’nπ+
reaction [11] mea-sured at Q2
=0.4 GeV2
, θ=22.50
(see text).
It is necessary, in order to strengthen these decompositions, to verify the continuity of the narrow peak surfaces, for different angles θ. This is tentatively done in fig. 15: the left (right) part of the figure, shows the σT T (σT L) results. We observe the close values obtained
from the Q2
=0.4 GeV2
(full circles) and Q2
=0.3 GeV2
(empty circles) structure functions. We observe also a good continuity for increasing angles. The curves are fitted according to dσ/dΩ = ΣnAncosnθ. An arbitrary error of 20% was applied on all points. The dashed
curves show the angular distribution corresponding to l=1, J=3/2 quantum numbers. We see that such contribution fit correctly the data for the structure at M=1220 MeV (and above M=1400 MeV) in σT T cross section, and fit only the M=1136 MeV structure in the
σT L cross section. Insert (a) of the σT T structure function. is well fitted with a distribution
of the form: 1-cos(θ), like the inserts (b) and (d) of σT L. We tentatively conclude that
5 10 15 20 25 30 1100 1200 1300 1400 1500 0 2.5 5 7.5 10 12.5 15 17.5 20 22.5 25 1100 1200 1300 1400 1500 -8 -7 -6 -5 -4 -3 -2 -1 0 1 1100 1200 1300 1400 1500 -6 -5 -4 -3 -2 -1 0 1 1100 1200 1300 1400 1500
Figure 13: Cross section of the structure functions from the ep→e’nπ+
reaction [11] (see text). -4 -3 -2 -1 0 1 2 1100 1200 1300 1400 1500 -7 -6 -5 -4 -3 -2 -1 0 1100 1200 1300 1400 1500 -4 -3.5 -3 -2.5 -2 -1.5 -1 -0.5 0 1100 1200 1300 1400 1500 -8 -6 -4 -2 0 1100 1200 1300 1400 1500
Figure 14: Cross section of the structure functions from the ep→e’nπ+
reaction [11] (see text).
3
Conclusion
We have shown the existence of many narrow low mass baryonic states, which renew the importance of the study of baryon spectroscopy. Indeed, narrow structures are observed by different groups, in different reactions and different laboratories.
These states are exotic since there is no room for them, within the |q >3
models. Some sim-ple phenomenological mass formula were proposed which involve the existence of q ¯q pairs (see references in [2]). A real theoretical study does not exist today. New dedicated exper-iments are needed, with large statistics, small bins and good resolution, typically ∆M≤ 5 MeV.
-300 -200 -100 0 25 50 75 100 125 -800 -600 -400 -200 25 50 75 100 125 -200 0 200 400 25 50 75 100 125 -300 -200 -100 0 25 50 75 100 125 -200 -100 0 25 50 75 100 125 -400 -300 -200 -100 0 25 50 75 100 125 -300 -200 -100 0 25 50 75 100 125 -800 -600 -400 -200 25 50 75 100 125 -200 0 200 400 25 50 75 100 125 -300 -200 -100 0 25 50 75 100 125 -200 -100 0 25 50 75 100 125 -400 -300 -200 -100 0 25 50 75 100 125 -150 -100 -50 25 50 75 100 125 -400 -200 0 200 25 50 75 100 125 0 100 200 25 50 75 100 125 -100 -50 0 25 50 75 100 125 0 50 100 150 25 50 75 100 125 -100 -50 0 50 25 50 75 100 125
Figure 15: Cross section of the structure functions from the ep→e’nπ+
reaction [11] inte-grated over the narrow peak surfaces. The six inserts correspond to the following masses: (a) 1136 MeV, (b) 1220 MeV, (c) 1277 MeV, (d) 1339 MeV, (e) 1423 MeV, and (f) 1480 MeV. narrow resonances. These last may be single-particle or quasi-particle states with more complicated structures than |q >3
. They were not observed previously, probably due to the lack of experimental precision. Such suggestion agrees with two observations:
- the mean mass of the several narrow baryons, observed in the 1460≤M≤1680 MeV mass range in SPES3 data, are very close to M=1535 MeV (S11) and M=1650 MeV (S11) for the
states which deexcite into Nπ and Nη, and very close to 1520 (D13) and 1600 (∆P33) for
the states which deexcite only into Nπ (see fig. 2),
- the many data observed at JLAB, from the Hall A, or from the CLAS collaboration, are compatible with the presence of several narrow baryonic structures. In some cases, small experimental structures in the mass range between 1.30 GeV and 1.45 GeV, not reproduced by MAID fits, favours our interpretation,
- the structure fits are tentatively presented, since a better experimental resolution is nec-essary on the one hand, and since such extraction ignores the physical background and interferences on the other hand.
It is therefore difficult to use these angular distributions to suggest quantum numbers and parities of the narrow resonances. Moreover the previous figures show some overlap between structures. If the main part of the overlap is due to physic widths (and not experimental), then possible interferences between them should also be considered.
References
[1] B. Tatischeff, J. Yonnet, N. Willis et al., Phys. Rev. Lett. 79, 601 (1997). [2] B. Tatischeff, J. Yonnet, M. Boivin et al., Eur. Phys. J. A 17, 245 (2003). [3] B. Tatischeff, J. Yonnet, M. Boivin et al., Phys. Rev. C72, 0304004 (2005) [4] H.P. Morsch, M. Boivin, W. Jacobs et al., Phys. Rev. Lett. 69, 1336 (1992).
[5] H.P. Morsch, in Proceedings of the Dixi`eme Journ´ee Th`ematique de l’IPN d’Orsay (1995).
[6] E.L. Hallin et al., Phys. Rev. C48, 1497 (1993).
[7] V. Olmos de Leon et al., Eur. Phys. J. A 10, 207 (2001). [8] D. Abbott et al., Phys. Rev. Lett. 82, 1379 (1999).
[9] G. Laveissi`ere et al. The Hall A Collaboration, arXiv:hep-ex/0406062 (2004). [10] G. Laveissi`ere et al. The Hall A Collaboration, arXiv:hep-ex/0308009 (2004). [11] H. Egiyan et al. Phys. Rev. C73, 025204 (2006).
![Figure 1: Missing mass spectra of the pp→pπ + X reaction [1] measured at SPES3 (Saturne).](https://thumb-eu.123doks.com/thumbv2/123doknet/12886770.370373/3.894.171.760.158.506/figure-missing-mass-spectra-reaction-measured-spes-saturne.webp)
![Figure 5: Narrow hadrons produced by leptons. Inserts (a) (θ = 90 0 ) and (b) (θ = 141 0 ) show sections of Compton scattering from the proton [6], insert (c) shows total cross-section of Compton scattering [7](see text)](https://thumb-eu.123doks.com/thumbv2/123doknet/12886770.370373/5.894.161.792.71.390/figure-produced-inserts-sections-compton-scattering-compton-scattering.webp)
![Figure 6: Cross sections of the γ ∗ p→ γp reaction [9] at Q 2 = 1 GeV 2 . Inserts (a), (b), and (c) correspond respectively to the following kinematical conditions: cos(θ γγ∗ )=-0.65, Φ = 45 0 , cos(θ γγ∗ )=-0.65, Φ = 105 0 , and cos(θ ∗ γγ )=-0.975, Φ = 1](https://thumb-eu.123doks.com/thumbv2/123doknet/12886770.370373/6.894.160.777.443.790/sections-reaction-inserts-correspond-respectively-following-kinematical-conditions.webp)
![Figure 7: Cross sections of the γ ∗ p→ γp reaction [9] at Q 2 = 1 GeV 2 . Both inserts correspond respectively to the following kinematical conditions](https://thumb-eu.123doks.com/thumbv2/123doknet/12886770.370373/7.894.158.775.65.351/figure-sections-reaction-correspond-respectively-following-kinematical-conditions.webp)
![Figure 12: Cross section of the structure functions from the ep→e’nπ + reaction [11] mea- mea-sured at Q 2 =0.4 GeV 2 , θ=22.5 0 (see text).](https://thumb-eu.123doks.com/thumbv2/123doknet/12886770.370373/9.894.167.693.472.762/figure-cross-section-structure-functions-reaction-sured-gev.webp)
![Figure 13: Cross section of the structure functions from the ep→e’nπ + reaction [11] (see text)](https://thumb-eu.123doks.com/thumbv2/123doknet/12886770.370373/10.894.163.683.63.433/figure-cross-section-structure-functions-nπ-reaction-text.webp)
![Figure 15: Cross section of the structure functions from the ep→e’nπ + reaction [11] inte- inte-grated over the narrow peak surfaces](https://thumb-eu.123doks.com/thumbv2/123doknet/12886770.370373/11.894.160.785.73.321/figure-cross-section-structure-functions-reaction-grated-surfaces.webp)
