HAL Id: cea-02509722
https://hal-cea.archives-ouvertes.fr/cea-02509722
Submitted on 17 Mar 2020
HAL is a multi-disciplinary open access
archive for the deposit and dissemination of
sci-entific research documents, whether they are
pub-lished or not. The documents may come from
teaching and research institutions in France or
abroad, or from public or private research centers.
L’archive ouverte pluridisciplinaire HAL, est
destinée au dépôt et à la diffusion de documents
scientifiques de niveau recherche, publiés ou non,
émanant des établissements d’enseignement et de
recherche français ou étrangers, des laboratoires
publics ou privés.
New insights in phase equilibria of
U_0.55Pu_0.45O_2
− x
Romain Vauchy, Renaud Belin, Anne-Charlotte Robisson, Fiqiri Hodaj
To cite this version:
Romain Vauchy, Renaud Belin, Anne-Charlotte Robisson, Fiqiri Hodaj. New insights in phase
equi-libria of U_0.55Pu_0.45O_2
− x. IYNC 2016 - International Youth Nuclear Congress, Jul 2016,
New insights into the phase separation in U
0.55
Pu
0.45
O
2-x
mixed oxide
Romain VAUCHY
1, Renaud C. BELIN
2, Anne-Charlotte ROBISSON
2, Fiqiri HODAJ
3,41
CEA, DEN, DTEC, Marcoule, F-13108 Saint-Paul-lez-Durance, France
2
CEA, DEN, DEC, Cadarache, F-13108 Saint-Paul-lez-Durance, France
3
Univ. Grenoble Alpes, SIMAP, F-38000 Grenoble, France
4
CNRS, SIMAP, F-38000 Grenoble, France
I. INTRODUCTION
Uranium-plutonium mixed oxides U1-yPuyO2-x with high plutonium content (y > 0.20) are multiphasic at room temperature [1-9]. The miscibility gap is composed of two fluorite face-centered cubic fcc phases for the lower Pu contents (0.20 ≤ y ≤ 0.45) and of an fcc phase in equilibrium with an α-Pu2O3-type body centred cubic bcc phase in the higher plutonium content range [2-4]. The two phases constituting the hypostoichiometric mixed oxides inside de miscibility gap region, exhibit different oxygen content and are so called “high-oxygen” and “low-oxygen” phases, respectively [6,7,9]. Furthermore, the phase separation not only depends on the plutonium content but also on the Oxygen/Metal ratio and on the temperature. At high temperature, the miscibility gap boundary is shifted to higher Pu contents and disappears at 1073 K [2]. An isopleth section of the miscibility gap is dome-shaped whose top corresponds to the so called critical temperature of phase separation Tc (Figure 1).
Figure 1. 3D sketch of the miscibility gap and isopleth section
The aim of the present work is to investigate in situ by means of High Temperature X-Ray Diffraction (HT-XRD) the variations in structural changes of uranium-plutonium mixed oxides U0.55Pu0.45O2-x when subjected either to very prompt (2 K.s-1) or slow cooling rates (0.005 K.s-1) from 1773 K to room temperature under He + 5% H2 + ~20 vpm H2O.
II. MATERIALS AND METHODS
A. Materials
Uranium dioxide powder was produced by a wet fabrication route based on the formation of ammonium diuranate (ADU)
from uranyl nitrate precipitated with ammonia. The obtained particles were then atomized, dried and calcinated, leading to spherical-shaped agglomerates of around 20 µm. Plutonium dioxide powder was produced by precipitation of a plutonium nitrate solution with oxalic acid to form plutonium oxalate. The particles were heated in air at 923 K and parallelepiped-shaped PuO2 particles were obtained with an average size of 15 µm.
Uranium-plutonium mixed oxide samples U0.55Pu0.45O2-x were obtained by mixing UO2 with PuO2. The mixture was then micronized by co-milling in order to improve the U-Pu distribution in the final material. Then, the powder was pressed into pellets (~2 g/pellet) at ~400 MPa, sintered at 2023 K for 24 hours under Ar + 5% H2 + ~1500 vpm H2O and slowly cooled at ~0.01 K.s-1. These conditions were determined according to the thermodynamic model proposed by Besmann and Lindemer [10-12] to obtain stoichiometric compounds (x = 0). As determined by XRD, the samples were stoichiometric and monophasic at room temperature. The detailed fabrication process is described elsewhere [13].
B. High-temperature X-ray diffraction
XRD measurements were performed at ambient pressure and various temperatures with a Bragg–Brentano θ-θ BRUKER D8 Advance X-ray diffractometer using copper radiation from a conventional tube source (Kα1 + Kα2 radiation : λ = 1.5406 and 1.5444 Å) at 40 kV and 40 mA, and a LynX’Eye fast-counting PSD detector with an opening angle of 3° 2θ. The entire apparatus resides in its own custom-built nitrogen-filled glove-box dedicated to handling of nuclear materials at the LEFCA facility (CEA Cadarache, France). The diffractometer is equipped with heating stage from MRI PhysikalischeGerate GmbH TC-Radiation of volume 0.5 L, allowing heating of the sample up to 2273 K. Under reducing atmosphere, it uses both a molybdenum strip as a direct heater and a tantalum radiant heater. After each setup adjustment, a temperature calibration was carried out in steps of 100 K from room-temperature to 1973 K, using tungsten powder (ALDRICH, 99.999%). Tungsten lattice parameters as a function of temperature were taken from references [14,15]. Temperature calibration was repeated several times. Calibration results were then compared, giving a constant temperature uncertainty of 15 K across the temperature range used. Rocking curve and displacement corrections were systematically applied to take into account the angular position and displacement of the strip. Powder diffraction patterns were obtained by scanning from 22° to 145° 2θ in isothermal conditions at each temperature. A
counting time of 0.3 s per step and step-intervals of 0.02° 2θ were chosen.
Prior to measurement, the obtained dense pellets were manually finely crushed in an agate mortar and subsequently annealed in situ in the HT-XRD at 1773 K under He + 5% H2 + ~20 vpm H2O.
Cooling at 0.005 K.s-1 was performed by steps of 100 K from 1773 K to room-temperature. Since reaching thermodynamic equilibrium between the solid and the gas phases might require a long duration, a significant annealing time (~5 to ~10 hours) at each investigated temperature was maintained. Achievement of thermodynamic equilibrium was validated when steady lattice parameter values were obtained at a given temperature. The 2 K.s-1 cooling rate, in situ XRD measurements were performed in fixed-angle mode taking benefits of the LynX’Eye fast-counting PSD detector with an opening angle of 3° 2θ. This method allowed realizing fast measurements (15 s) while following the evolution of the (311) peak of the fcc structure with temperature. The restricted angular range did not allow determining lattice parameter values as a function of temperature.
III. RESULTS AND DISCUSSION
A. Cooling at 2 K.s-1
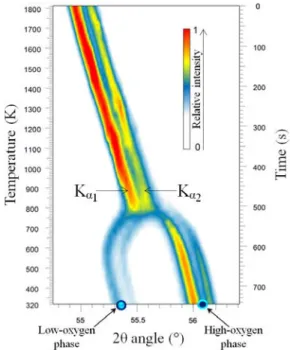
Figure 2 represents the isodensity map of the XRD (311) peak intensity of the fcc structure of the U0.55Pu0.45O2-x samples as a function of temperature and time during cooling at 2 K.s-1 under He + 5% H
2 + ~20 vpm H2O. The doubling of intensities corresponds to the Kα1 + Kα2 of the same (311) contribution.
Figure 2. Isodensity maps of the (311) peak intensity of the fcc structure of U0.55Pu0.45O2-x during cooling at 2 K.s-1 under He + 5% H2 + ~20 vpm H2O
The angular position of the (311) peak linearly shifts to higher angles in the 800 K < T < 1800 K range. This corresponds to a contraction in the lattice parameter. Then, in
the 700 K < T < 800 K range, the single XRD peak splits into two contributions, evidencing the phase separation. The most intense contribution is shifted to higher angles while the least intense is shifted to lower angles. They correspond to the high-oxygen and low-high-oxygen fcc phases, respectively. The temperature of phase separation determined during cooling is equal to 770 ± 15 K.
Comparing our results with that reported in the literature is important. For a U0.58Pu0.42O2-x material, Markin et al. reported the value of 768 K [2]. This temperature is very close to that determined in the present study. Moreover, according to the Guéneau’s representation [16], the calculation gives 790 K for the critical phase separation temperature for y = 0.42. That is also in very nice agreement with our experimental observation, although our material was cooled at a fast rate, i.e. out of equilibrium.
B. Cooling at 0.005 K.s-1
Similarly to section A, Figure 3 represents the isodensity map of the XRD (311) peak intensity of the fcc structure of the U0.55Pu0.45O2-x samples as a function of temperature and time during cooling at 0.005 K.s-1 under He + 5% H
2 + ~20 vpm H2O. The doubling of intensities corresponds to the Kα1 + Kα2 of the same (311) contribution.
Figure 3. Isodensity maps of the (311) peak intensity of the fcc structure of U0.55Pu0.45O2-x during cooling at 0.005 K.s-1 under He + 5% H2 + ~20 vpm
H2O
Because no more peak drift is observed after each temperature step, i.e. that lattice parameter values are stable, it is possible to assert that thermodynamic equilibrium between the sample and the surrounding gas is reached for each temperature. Contrary to the promptly cooled samples that exhibited a phase separation, it is very clear when the sample is cooled at 0.005 K.s-1 that the mixed oxide is monophasic at any temperature. These measurements then evidenced a complete oxidation of the sample up to O/M = 2.00 during cooling even
under He + 5% H2 + ~20 vpm H2O which is usually considered as a “reducing” gas mixture.
C. Experiments vs. Calculations
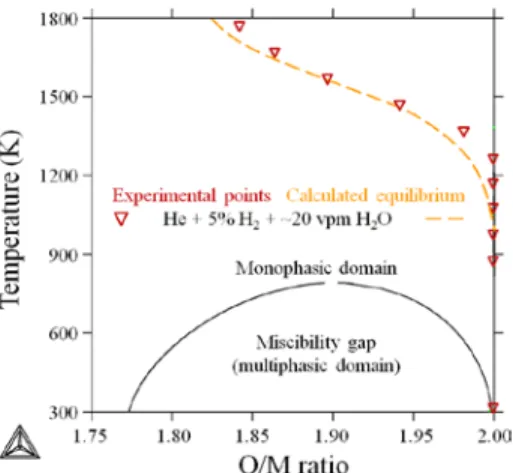
As detailed in a previous study [8], it is possible to estimate the O/M ratio of the constitutive phase of our monophasic sample by assessing that the slopes of iso-O/M ratio lines were similar regardless of the deviation from stoichiometry. As a consequence, we made the approximation that they are parallel with an average slope. Using Markin’s O/M ratio values for all lines [2], we plotted the difference in O/M against the distance between a given line and the one corresponding to O/M = 1.789. Since this plot turned out linear, we extrapolated the previously determined lattice parameter evolution lines for each O/M ratio that Markin studied to higher temperatures, assuming linear thermal expansion up to 1750 K. Then, for each temperature, we determined the distance between the O/M = 1.789 line and our experimental value of the lattice parameter. Ultimately, this allowed determining the O/M ratio as a function of temperature of our U0.55Pu0.45O2-x sample according to equation (1). a T M O = + ⋅ − × − × 565 . 3 10 78 . 22 3075 . 21 5 (1)
where T is the temperature in K and a the lattice parameter in Å at this temperature. The uncertainties on both temperature and lattice parameter measurements make it possible to estimate O/M ratio values with an uncertainty of ± 0.005.
Experimental O/M ratio vs. temperature data points are compared to the associated calculated equilibrium under the considered gas mixture (He + 5% H2 + ~20 vpm). As shown in Figure 4, experiments and calculation are in good agreement. The calculated miscibility gap existing in the considered composition/temperature range is also reported and the thermodynamic path followed by the sample during the thermal treatment appears to be very distant from it which is consistent with the fact that no phase separation was observed experimentally.
Figure 4. Experimental O/M ratios of U0.55Pu0.45O2-x as a function of
temperature (triangles) as determined according to Eq. (1). The orange dashed
line corresponds to calculated equilibrium involving Thermo-Calc Software [17] and the SGTE pure database [16].
D. Conclusion
HT-XRD study provides innovative fundamental data on the U0.55Pu0.45O2-x uranium-plutonium mixed oxide. Contrary to main of results reported in the literature, the samples were annealed in situ for a very long time at each temperature under He + 5% H2 + ~20 vpm H2O allowing to assert that thermodynamic equilibrium between solid and gas phases was reached. This experiment revealed that, contrary to previous studies, reaching thermodynamic equilibrium leads to monophasic stoichiometric mixed oxide in the 293 K ≤ T ≤ 1300 K temperature range under the involved gas mixture.
ACKNOWLEDGMENT
The authors are pleased to acknowledge Mr. Y. Marc and Mr. J.-C. Richaud for their precious contribution to this work. The authors are also grateful to the CEA program AFCOE for financial support through Ph.D. funding.
REFERENCES [1] L.E. Russell et al., J. Nucl. Mater. 5, 216 (1962)
[2] T.L. Markin and R.S. Street, J. Inorg. Nucl. Chem. 29, 2265 (1967) [3] C. Sari et al., J. Nucl. Mater. 35, 267 (1970)
[4] G. Dean et al., Plutonium and Other Actinides, Plutonium 1970, 753 (1970)
[5] T. Truphémus et al., J. Nucl. Mater. 432, 378 (2013) [6] R. Vauchy et al., J. Eur. Ceram. Soc. 30(10), 2543 (2014) [7] R. Vauchy et al., J. Nucl. Mater. 456, 115 (2015) [8] R.C. Belin et al., J. Nucl. Mater. 465, 407 (2015) [9] R. Vauchy et al., J. Nucl. Mater. 465, 349 (2015)
[10] T.M. Besmann, T.B. Lindemer, Oak Ridge Technical Report, CONF-841105-59 (1984).
[11] T.M. Besmann, T.B. Lindemer, J. Nucl. Mater. 130, 489(1985) [12] T.M. Besmann, T.B. Lindemer, Oak Ridge Technical Report,
CONF-851115-34 (1985).
[13] R. Vauchy et al., Ceram. Inter. 40(7B), 10991 (2014)
[14] L.S. Dubrovinsky, S.K. Saxena, Phys. and Chem. of Minerals 24, 547 (1997)
[15] K. Wang, R.R. Reeber, Mat. Science and Engineering 23-3, 101 (1998) [16] C. Guéneau et al., J. Nucl. Mater. 419, 145 (2011)