HAL Id: hal-02145175
https://hal.archives-ouvertes.fr/hal-02145175
Preprint submitted on 1 Jun 2019
HAL is a multi-disciplinary open access
archive for the deposit and dissemination of
sci-entific research documents, whether they are
pub-lished or not. The documents may come from
teaching and research institutions in France or
abroad, or from public or private research centers.
L’archive ouverte pluridisciplinaire HAL, est
destinée au dépôt et à la diffusion de documents
scientifiques de niveau recherche, publiés ou non,
émanant des établissements d’enseignement et de
recherche français ou étrangers, des laboratoires
publics ou privés.
A NEW ADAPTIVE MOVING AVERAGE (VAMA)
TECHNICAL INDICATOR FOR FINANCIAL DATA
SMOOTHING
Alex Pierrefeu
To cite this version:
Alex Pierrefeu. A NEW ADAPTIVE MOVING AVERAGE (VAMA) TECHNICAL INDICATOR
FOR FINANCIAL DATA SMOOTHING. 2019. �hal-02145175�
A NEW ADAPTIVE MOVING AVERAGE
(VAMA)
TECHNICAL
INDICATOR FOR FINANCIAL DATA SMOOTHING
A PREPRINT
Alex Pierrefeu Sevilla, Dos Hermanas, 41700
May 30, 2019
A
BSTRACTThe separation of the trend from random fluctuations (noise) is a major objective in technical analysis and for a long time two commons filters, the simple moving average and the exponential moving average have been used to achieve this goal, those two filters use one parameter to control this degree of separation, higher degree of separation involve smoother results but also more lag. Lag is defined as the effect of a moving average to show past trends instead of new ones, this effect his unavoidable with causal filters and is a major drawback in decision timing . In this article I will introduce a new adaptive moving average technical indicator (VAMA) who aim to provide smooth results as well as providing fast decision timing. This new method will be used for the construction of a simple MA crossover strategy in EURUSD, the results of this strategy will then be compared to the results of the same strategy using other adaptive moving averages to provide a comparison of the profitability of this indicator.
Keywords Moving Average · Adaptive Moving Average · Smoothing · Filters · Technical indicator · Technical Analysis · Volatility
1
Introduction
One of the main characteristic of the financial market is its dynamic condition, so in order to respond to this dynamical behaviour as well as addressing solutions to the lag induced by classical filters various adaptive filtering methods have been proposed. Adaptive filters aim to adapt to characteristics of the market price, they might tend to adapt such that smoothness increase or decrease when market act in a certain way, some methods adapt to market trend strength [1], to market shape complexity [2], to the rate of change of the phase [3] or to market volatility [4]. Adapting to market characteristics require to quantify those characteristics in a smoothing variable αnwho will control the smoothness of
the filter. The smoothing variable used for the calculation of VAMA is a modified version of the ratio of open-close to high-low range indicator. This indicator originally measures the dispersion of the absolute difference of the close price with the open price relative to the difference of the high price with the low price and is calculated as follows : |Cn−On|
Hn−Ln
where Cnis the closing price, Onis the open price, Hnthe high price and Lnis the low price.
2
Moving Average Construction
This adaptive moving average will use a simple exponential filter architecture and is calculated as follows : V AM An = αnCn+ (1 − αn)V AM An−1
where αn=
|SM Ap(Cn) − SM Ap(On)|
APREPRINT- MAY30, 2019
A simple moving average of period p defined as SM Apis used to smooth each price components in order to increase
smoothness (decrease αn)when p increase.
3
Strategy Construction and Testing
3.1 Conditions
In order to test the profitability of the VAMA indicator, a simple MA crossover strategy will be tested with EURUSD, results will then be compared to the same strategy using other adaptive moving average instead of VAMA. The MA crossover strategy is a simple strategy who use the crosses of a fast moving average with a slow moving average to generate signals, a common period is 50 for the fast moving average (SM A50) and 200 for the slow moving average
(SM A200), when SM A50cross over SM A200a buy signal is generated and when SM A50cross under SM A200a
sell signal is generated. For this strategy SM A50will be replaced by VAMA with p = 50. The other adaptive moving
averages used for comparison will include the Kaufman adaptive moving average[1] (KAMA) with period = 50, Fractal adaptive moving average[2] (FRAMA) with period = 50, Mesa Adaptive Moving Average[3] (MAMA) with fast limit = 0.1and slow limit = 0.02, Variable Index Dynamic Average[4] (VIDYA) with period = 25, Parameters have been selected to reduce the difference between each moving average in order to have more accurate testing results. 3.2 Testing
The strategy is tested from 2018-02-06 to 2019-05-06 in 1H time frame and dollar as base currency, no commis-sion/spread have been applied to the test. Previous positions are exited when a new position is opened.
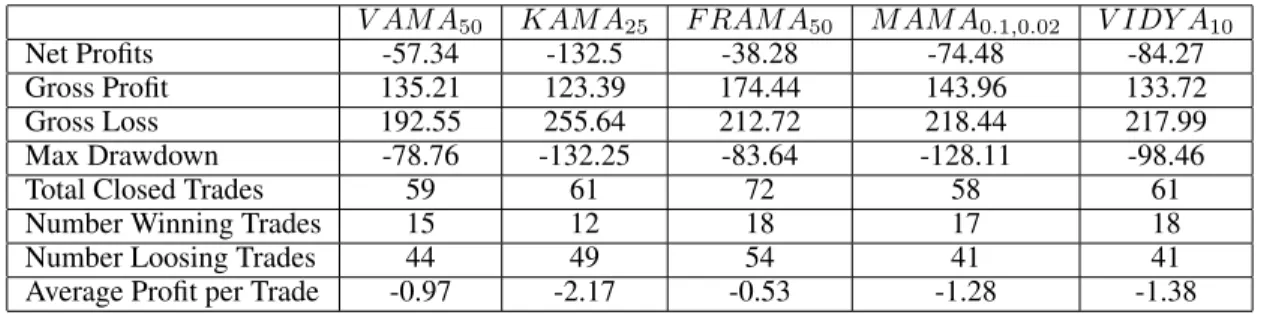
Table 1: Statistics of the strategy applied to EURUSD with order size of 1000 contracts V AM A50 KAM A25 F RAM A50 M AM A0.1,0.02 V IDY A10
Net Profits -57.34 -132.5 -38.28 -74.48 -84.27 Gross Profit 135.21 123.39 174.44 143.96 133.72
Gross Loss 192.55 255.64 212.72 218.44 217.99
Max Drawdown -78.76 -132.25 -83.64 -128.11 -98.46
Total Closed Trades 59 61 72 58 61
Number Winning Trades 15 12 18 17 18
Number Loosing Trades 44 49 54 41 41
Average Profit per Trade -0.97 -2.17 -0.53 -1.28 -1.38
4
Conclusion
I have presented a new adaptive moving average that adapt to a modified version of the ratio of open-close to high-low range indicator. Testing results show that the classic MA cross strategy is not profitable, however VAMA proved to have good results among other adaptive moving averages, this show that it can be interesting to adapt to market price based on high/low/open and not only closing price information, thus making the modified ratio of open-close to high-low range indicator an interesting smoothing variable for other adaptive indicators.
5
Pinescript Code
//@version=2 study("VAMA",overlay=true) length = input(14) //----c = sma(//----close,length) o = sma(open,length) h = sma(high,length) l = sma(low,length) lv = abs(c-o)/(h - l) //----ma = lv*close+(1-lv)*nz(//----ma[1],close) plot(ma,color=#FF0000,transp=0) 2APREPRINT- MAY30, 2019
References
[1] P. Kaufman, Trading Systems and Methods, John Wiley Sons, Third Edition (2008).
[2] J. Ehlers, "Fractal Adaptive Moving Average", Technical Analysis of Stock Commodities”, October 2005. [3] MAMA, Ehlers, John F., “Rocket Science for Traders”, New York, John Wiley Sons, 2001
[4] VIDYA, Chande, Tushar S. and Stanley Kroll, “The New Technical Trader”, New York, John Wiley Sons, 1994