HAL Id: hal-01652017
https://hal.inria.fr/hal-01652017
Submitted on 29 Nov 2017HAL is a multi-disciplinary open access
archive for the deposit and dissemination of sci-entific research documents, whether they are pub-lished or not. The documents may come from teaching and research institutions in France or abroad, or from public or private research centers.
L’archive ouverte pluridisciplinaire HAL, est destinée au dépôt et à la diffusion de documents scientifiques de niveau recherche, publiés ou non, émanant des établissements d’enseignement et de recherche français ou étrangers, des laboratoires publics ou privés.
Spectral CT reconstruction with an explicit
photon-counting detector model: a ” one-step ”
approach
Pierre-Antoine Rodesch, Véronique Rebuffel, Clarisse Fournier, Florence
Forbes, Loick Verger
To cite this version:
Pierre-Antoine Rodesch, Véronique Rebuffel, Clarisse Fournier, Florence Forbes, Loick Verger. Spec-tral CT reconstruction with an explicit photon-counting detector model: a ” one-step ” approach. SPIE Medical Imaging, Feb 2018, Houston, United States. pp.1057353, �10.1117/12.2285792�. �hal-01652017�
Spectral CT reconstruction with an explicit photon-counting detector
model: a “one-step” approach
Pierre-Antoine Rodesch*
a, V. Rebuffel
a, C. Fournier
a, F. Forbes
band L. Verger
aa
CEA, LETI, Univ. Grenoble Alpes, MINATEC Campus, F-38054 Grenoble, France
bUniv. Grenoble Alpes, INRIA, Laboratoire Jean Kuntzman, Equipe Mistis, France.
ABSTRACT
Recent developments in energy-discriminating Photon-Counting Detector (PCD) enable new horizons for spectral CT. With PCDs, new reconstruction methods take advantage of the spectral information measured through energy measurement bins. However PCDs have serious spectral distortion issues due to charge-sharing, fluorescence escape, pileup effect… Spectral CT with PCDs can be decomposed into two problems: a noisy geometric inversion problem (as in standard CT) and an additional PCD spectral degradation problem. The aim of the present study is to introduce a reconstruction method which solves both problems simultaneously: a “one-step” approach. An explicit linear detector model is used and characterized by a Detector Response Matrix (DRM). The algorithm reconstructs two basis material maps from energy-window transmission data. The results prove that the simultaneous inversion of both problems is well performed for simulation data. For comparison, we also perform a standard “two-step” approach: an advanced polynomial decomposition of measured sinograms combined with a filtered-back projection reconstruction. The results demonstrate the potential uses of this method for medical imaging or for non-destructive control in industry.
1. INTRODUCTION
Spectral CT using energy-discriminating PCDs has already shown good perspectives for effective use1-2. New methods are emerging in order to perform spectral CT for medical diagnosis or detect defaults in high-performance devices. The complete forward model of spectral CT can be divided into two parts: a geometrical projection through the object and the distortion of the attenuated spectrum by the detector response. To inverse this forward model two types of strategy can be adopted. The first one, inverses in a first step the detector response and then performs a reconstruction from converted data1. This approach is referred to as “two-step” in this paper. The second strategy consists of a simultaneous inversion of both parts of the complete forward model and is referred to as “one-step” approach3-4.
A key point of the problem is the spectral response of the detector which has to be taken into account. In the past few years, methods dealing with this issue have been investigated. We can distinguish two categories of solutions. The first one uses a calibration basis to decompose measured sinograms to basis material length sinograms. The second needs an explicit detector response model incorporated in the spectral distortion forward model1.
In this work a “one-step” method has been developed with explicit detector response function. This response is characterized by a Detector Response Matrix (DRM). This method allows to invert the spectral distortion caused by the detector and at the same time to apply a spatial constraint in the reconstruction process. The purpose is to obtain quantitative basis material maps while reducing artifacts (cupping artifact, striking artifact…).
2. METHOD
The attenuation coefficient of the volume is decomposed as the linear combination of two known basis material attenuation coefficients5. The method aims at reconstructing those two basis material maps. The detector response is modeled with a linear behavior: the attenuated spectrum is multiplied by a DRM to obtain the photon numbers.
The number of photons in measurement bin c for ray i is:
=
( ; )
( )
∑ ∑ ( )(1)
where ( ; ) is interpreted as the probability that a photon coming in the detector at energy is detected in measurement bin ; is indexing the voxels and m the basis materials; ( ) is the raw flux (number of photons coming
out of the x-ray generator at energy ); is the linear attenuation coefficient of basis material , is the projection matrix, and is the basis material map, the unknowns of the spectral CT problem.
We assume that , the measured photon number in bin c for ray i, follows a Poisson distribution with mean : ~ ( ) (2)
A spatial penalization is applied to the material basis maps:
{ } = − −
∈
(3)
where si the weight of the penalization, the voxel index, the neighbor voxels of voxel , the weight of each neighbor and the Tukey function:
( ) = 1 − 1 − | | <
1 ℎ .
(4)
Using the Bayesian framework, the reconstructed basis material maps are the solution of this problem:
{ }= ; ( { }) + { } (5)
with the Poisson log-likelihood depending on the actual measurements = { }, , on the estimated measurements
= { }, from basis material maps and the weight given to the regularization. To solve this problem, the algorithm
ML-TR6 (Maximum Likelihood-Transmission) has been adapted to our problem. The reconstruction is initialized with a standard polynomial “two-step” method in order to reach faster convergence to an acceptable solution.
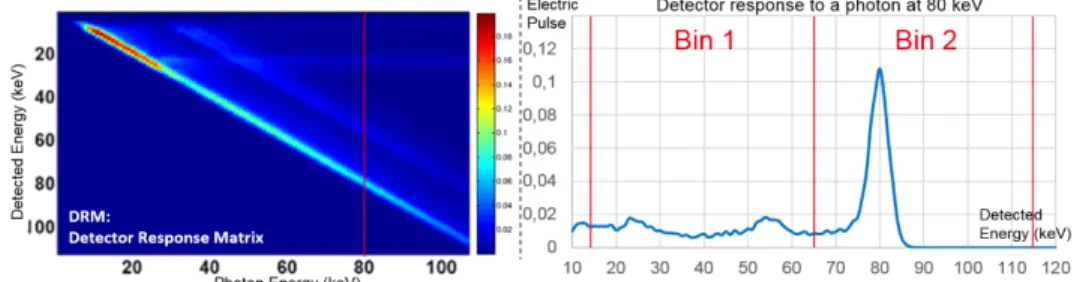
We tested our method on slice-CT simulation data. Measurements were generated with the software Sindbad-SFFD7. The study phantom is a 30 cm diameter cylinder of water with six 5 cm diameter inserts. Each insert is made of a different material such as cortical bone, a less attenuating bone material named compact bone, aluminum, adipose tissue, Polyethylene and Plexiglas. The source was set to 140kV with 0.1 cm aluminum filtering for an x-ray exposure of 5x10⁷ per pixel. The spectral convolution for this simulation was performed using a realistic DRM (cf Fig. 1). Two measurements bin have been used [15keV- 65keV] and [66keV - 115keV]. Poisson noise has been added to simulated data. The proposed method performed the reconstruction of two basis material maps: water and cortical bone.
Figure 1: Left: Detector Response Matrix for a CdTe detector. Right: Response of the detector for an incoming photon at 80keV. 3. RESULTS
Results are compared with a “two-step” method. We employed an advanced polynomial approach to decompose measured sinograms into water and cortical length sinograms. The attenuation range is divided in several zones and then in each zone a different second order polynomial is calculated. This improves decomposition results compared to a standard polynomial approach for a large attenuation range. Then a filtered-back projection was applied to the basis material length sinograms.
Figure 2 displays the reconstructed basis material maps for both “two-step” method for comparison and our “one-step” method. The truth image is also shown for reference. The material decomposition is well performed with both methods. However streaking artifacts are visible in the map 2.b) in the middle of the object and in the more attenuating inserts. These imperfections are corrected in our maps 1.c) and 2.c). The complete description of the forward model in the “one
Figure 2: Reconstructed basis material maps (Top: Cortical Bone maps; Bottom: water maps) (Inserts: 1: Compact bone, 2: Aluminium, 3: Polyethylene, 4: Plexiglas, 5: Cortical cone, 6: Adipose tissue)
True Image ‘‘Two-step’’ Method Rodesch et al. ‘‘One-Step’’ Method
Type of material C. B. map Water map C. B. map Water map C. B. map Water map
Water 0. 1. 0.01 0.97 0.00 1.00 Cortical Bone 1. 0. 0.91 0.18 0.99 0.02 Compact Bone 0.66 0.60 0.65 0.63 0.65 0.64 Aluminum 1.25 0.15 1.18 0.31 1.20 0.29 Polyethylene -0.06 1.07 -0.03 1.00 -0.05 1.04 Plexiglas -0.04 1.22 0.02 1.10 -0.03 1.20 Adipose Tissue -0.04 0.99 -0.01 0.94 -0.04 0.98
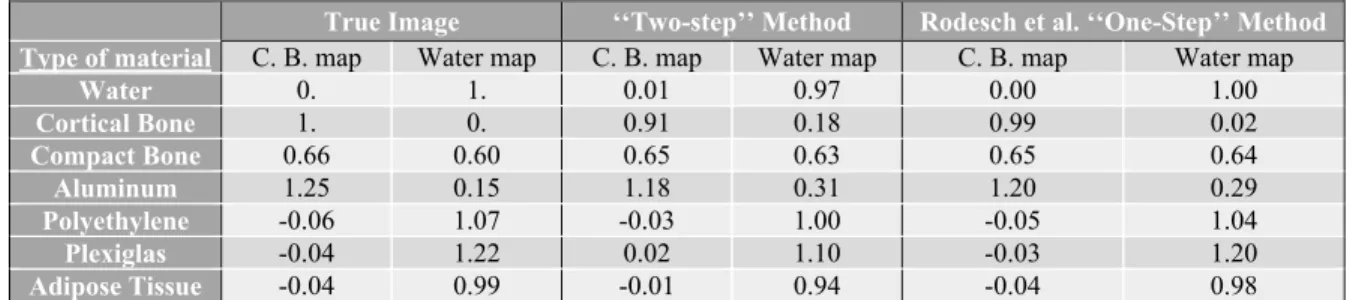
Table 1: Table with the mean values in each material basis map for each type of material (C. B. = Cortical Bone).
Figure 3: Representation of each ROIs reconstructed in a Cortical Bone/Water densities map. (Border voxels between two materials are not displayed for visibility). Left a): reference method; Right b): our method. Black markers ‘+’ are the truth mean values.
-step” method helps to correct those artifacts. Moreover, due to the robust penalization of the Tukey function, our results show very smooth reconstruction while preserving edges. The parameter of the spatial regularization (σ_t in equation (4)) was set to 0.1 for this phantom. In the map 2 c), some reconstructed inserts present minors shape imperfections. The seven regions of interest (ROI) we studied are the inside of the inserts and the water cylinder. Border voxels between two materials are not part of the analysis in Table 1 and Figure 3. Table 1 lists the mean density value for each ROI. The “two-step” approach presents relevant values in each material (around 5-10% of error). But our method has better results (close to 1% of error in ROIs).
Figure 3 display two maps where voxels of the seven ROIs are represented using the coordinate system (Cortical Bone density; Water density). The orientations of the scatter plots of the inserts are depending on the choice of the basis materials. We can observe the different inserts are distinguishable in the representation of figure 3 b). That is not the case for “two-step” method for comparison for softer inserts.
4. CONCLUSION & PERSPECTIVES
We developed a “one-step” method reconstruction for spectral CT with robust spatial prior. The decomposition into two basis material maps provides good results for simulated data with a realistic linear detector response function. The advantage of the “one-step” method class is that material decomposition can be performed from raw data with a spatial prior defined on the reconstructed volume. However one of the key point is the parameterization of the regularization used. Further experiments show that the efficiency of the prior term depends on the case studied and the field of application. Future work will investigate how to adapt the prior on other phantoms closer to medical applications which present more complex geometry and materials (especially soft tissues). With our algorithmic framework we will try to implement non spatial priors based on tissue-type identification or correlation between angles of view for the physics of detector. Some aspects of the detector will also be studied such as the confidence in the DRM, the non-linearity due to pile-up effect, the optimal choice of bin number.
REFERENCES
[1] J.-P. Schlomka, E. Roessl, R. Dorscheid, S. Dill, G. Martens, T. Istel, C. Bäumer, C. Herrmann, R. Steadman, G. Zeitler, A. Livne, and R. Proksa, “Experimental feasibility of multi-energy photon-counting K-edge imaging in pre-clinical computed tomography”, Phys. Med. Biol. 53, pp. 4031-4047, 2008.
[2] A. Brambilla, P. Ouvrier-Buffet, J. Rinkel, G. Gonon, C. Boudou, Member, IEEE, and L. Verger , “CdTe Linear Pixel X-Ray Detector With Enhanced Spectrometric Performance for High Flux X-Ray Imaging ”, IEEE Trans. Nucl. Sc. 59, pp. 1552-1558, 2012.
[3] R. F. Barber, E. Y. Sidky, T. Gilat Schmidt and X. Pan, “An algorithm for constrained one-step inversion of spectral CT data”, Phys. Med. Biol. 61, pp. 3784–3818, 2016.
[4] J. Liu and H. Gao, “Material reconstruction for spectral computed tomography with detector response function”, Inverse Problems 32, 2016.
[5] R. E. Alvarez and A. Macovski, “Energy-selective reconstructions in x-ray computerised tomography,” Phys. Med. Biol. 21, pp. 733, 1976.
[6] B. De Man, J. Nuyts, P. Dupont, G. Marchal and P. Suetens, “An iterative maximum-likelihood polychromatic algorithm for CT”, IEEE Trans. Med. Imaging 20, pp. 999–1008, 2001.
[7] V. Rebuffel, J. Tabary, P. Hugonnard, E. Popa, A. Brambilla, G. Montemont and L. Verger, “New functionalities of SINDBAD simulation software for spectral X-ray imaging using counting detectors with energy discrimination,” IEEE NSS/MIC, 2012.