Accepted Manuscript
Economical lipid production from Trichosporon oleaginosus via dissolved oxy-gen adjustment and crude glycerol addition
Xiaolei Zhang, Jiaxin Chen, Di Wu, Ji Li, Rajeshwar Dayal Tyagi, Rao Y. Surampalli
PII: S0960-8524(18)31560-8
DOI: https://doi.org/10.1016/j.biortech.2018.11.033
Reference: BITE 20685
To appear in: Bioresource Technology
Received Date: 26 September 2018
Revised Date: 6 November 2018
Accepted Date: 8 November 2018
Please cite this article as: Zhang, X., Chen, J., Wu, D., Li, J., Dayal Tyagi, R., Surampalli, R.Y., Economical lipid production from Trichosporon oleaginosus via dissolved oxygen adjustment and crude glycerol addition,
Bioresource Technology (2018), doi: https://doi.org/10.1016/j.biortech.2018.11.033
This is a PDF file of an unedited manuscript that has been accepted for publication. As a service to our customers we are providing this early version of the manuscript. The manuscript will undergo copyediting, typesetting, and review of the resulting proof before it is published in its final form. Please note that during the production process errors may be discovered which could affect the content, and all legal disclaimers that apply to the journal pertain.
Economical lipid production from Trichosporon oleaginosus via
dissolved oxygen adjustment and crude glycerol addition
Xiaolei Zhanga, Jiaxin Chena, Di Wub, Ji Lia,* Rajeshwar Dayal Tyagic, and Rao Y.
Surampallid
a Civil and Environmental Engineering Department, Harbin Institute of Technology Shenzhen
Graduate School, Shenzhen, Guangdong, P.R. China, 518055
bDepartment of Civil and Environmental Engineering, Chinese National Engineering Research Center
for Control and Treatment of Heavy Metal Pollution, and Water Technology Center, The Hong Kong University of Science and Technology, Hong Kong.
cINRS Eau, Terre et Environnement, 490, rue de la Couronne, Québec, Canada, G1K 9A9
dDepartment of Civil Engineering, University of Nebraska-Lincoln, N104 SEC PO Box 886105 Lincoln,
NE 68588-6105, U.S..
*Corresponding author: Tel: 86-(755) 2603-2692; Fax: 86-(755) 2670-3651. Email: ning-ting2004@hotmail.com
ABSTRACT
The effect of dissolved oxygen concentration on lipid accumulation in Trichosporon
oleaginosus has been investigated. The experiment was performed in 15 L fermenters.
The dissolved oxygen concentration varied by adjusting the agitation and aeration. High dissolved oxygen level at 50%-60% enhanced cell growth. Maintaining low dissolved oxygen concentration at 20%-30% during lipogenesis phase led to high final lipid content (51%) in Trichosporon oleaginosus. The consumptions of energy
oxygen level optimized process was 41% less than that with dissolved oxygen level at 50%-60%. In addition, the cost was also reduced around one time in the dissolved oxygen level optimized process compared to the one with dissolved oxygen level at 50%-60%. The study provided a feasible way of enhancing lipid accumulation in
Trichosporon oleaginosus and reducing the consumption of energy and cost of lipid
production from Trichosporon oleaginosus.
Keywords:
lipid accumulation; lipid content; dissolved oxygen concentration; energy balance; cost.1. Introduction
Lipid production from oleaginous microorganism has been given increasing attention due to its similar properties with plant seed oils, which is currently utilized as biodiesel production feedstock. The final lipid content in the oleaginous
microorganism is a critical factor to determine the feasibility of the biodiesel
production from oleaginous microorganism. Hence, lipid accumulation maximization has been the main focus of lipid production from oleaginous microorganism. It has been reported that the cultivation medium and cultivation conditions had significant impact on the lipid accumulation.
Cultivation medium composition highly impact on the lipid accumulation of oleaginous microorganism. Studies revealed that suitable carbon to nitrogen (C/N) ratio could greatly enhance the lipid accumulation (Calvey et al. 2016, Huang
Yingying et al. 2018b). Generally, high carbon to nitrogen ratio improved lipid accumulation. Calvey et al. (2016) reported that Lipomyces starkeyi stored double amount of lipid at C/N of 72:1 compared to that at 24:1. There are also reports on enhancing lipid accumulation by providing nitrogen limit cultivation condition (Fu et al. 2017, Chen Yixiong et al. 2018d, Huang Yingying et al. 2018b). In fact, it is the similar strategy as proving high C/N ratio during cultivation to increase lipid content in the microorganisms. Moreover, other nutrients such as phosphorus and silica could also affect on the lipid accumulation (Guo et al. 2018, Huang Xiangfeng et al. 2018a). Trace elements played significant role in the lipid accumulation in microorganisms (Ren et al. 2014, Leong et al. 2018). Among all, iron is the most studied one. It was reported that the lipid productivity increased along with the increase of iron
concentration till the concentration reached 1.2 mg/L. In addition, Mg has showed remarkable effect on lipid accumulation (Bellou et al. 2016, Kim et al. 2016). It was predicated that trace elements could stimulate the cell division as well as affect the enzymes which could promote the lipid accumulation. The type of substrate employed in the fermentation led to different maximum lipid content even for the same strain (Zhang et al. 2014, Zhang et al. 2017).
Apart from cultivation medium composition, fermentation conditions are important as well. The pH, temperature, and dissolved oxygen (DO) are the mostly controlled parameters during fermentation. The pH and temperature are normally strain dependent. Each strain has its required optimal pH and temperature.
compared to other pH value and temperatures (Capusoni et al. 2017, Chen Jiaxin et al. 2018a). The favorite pH and temperature for lipid accumulation of Cryptococcus
psychrotolerans was 6.8 and 25 ºC (Deeba et al. 2018). The optimization on the DO
during concentration has a more universal value in the application of lipid production from oleaginous microorganism as it is less strain specific. According to the studies, it seemed that DO was independent from strain (Calvey et al. 2016, Capusoni et al. 2017, Magdouli et al. 2018). Magdouli et al. (2018) and Capusoni (2017) found that 30% DO saturation provided highest lipid accumulation in Yarrowia lipolytica,
Rhodosporidium azoricum, and Trichosporon oleaginosus. High lipid production is
highly demanded in order to make the production of biodiesel from oleaginous microorganism feasible. High lipid production from oleaginous microorganism is determined by the high lipid accumulation (quality) as well as the high cell concentrations (quantity). In the exponential phase, cells probably require high oxygen concentration, therefore, constant low DO level may inhibit the cell division. It would lead to the low cell quantity and thus cause low lipid production due to the low lipid carriers.
In this study, the optimal DO concentrations for cell growth and lipid
accumulation were investigated, respectively. The selected DO was maintained during cell division phase and lipogenesis phase to optimize the lipid production from
Trichosporon oleaginosus. The energy consumption and the cost of the lipid
production in the optimized process were evaluated and compared with the normal process (without specific DO control).
2. Materials and methods
2.1. Strain
The employed oleaginous microorganism was Trichosporon oleaginosus (ATCC20509). It was preserved in malt extract at 4 ºC and duplicated every 7 days for maintaining its viability.
2.2. Cultivation medium
The medium contained2.7 g KH2PO4, 0.95 g Na2HPO4, 0.404 g NH4Cl, 0.2 g
MgSO4·7H2O, 0.1 g yeast extract, 0.1 g EDTA, 0.04 g CaCl2·2H2O, 0.0055 g
FeSO4·7H2O, 0.0052 g citric acid·H2O, 0.001 g ZnSO4·7H2O, and 0.00076 g MnSO4·
H2O and 50.94 g crude glycerol in per liter medium (Chen Jiaxin et al. 2018b). The
crude glycerol was collected from biodiesel production site. The composition of the crude glycerol was as listed: 78.52 ± 3.64% glycerol, 3.17 ± 1.11% soap, 1.14 ± 0.09% biodiesel, 11.03 ± 2.54% methanol, 1.85 ± 0.36% water, and 2.71 ± 0.17% ash. The pH and density of the glycerol was 8.98 and 1.184 ± 0.12, respectively. As the glycerol content in the crude glycerol was 78.52%, thus the glycerol concentration in the medium was 40 g/L.
2.3. Fermentation
The fermentations were performed in 15 L fermenters with 10 L working volume. The fermenters were equipped with accessories and programmable logic control (PLC) system for controlling the cultivation conditions including the pH, dissolved oxygen (DO) level, and temperature during fermentations. The fermentation conditions were controlled by manipulating the software (iFix 3.5, Intellution, USA) and allowing the integration of all parameters via PLC.
The pH and temperature were maintained at 6.5 (addition of 4M NaOH or 4M
H2SO4 by the system) and 28 ºC, respectively, throughout the fermentation (Zhang et
al. 2018). The antifoam was automatically added when the foam reached the sensor. The aeration and agitation were used to control the DO concentration (Zhang et al. 2018).
2.4. The dissolved oxygen concentration effect on the cell growth and lipid accumulation
The specific DO value was not able to be controlled. Therefore, the range of DO concentration or called DO level was used in this study. The DO level was adjusted at 10%-20%, 20%-30%, 30%-40%, 40%-50%, 50%-60%, 60%-70%, and 70%-80% in the fermentations to investigate DO effect on lipid accumulation. Each DO level was maintained throughout the fermentation. The fermentation was lasted till 72 h and the
samples were withdrawn at every 6 h for the analysis of the colony formation unit (CFU), biomass concentration, and lipid content.
After the optimal DO levels for cell division and lipid accumulation were
selected, the fermentation was conducted under the selected DO level to maximize the lipid production from T. oleaginosus.
For each case, the fermentations were performed in duplicates, and all the samples were analyzed in duplicates. The results were the average value.
2.5. Analysis technic
The cell number was estimated as following described: 1. the sample was well mixed; 2. taking 0.5 mL of the suspension to do serial dilution with sterilized 0.5% NaCl solution; 3. plating on malt extract agar plates; 4. incubating the plate at 28 ˚C for 48 h; 5. counting the conies on the plate with conies between 30 to 300; 6.
calculating the CFU (/mL) according to the dilution times. The biomass concentration was determined by centrifuging 10 mL of sample at 5000 rpm for 15 min, and the resulting solid was dried at 105 ºC till weight constant. The obtained solid was the biomass in 10 mL broth, and hence the biomass concentration (g/L) was calculated. The lipid was extracted by two times extraction with chloroform:methanol (2:1 v/v, 1:1 v/v) under beadmilling (Zhang et al. 2018). The lipid content was calculated according to the lipid weight in per gram dry biomass. The glycerol concentration was measured based on the method described in our previous study (Chen Jiaxin et al.
2018b).
2.6. Energy balance study
The energy balance was performed with the same method reported in our previous studies (Zhang et al. 2013, Zhang et al. 2016). Lipid production from microorganism included fermentation, biomass harvesting, and lipid extraction. The raw material utilized in the study was crude glycerol. It was assumed that the
fermentation occurred at the biodiesel production site where the crude glycerol was generated. Therefore, no transportation would take place, and thus there was no energy consumption. Hence, the calculation started from fermentation and ended once the biodiesel produced. The materials and energy inputs were considered taking place during the boundary.
The energy considered included direct and indirect energy. Direct energy referred to the fuels and electricity consumed in the process, and indirect energy was the energy consumed to generate the chemicals employed in the process. The energy input from fermentation till biodiesel produced was considered as direct energy input, and that of the chemicals was the indirect energy input. The sum of the direct and indirect energy was the total energy input of the process. The product of the process was biodiesel which has an energy content of 37.6 MJ/kg. The energy content in the produced biodiesel was considered as the energy output of the process. The
obtained by subtracting the credit from the total energy input. The energy balance was the difference between energy output and net energy input of the process.
The material balance was performed first, and accordingly the energy balance was conducted.
2.7. Cost estimation
The cost of lipid production from T. oleaginosus under DO level optimized condition was estimated with SuperPro Designer. The method was similar as reported in our previous study (Chen Jiaxin et al. 2018c). The estimation was based on the scale of 1 tonne lipid/day. As mentioned in the energy balance section, the production of biodiesel from microbial oil occurred in the biodiesel production plant; hence the raw material crude glycerol transportation fee was avoided. The cost of lipid
production mainly included the utilization of raw materials, consumption of utilities, employing labors, equipment depreciation and waste treatment.
Raw materials were the resources utilized during fermentation (nutrients) and lipid extraction (solvents). The prices of chemicals were obtained from ICIS, which provides the world-leading chemical pricing and information service, and offers the unrivalled coverage of global chemical and energy markets. Utilities were the fuels, power, steam, etc. The prices of the power, water, steam, fuels, and labor were chosen according to the real local market prices. Labor demanded was calculated by the software, and the basic rate of the labor was assumed to be 12 $/h, which was the
minimum required rate in local. The equipment depreciation was calculated by assuming that the equipment lifetime was 10 years. The equipment dependent was estimated by considering the depreciation, maintenance and miscellaneous. The equipment was selected according to their functions. The equipment purchase price was generated by the sofeware according to the required size and materials.
The operation time per year was 7920 h. As the process was built in the biodiesel production site, hence the administration system and logistics management were not considered in the cost estimation. In addition, the cost required in the yard improvement was ignored. Mass balance study performed in the energy balance study was the basic of the material input in cost estimation.
3. Results and discussion
3.1. Dissolved oxygen concentration effect on cell growth
Oxygen is the key in the growth of the microorganisms. It is the terminal electron acceptor in microorganism respiratory cascade, and participates on the formation of intracellular products such as carbohydrates and lipids. The oxygen as electron acceptor in the cell respiration degrades substrate and release adenosine triphophate (ATP). Intermediate products including NADPH and monosaccharides generated during respiration process are utilized to synthesize lipids and
that oxygen role in the production of energy storage products (lipids and
polysaccharides) (Atashrouz et al. 2018, Ginovart et al. 2018). It indicates that oxygen is essential in the cell division and lipid accumulation of oleaginous microorganisms.
The oxygen source can be air or pure oxygen, but air is generally employed in practice as it is cost free and easy to be obtained. Aeration is the most applied method to supply oxygen to the microorganisms. However, aeration requires power
consumption, which means the demand on the input of energy and cost. So far, many studies have reported that the main obstacle of biodiesel production from
microorganism was the unacceptable cost due to the low lipid production and high operation cost (Delrue et al. 2012, Richardson et al. 2012, Živković et al. 2017). Optimization of oxygen concentration during lipid production from microorganism was aimed to maximize the lipid production with the least energy and cost investment from the oxygen supply.
In this study, different DO level was maintained during fermentation. The CFU concentration was present in Fig. 1a. From 0 to 12 h, the CFU concentration was almost stable in all the cases, which was considered as the lag phase. The lag phase was caused due to the cultivation condition change from pre-culture medium (Yeast Extract Peptone Dextrose medium) to the fermentation medium. The microorganism required time to adapt the new environment and thus a lag phase was observed. From 12 h to 42 h, expect the case of DO10%-20%, the CFU concentrations sharply
increased at all DO level, and then kept almost stable. The CFU concentration
The maximum CFU concentration was 5.9E+08 /mL, which was only one log increase compared to the initial CFU concentration (0 h). However, the maximum CFU was at least two logs increased in the cases with other DO concentration levels.
The specific growth rates were 0.16, 1.60, 5.40, 9.38, 35.97, 41.63, and 38.99 h-1
for DO level of 10%-20%, 20%-30%, 30%-40%, 40%-50%, 50%-60%, and 60%-70%, respectively. Apart from DO level, the fermentation medium and cultivation
conditions were the same in all the fermentations. It suggests that low DO level could have inhibited the cell growth. After the DO concentration went up to 50%-60%, cell numbers dramatically increased during 12 h to 42 h, and no inhibition was observed. However, the maximum CFU was much lower in the case of DO level 20%-30%
(1.13E+09), 30%-40% (3.80E+09), and 40%-50% (7.40E+09) compared to that of 50%-60% (3.10E+10), 50%-60%-70% (3.70 E+10), and 70%-80% (3.98 E+10). There was not much different on CFU at the DO level of 50%-60%, 60%-70%, and 70%-80%. It indicates that DO level should be at least maintained at 50%-60% in order not to inhibit the cell division.
To prevent the inhibition of oxygen concentration on microorganism respiration,
the DO concentration in the system should be above the critical dissolve oxygen (Ccr)
concentration. The Ccr for yeast is normally 1.8%(Englezos et al. 2018). It suggested
that no inhibition on the respiration should have occurred even at DO level of 10%-20%. The rate of utilization of oxygen by the organism was constant in the system as
DO level was higher than the Ccr. Oxygen enters the cells by simple diffusion, which
the driving force. The higher the difference, the high of the oxygen transfer rate
(kmol·m-2·h-1). Thus, high DO levels in the medium lead to the high oxygen
transfer rate to the cell. It was observed that the utilization rate of oxygen by the strain was very high as the DO concentration was dropped to zero from 70%-80% after only 25 s. The high oxygen transfer rate (high DO level) insured the sufficient oxygen supply to the cells, and hence enhanced the cell growth. As observed, variation of CFU concentration in the case with the DO level of 50%-60%, 60%-70%, and 70%-80% was similar. It would be due to that DO level of 50%-60% has satisfied the need on oxygen by the microorganism (the oxygen transfer rate was equal or greater than the oxygen consumption rate). Further increase of the oxygen level would surely satisfy the oxygen demand. It indicates that the cell growth would not inhibit the cell growth when the DO level was up to 50%-60%.
3.2. Dissolved oxygen concentration effect on lipid accumulation
3.2.1. DO level effect on biomass growth
The variations of biomass concentration and lipid content during fermentation at different DO levels were shown in Fig. 1b and 1c. For the cases of 10%-20%, 20%-30%, 30%-40%, and 40%-50% DO, the biomass concentration gradually increased from the beginning till the end of the fermentation. It was observed that the glycerol concentration was gradually decreased in the fermentation with 10%-20%, 20%-30%, 30%-40%, and 40%-50% DO saturation (Fig. 1d). There was still glycerol left at the
end of the fermentations. It indicates that glycerol was sufficient throughout the fermentations. Hence it led to the continuous biomass increase.
In the fermentations with DO of 50%-60%, 60%-70%, and 70%-80%, the biomass concentrations slightly increase from 0 to 6 h, which was the adaption period for the microorganism to the new environment. From 6 h to 36 h, the biomass
concentration rapidly increased and thereafter (36 h to 54 h), the increase became slow. The biomass concentrations were slightly decreased after 54 h. From 0 h to 36 h, the glycerol and nitrogen were sufficient in the media. The biomass and cell numbers rapidly increased. From 36 h to 54 h, the glycerol was still in the media; however, the concentrations were low (Fig. 1d). It would thus inhibit the growth and then the biomass increase became slow. The glycerol was finished at around 60 h in the
fermentations conducted at DO level of 50%-60%, 60%-70%, and 70%-80% (Fig. 1d). It suggests that there was no more substrate available in the media after 60 h. Cells were still alive in the media and energy stored in the cells was consumed, and hence the decrease of biomass concentration was seen (Fig. 1b).
Compared to the fermentation with DO levels of 50%-60%, 60%-70%, and 70%-80%, the maximum biomass concentration and biomass increase rate were smaller in the fermentation with DO levels of 10%-20%, 20%-30%, 30%-40%, and 40%-50% (Fig. 1b and Fig.1e). In all the fermentations, the composition of the media and fermentation conditions were the same except the DO level. It indicates that the difference of biomass growth profile was due to the variation of the DO level in the fermentations. The DO levels have great impact on the growth of biomass.
3.2.2. DO level effect on lipid content
The results showed that the rapid increase in lipid content was from 18 h in the fermentation with DO level of 20%-30% and 30%-40% (Fig. 1c) and 30 h in the fermentation with DO level of 40%-50%, 50%-60%, 60%-70%, and 70%-80%, respectively, till around 48 h. It suggests that low DO level could induce the cell to enter the lipid accumulation phase earlier than that with high DO level.
It has been widely reported that nitrogen depletion in the medium could enhance lipid accumulation. In our previous studies, the maximum lipid content of T.
oleaginosus was 52% w/w dry biomass (at 56 h) after the fermentation got stable in
the fermentation with DO level of 70%-80% and nitrogen depletion (Chen Jiaxin et al. 2017). In this study, the maximum lipid content achieved was 51.26±2.57% w/w at 66 h with DO level of 20%-30% among all the fermentations. The nitrogen was still detected till 60 h in the fermentation with 20%-30%, 30%-40%, and 40%-50% DO saturation. However, the remarkable lipid accumulation was observed since 18 h till 48 h. It revealed that DO level has greatly enhanced the lipid accumulation.
Many studies have shown that oxygen was critical in lipid/fat accumulation for organisms and humans (Todd et al. 2006, Lam and Ip 2007, Taghibiglou et al. 2009, Calvey et al. 2016, Magdouli et al. 2018). People suffering from the diseases (such as sleep apnea and asthma) inducing or living in hypoxic environment were more likely to accumulate fat to get obesity (Beuther and Sutherland 2007, Lam and Ip 2007). It was observed that yeast (Yarrowia lipolytica), bacteria (Cryptococcus neoformans)
and other organism (Caenorhabditis elegans) tended to accumulate lipid in anoxic condition. Sterol response element binding protein1 also presented as SREBP1 (lipogenic transcription factor) could rapidly response to the anaerobic and hypoxic stresses. SREBP1 was found to alter the lipid metabolism (Espenshade and Hughes 2007). In the studies related to the human health, it was revealed that the alteration of SREBPs could lead to obesity (Shimomura et al. 2000, Foufelle and Ferre 2002). T.
oleaginosus is oleaginous yeast. Hypoxic environment condition would have affected
SREBP1 and hence stressed T. oleaginosus for lipid accumulation.
In this study, it was found that the cell divisions were very active during 12 h to 36 h in the fermentations with DO level of 40%-50%, 50%-60%, 60%-70%, and 70%-80%, but the lipid accumulation mainly occurred between 30 h to 48 h which was in low nitrogen concentration period (Fig. 11 and Fig. 1c). It suggests that oxygen transfer rate to the cell surface was equal or greater than the oxygen utilization rate by the cells when DO level was maintained at 40%-50%, 50%-60%, 60%-70%, and 70%-80%, and hence the lack of nitrogen in the media was the trigger for the lipid accumulation. In the fermentations with DO level of 20%-30% and 30%-40%, the lipid was fast accumulated during 18 to 48 h and nitrogen was sufficient before 40 h (Fig. 1c). It revealed that DO concentration was the main contributor of the lipid accumulation in the fermentations with DO level of 20%-30% and 30%-40%. It would be due to that the oxygen transfer rate to the cell surface with DO level of 20%-30% and 30%-40% was lower than the oxygen utilization rate by the cells. Hence, an anoxic condition was created in local and inside of the cells, which thus
affected on SREBP1 to drive T. oleaginosus for lipid accumulation. With the DO level of 10%-20%, the oxygen transfer rate to the cell surface was too low and even could have effected on the activity of the cells, and thus the lipid accumulation was low.
The major obstacle of application of microbial lipid for biodiesel production is the high production cost of microbial lipid (Ma et al. 2018, Shields-Menard et al. 2018). In fact, the low productivity of microbial lipid is responsible for the high cost. To increase the productivity (g lipid/L/h) requires increasing the lipid concentration to its maximum within short time. Lipid concentration is obtained by multiplying the lipid content with biomass concentration. High CFU concentration supplies high individuals for biomass growth and lipid accumulation carrier. To maximize the lipid production, the DO level during fermentation should be varied. According to the above discussion, the DO level could be maintained at around 50%-60% to 70%-80% from 0 h to 30 h (biomass rapid growth phase) and at around 20%-30% to 30%-40% from 30 h to the end of the fermentation, respectively, in order to achieve high lipid production.
3.3. Lipid production from T. oleaginosus under optimal DO levels
As discussed above, to obtain high lipid production from microorganism in the given substrate and nutrients required high cell numbers, biomass concentration and high lipid content within short fermentation time. The optimal DO levels for cell
division and biomass production were 50%-60% to 70%-80% and for lipid
accumulation were 20%-30% to 30%-40%, respectively. High DO level means high energy input. In this study, the DO level chosen for cell and biomass growth was 50%-60% (the minimum required) and for lipid accumulation was 20%-30% (the
minimum required). The fermentation time required to reach demand CFU was around 30 h, thus, the DO level was maintained at 50%-60% during the first 30 h of fermentation and then switched to DO level of 20%-30% till the end of the
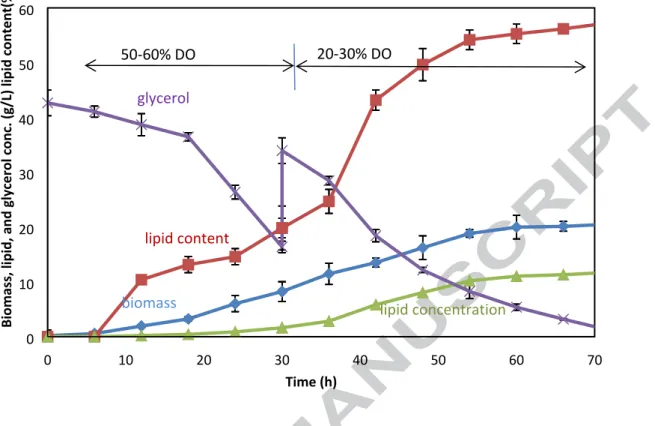
fermentation. It was also found that glycerol concentration was almost finished after 42 h (Fig. 1d). Glycerol was added in the base of 15 g/L according to the volume in order to avoid the inhibition of lipid accumulation due to the deficiency of glycerol. The control without addition of glycerol was also conducted. The fermentation conditions were shown in Fig. 2.
The variations of biomass concentration, lipid content, and glycerol
concentration during fermentation were shown in Fig. 3. The glycerol consumption and biomass growth followed similar trend as that of the fermentation with DO level of 50%-60% at the first 30 h (Fig. 1b, 1d, and Fig. 3). The biomass concentration and lipid content reached 8.24±1.79 g/L and 19.83±1.46%, respectively, at 30 h (Fig. 3). After the DO level was adjusted to 20%-30%, the lipid content dramatically increased (Fig. 3). The maximum lipid content was 57.30±1.78% at 72 h. In fact, the lipid content reached 54.17±1.78% at 54 h and thereafter it slowly increased till the end of the fermentation. In fact, the increase of biomass concentration was small as well after 54 h. It can be seen that the glycerol concentration was low during 54 h
to 72 h, which would have inhibit the lipid accumulation.
The lipid concentration was 10.20 g/L at 54 h, 11.04 g/L at 60 h, 11.31 at 66 h, and 11.77 g/L at 72 h, respectively. It suggested that it wouldn’t be necessary to prolong the fermentation time in order to increase lipid production after 54 h except that the glycerol addition would be performed at 54 h.
The maximum biomass concentration and lipid content in the fermentation with DO level of 50%-60% from 0 to 30 h and 20%-30% from 30 h to 72 h were higher than that with the either DO level of 50%-60% or DO level of 20%-30% throughout the fermentation (Table 1). Moreover, the production rate of lipid and biomass of the former was also higher than the latter (Table 1). The maximum lipid concentrations were 5.05, 2.89, 7.25 and 11.77 in the fermentation with DO level of 50%-60%, 20%-30%, 50%-60% followed by 20%-30% without glycerol addition, and 50%-60% followed by 20%-30% with glycerol addition, respectively. It can be seen that the lipid production was improved with the DO level optimization (comparing the results of the fermentation with DO level of 50%-60%, 30%, 50%-60% followed by 20%-30% without glycerol addition). It was also noticed that the glycerol addition was important in the lipid production with the optimized DO level fermentation. Without glycerol addition, the maximum lipid production was 7.25 g/L, but it reached 11.77 g/L with the addition of glycerol. The maximum lipid content was similar in the fermentation with DO level of 50%-60% followed by 20%-30% with or without glycerol addition. It suggested that glycerol addition didn’t enhance lipid
lipid accumulation. The glycerol addition provided sufficient substrate and preventing the inhibition on cell growth.
The study revealed that DO level has great impact on the lipid accumulation in the T. oleaginosus, and optimal DO level enhanced lipid production. In addition, substrate has to be maintained in sufficient degree in order to allow the cells to obtain “food” for growth (biomass and lipid).
3.4. Energy balance of the optimized fermentation
The mass and energy balance of the lipid production from T. oleaginosus was calculated based on 1 tonne of lipid production. As mentioned, the biomass
concentration and lipid content were almost constant after 54 h. Hence, the study assumed that the fermentation was ended at 54 h. The corresponding biomass concentration, lipid content and consumed glycerol amount at 54 h were used in the calculations. The trace nutrients used in the medium were not considered due to the extremely low amount demand. The energy consumption due to the chemical
utilization was calculated similarly as stated in our previous studies (Zhang et al. 2013, Zhang et al. 2016). The glycerol used in this study was crude glycerol collected from biodiesel production industry. The energy input from the glycerol was calculated after subtracting the energy used to purifying the crude glycerol to get the pure glycerol. The mass and energy balance was shown in Table 2.
50%-60% and 50%-60% followed by 20%-30% were the energy gain process for lipid production from T. oleaginous (Table 3). With DO level of 20%-30%, it was energy loss process. It indicates that it was not suitable to produce lipid through the
fermentation with DO level of 20%-30% in terms of energy balance. Among all, the lipid production from the fermentation with DO level of 50%-60% followed by 20%-30% and glycerol addition at 30 h provided the highest energy gain 20.31 GJ/tonne lipid produced. Even without glycerol addition, it also gave more energy gain than that of the one with DO level of 50%-60% throughout the fermentation. It indicates that optimization of DO level during fermentation for lipid production was necessary and important.
It was also found that the greatest contributor to the energy input was the consumption of glycerol, which took up 43% to 48% of the total energy input. It suggested that the energy balance would be more favorable if the substrate with low energy density was applied in the fermentation for lipid production.
3.5. Cost estimation of the optimized fermentation
The cost of lipid production from the fermentations with different DO level was estimated according to the mass balance (1 tonne/d) studied above. The results were shown in the Table 3.
It was observed that the lowest cost of lipid production occurred in the
at 30 h (6.12 $/kg lipid) (Table 3). The one without glycerol addition required a little high cost to produce per kg of lipid (6.81 $/kg lipid). In the case of the lipid
production from the fermentation with DO level of 50%-60% (13.79 $/kg lipid) or 20%-30% (21.11 $/kg lipid), the cost was doubled or tripled, respectively, compared to the one with DO level of 50%-60% followed by 20%-30% and glycerol addition at 30 h. As the DO supply was greatly associated with utilities, hence it was found that the utilities of the fermentation with DO level of 50%-60% throughout (8.02% out of the total cost) took the highest percentage and that with DO level of 20%-30% throughout (4.35% out of the total cost) took the lowest percentage compared to other cases (7.60% and 7.38% out of the total cost for the fermentation with DO level of 50%-60%
followed by 20%-30% with or without DO, respectively). It indicates that
optimization on DO level for lipid production significantly reduced lipid production cost as well as utilities fraction of the total cost.
The labor-dependent was the major contributor of the total cost (per kg lipid production) in all the cases (Table 3). It was due to that the assumed lipid production scale (1 tonne lipid/d) was small, but the labor hours required to operate the facilities were demanded though the workloads were slight. When the scale was increased to 5 or 10 ton lipid/d, the cost of the lipid production was highly reduced. For instance, the cost of the lipid production from the fermentation with DO level of 50%-60%
followed by 20%-30% and glycerol addition at 30 h was dropped to 2.95 and 1.03 $/kg lipid for the scale of 5 and 10 ton/d lipid, respectively. The weight of labor-dependent out of the total cost was also highly reduced from 61%-78% for the scale
of 1 ton lipid/d to 18%-32% for the scale of 10 ton lipid/d.
The lowest cost of lipid estimated in the study (6.12 $/kg) was higher than that of the soybean oil (2-3 $/kg) which is currently being used as biodiesel production feedstock when the scale was set at 1 ton lipid/d. It is clear that it will not be
comparable with the soybean oil. However, the cost was only 1.03 $/kg lipid when it was scaled up to 10 ton lipid/d, which was only half of the price of the soybean oil. It indicates that process optimization is important in a product production and the production scale should be estimated as well in a real practice.
4. Conclusions
Optimization of DO level during fermentation could highly increase the lipid productivity, and hence reduce the lipid production cost with the other cultivation condition kept constant. Fermentation under optimal DO level required less energy input compared to the normal fermentation. The study revealed that DO had great impact on lipid accumulation of T. oleaginosus, and thus affected on the energy balance and cost of lipid production.
Acknowledgement
Sincere thanks are due to the grant Major Project of National Water Pollution Control and Governance of Science and Technology (2017ZX07401001) and Shenzhen Science and Technology Fundamental Research.
References
Atashrouz S, Hatampoor A, Yadegari A, Ghasemi H, Tayebi L, Rasoulianboroujeni M. 2018. Mathematical modeling of oxygen transfer in porous scaffolds for stem cell growth: the effects of porosity, cell type, scaffold architecture and cell distribution. Materials Chemistry and Physics.
Bellou S, Triantaphyllidou IE, Mizerakis P, Aggelis G. 2016. High lipid accumulation in Yarrowia lipolytica cultivated under double limitation of nitrogen and magnesium. Journal of Biotechnology 234: 116-126.
Beuther DA, Sutherland ER. 2007. Overweight, obesity, and incident asthma: a meta-analysis of prospective epidemiologic studies. Am. J. Resp. Crit. Care Med. 175: 661-666.
Calvey CH, Su Y-K, Willis LB, McGee M, Jeffries TW. 2016. Nitrogen limitation, oxygen limitation, and lipid accumulation in Lipomyces starkeyi. Bioresource Technology 200: 780-788.
Capusoni C, Rodighiero V, Cucchetti D, Galafassi S, Bianchi D, Franzosi G, Compagno C. 2017. Characterization of lipid accumulation and lipidome analysis in the oleaginous yeasts Rhodosporidium azoricum and Trichosporon oleaginosus. Bioresource Technology 238: 281-289.
Chen J, Zhang X, Tyagi RD, Drogui P. 2018a. Utilization of methanol in crude glycerol to assist lipid production in non-sterilized fermentation from Trichosporon oleaginosus. Bioresource Technology 253: 8-15.
Chen J, Zhang X, Yan S, Tyagi RD, Drogui P. 2017. Lipid production from fed-batch fermentation of crude glycerol directed by the kinetic study of batch fermentations. Fuel 209: 1-9.
Chen J, Yan S, Zhang X, Tyagi RD, Surampalli RY, Valéro JR. 2018b. Chemical and biological conversion of crude glycerol derived from waste cooking oil to biodiesel. Waste Management 71: 164-175.
Chen J, Tyagi RD, Li J, Zhang X, Drogui P, Sun F. 2018c. Economic assessment of biodiesel production from wastewater sludge. Bioresource Technology 253: 41-48.
Chen Y, Cen K, Lu Y, Zhang S, Shang Y, Wang C. 2018d. Nitrogen-starvation triggers cellular accumulation of triacylglycerol in Metarhizium robertsii. Fungal Biology 122: 410-419.
Deeba F, Pruthi V, Negi YS. 2018. Aromatic hydrocarbon biodegradation activates neutral lipid biosynthesis in oleaginous yeast. Bioresource Technology 255: 273-280.
Delrue F, Setier P, Sahut C, Cournac L, Roubaud A, Peltier G. 2012. An economic, sustainability, and energetic model of biodiesel production from microalgae. Bioresource Technology 111: 191-200.
Englezos V, Cravero F, Torchio F, Rantsiou K, Ortiz-Julien A, Lambri M, Gerbi V, Rolle L, Cocolin L. 2018. Oxygen availability and strain combination modulate yeast growth dynamics in mixed culture fermentations of grape must with Starmerella bacillaris and Saccharomyces cerevisiae. Food Microbiology 69:
179-188.
Espenshade PJ, Hughes AL. 2007. Regulation of sterol synthesis in eukaryotes. Annu. Rev. Genet. 41: 401-427.
Foufelle F, Ferre P. 2002. New perspectives in the regulation of hepatic glycolytic and lipogenic genes by insulin and glucose: a role for the transcription factor sterol regulatory element binding protein-1c. Biochem. J. 366: 377-391.
Fu L, Cui X, Li Y, Xu L, Zhang C, Xiong R, Zhou D, Crittenden JC. 2017. Excessive phosphorus enhances Chlorella regularis lipid production under nitrogen starvation stress during glucose heterotrophic cultivation. Chemical Engineering Journal 330: 566-572.
Ginovart M, Carbó R, Blanco M, Portell X. 2018. Digital Image Analysis of Yeast Single Cells Growing in Two Different Oxygen Concentrations to Analyze the Population Growth and to Assist Individual-Based Modeling. Frontiers in Microbiology 8.
Guo C, Ma R, Liu X, Chen T, Li Y, Yu Y, Duan J, Zhou X, Li Y, Sun Z. 2018. Silica nanoparticles promote oxLDL-induced macrophage lipid accumulation and apoptosis via endoplasmic reticulum stress signaling. Science of The Total Environment 631-632: 570-579.
Huang X, Luo H, Mu T, Shen Y, Yuan M, Liu J. 2018a. Enhancement of lipid accumulation by oleaginous yeast through phosphorus limitation under high content of ammonia. Bioresource Technology 262: 9-14.
carbon under nitrogen-limited cultivation and its potential for nitrate removal. Chemosphere 190: 1-8.
Kim B, Praveenkumar R, Lee J, Nam B, Kim D-M, Lee K, Lee Y-C, Oh Y-K. 2016. Magnesium aminoclay enhances lipid production of mixotrophic Chlorella sp. KR-1 while reducing bacterial populations. Bioresource Technology 219: 608-613.
Lam JC, Ip MS. 2007. An update on obstructive sleep apnea and the metabolic syndrome. Curr. Opin. Pulm. Med. 13: 484-489.
Leong W-H, Lim J-W, Lam M-K, Uemura Y, Ho Y-C. 2018. Third generation biofuels: A nutritional perspective in enhancing microbial lipid production. Renewable and Sustainable Energy Reviews 91: 950-961.
Ma Y, Gao Z, Wang Q, Liu Y. 2018. Biodiesels from microbial oils: Opportunity and challenges. Bioresource Technology 263: 631-641.
Magdouli S, Brar SK, Blais JF. 2018. Morphology and rheological behaviour of Yarrowia lipolytica: Impact of dissolved oxygen level on cell growth and lipid composition. Process Biochemistry 65: 1-10.
Ren H-Y, Liu B-F, Kong F, Zhao L, Xie G-J, Ren N-Q. 2014. Enhanced lipid accumulation of green microalga Scenedesmus sp. by metal ions and EDTA addition. Bioresource Technology 169: 763-767.
Richardson J, Johnson M, Outlaw J. 2012. Economic comparison of open pond raceways to photo bio-reactors for profitable production of algae for transportation fuels in the Southwest. Algal Research 1: 93-100.
Shields-Menard SA, Amirsadeghi M, French WT, Boopathy R. 2018. A review on microbial lipids as a potential biofuel. Bioresource Technology 259: 451-460. Shimomura I, Matsuda M, Hammer RE, Bashmakov Y, Brown MS, Goldstein JL.
2000. Decreased IRS-2 and increased SREBP-1c lead to mixed insulin resistance and sensitivity in livers of lipodystrophic and ob/ob mice. Mol. Cell 6: 77-86. Taghibiglou C, Martin HGS, Rose JK, Ivanova N, Lin CHC, Lau HL, Rai S, Wang
YT, Rankin CH. 2009. Essential role of SBP-1 activation in oxygen deprivation induced lipid accumulation and increase in body width/length ratio in Caenorhabditis elegans. FEBS Letters 583: 831-834.
Todd BL, Stewart EV, Burg JS, Hughes AL, Espenshade PJ. 2006. Sterol regulatory element binding protein is a principal regulator of anaerobic gene expression in fission yeast. Mol. Cell Biol. 26: 2817-2831.
Zhang X, Yan S, Tyagi RD, Surampalli RY. 2013. Energy balance and greenhouse gas emissions of biodiesel production from oil derived from wastewater and wastewater sludge. Renewable Energy 55: 392-403.
Zhang X, Yan S, Tyagi RD, Surampalli RY, Valéro JR. 2014. Lipid production from Trichosporon oleaginosus cultivated with pre-treated secondary wastewater sludge. Fuel 134: 274-282.
Zhang X, Yan S, Tyagi RD, Surampalli RY, Valéro JR. 2016. Energy balance of biofuel production from biological conversion of crude glycerol. Journal of Environmental Management 170: 169-176.
for Biodiesel from Sludge and Crude Glycerol. Water Environment Research 89: 424-439.
Zhang X, Chen J, Idossou V, Tyagi RD, Li J, Wang H. 2018. Lipid accumulation from Trichosporon oleaginosus with co-fermentation of washed wastewater sludge and crude glycerol. Fuel 226: 93-102.
Živković SB, Veljković MV, Banković-Ilić IB, Krstić IM, Konstantinović SS, Ilić SB, Avramović JM, Stamenković OS, Veljković VB. 2017. Technological, technical, economic, environmental, social, human health risk, toxicological and policy considerations of biodiesel production and use. Renewable and Sustainable Energy Reviews 79: 222-247.
Table 1. The comparison of fermentation with optimized DO level with the constant DO level fermentation
Items DO level of fermentations DO 50%-60% throughout DO 20%-30% throughout DO 50%-60% followed by DO 20%-30% (with glycerol addition) DO 50%-60% followed by DO 20%-30% (without glycerol addition) Maximum biomass concentration (g/L) 11.72±0.98 5.47±0.26 20.54±0.71 13.18±0.64 Maximum lipid content (%) 42.84±3.56 52.91±1.88 57.30±1.78 56.22±2.21 Maximum lipid concentration (g/L) 5.05 2.89 11.77 7.25 Maximum biomass production rate (g/L/h) 0.45 0.14 0.54 0.52 Maximum lipid production rate (g/L/h) 0.18 0.09 0.50 0.31
Table 2. The mass and energy balance of different fermentations for 1 tonne of lipid produced Items Case DO 50-60% throughtout DO 20-30% throughtout DO 50-60% followed DO 20%-30% (with glycerol addition) DO 50-60% follows DO 20%-30% (without glycerol addition) Mass Energy Mass Energy Mass Energy Mass Energy Fermentation Total volume 215.66 m3 408.92 m3 98.04 m3 145.07 m3 Glycerol (2.21 MJ/kg) 8.55tonne 18.89 GJ 9.65 tonne 21.34 GJ 5.00 tonne 11.04 GJ 6.07 tonne 13.41 GJ KH2PO4 (10.3 MJ/kg) 582.29 kg 6.00 GJ 1104.09 kg 11.37 GJ 264.70 kg 2.73 GJ 391.69 kg 4.03 GJ Na2HPO4 (8.41 MJ/kg) 204.88 kg 1.72 GJ 388.48 kg 3.27 GJ 93.14 kg 0.78 GJ 137.82 kg 1.16 GJ NH4Cl (7.42 MJ/kg) 87.13 kg 0.65 GJ 165.20 kg 1.23 GJ 39.61 kg 0.29 GJ 58.61 kg 0.43 GJ MgSO4·7H2O (12.12 MJ/kg) 43.13 kg 0.52 GJ 81.78 kg 0.99 GJ 19.61 kg 0.24 GJ 29.01 kg 0.35 GJ yeast extract (6.46 MJ/kg) 21.57 kg 0.14 GJ 40.89 kg 0.26 GJ 9.80 kg 0.06 GJ 14.51 kg 0.09 GJ EDTA (13.25 MJ/kg) 21.57 kg 0.29 GJ 40.89 kg 0.54 GJ 9.80 kg 1.24 GJ 14.51 kg 0.19 GJ Water 208.02 m3 400.08 m3 93.69 m3 139.74 m3 Electricity consumption due to aeration and agitation 1134.39 kwh 4.08 GJ 866.92 kwh 3.12 GJ 371.56 kwh 1.33 GJ 459.87 kwh 1.66 GJ Biomass harvesting
Biomass 2.43 tonne 1.95 tonne 1.84 tonne 1.85
tonne Pumping (0.01 kwh/m3) 2.16 kwh 0.008 GJ 4.09 kwh 0.01 GJ 0.98 kwh 0.004 GJ 1.45 kwh 0.005 GJ Centrifugation (1 kwh/m3) 215.66 kwh 0.78 GJ 408.92 kwh 1.47 GJ 98.04 kwh 0.35 GJ 145.07 kwh 0.52 GJ Lipid extraction
Total volume 42.50 m3 34.21 m3 32.31 m3 32.42 m3 Chloroform (7.625 MJ/kg; density 1.48 kg/L) 18.21 m3 14.66 m3 13.85 m3 13.89 m3 Methanol (22 MJ/kg; density 0.79 kg/L) 12.14 m3 9.77 m3 9.23 m3 9.26 m3 Mixing (0.35 kwh/m3) 14.87 kwh 0.05 GJ 11.97 kwh 0.04 GJ 11.31 kwh 0.04 GJ 11.35 kwh 0.04 GJ Centrifugation (1 kwh/m3) 42.49 kwh 0.15 GJ 34.21 kwh 0.12 GJ 32.31 kwh 0.12 GJ 32.42 kwh 0.12 GJ Evaporation (50 kwh/m3) 2124.82 kwh 7.65 GJ 1710.32 kwh 6.16 GJ 1615.29 kwh 5.82 GJ 1620.97 kwh 5.84 GJ Chloroform loss (7.625 MJ/kg; density 1.48 kg/L) 9.10 L 7.33 L 6.92 L 6.95 L Methanol loss (22 MJ/kg; density 0.79 kg/L) 6.07 L 4.89 L 4.62 L 4.63 L Dry residual biomass (8.00 MJ/kg) 1.43 tonne 11.44 GJ 0.95 tonne 7.60 GJ 0.85 tonne 6.77 GJ 0.85 tonne 6.82 GJ Lipid (37.6 MJ/kg)
1 tonne 37.6 GJ 1 tonne 37.6 GJ 1 tonne 37.6 GJ 1 tonne 37.6 GJ Total energy input 40.93 GJ 49.93 GJ 24.06 GJ 27.85 GJ Energy credit 11.44 GJ 7.6 GJ 6.77 GJ 6.82 GJ Net energy input 29.49 GJ 42.33 GJ 17.29 GJ 21.03 GJ Energy output 37.6 GJ 37.6 GJ 37.6 GJ 37.6 GJ Energy balance 8.11 GJ -4.73 GJ 20.31 GJ 16.57 GJ Energy ratio 1.28 0.89 2.18 1.79
The chloroform and methanol were used in the lipid extraction, but they were recovered after extraction and reused in the next extraction batch. The loss of the chloroform and methanol were small quantity, and the energy input due to the loss of the solvents was neglected in this study.
Table 3. The lipid production cost in the different fermentation.
Cost breakdown Cases
DO 50-60% throughtout DO 20-30% throughtout DO 50-60% followed by DO 20%-30% (with glycerol addition) DO 50-60% followed by DO 20%-30% (without glycerol addition) Raw materials ($/kg lipid) 2.58 0.73 1.15 1.08 Labor dependent ($/kg lipid) 8.47 16.53 3.73 4.20 Facility dependent ($/kg lipid) 1.63 2.93 0.77 0.92 Utilities ($/kg lipid) 1.11 0.92 0.47 0.61 Total ($/kg lipid) 13.79 21.11 6.12 6.81
0 6 12 18 24 30 36 42 48 54 60 66 72 78 1.00E+07 1.00E+08 1.00E+09 1.00E+10 1.00E+11 10%-20% 20%-30% 30%-40% 40%-50% 50%-60% 60%-70% 70%-80% CFU c once ntr ati on ( /mL) Time (h) a 0 10 20 30 40 50 60 70 80 0 2 4 6 8 10 12 10%-20% 20%-30% 30%-40% 40%-50% 50%-60% 60%-70% 70%-80% Bi omass con centrat ion (g/L) Time (h) b
0 10 20 30 40 50 60 70 80 5 10 15 20 25 30 35 40 45 50 55 10%-20% 20%-30% 30%-40% 40%-50% 50%-60% 60%-70% 70%-80% Li pid c ontent (%) Time (h) c 0 20 40 60 80 0 5 10 15 20 25 30 35 40 45 50 10%-20% 20%-30% 30%-40% 40%-50% 50%-60% 60%-70% 70%-80% Gly cer ol c once ntrati on ( g/L) Time (h) d 0 20 40 60 80 -0.1 0 0.1 0.2 0.3 0.4 0.5 0.6 10%-20% 20%-30% 30%-40% 40%-50% 50%-60% 60%-70% 70%-80% Bi omass p ro ducti on rate (g/ L/h) Time (h) e
concentration (d) and biomass growth rate (e) during fermentation with different DO levels
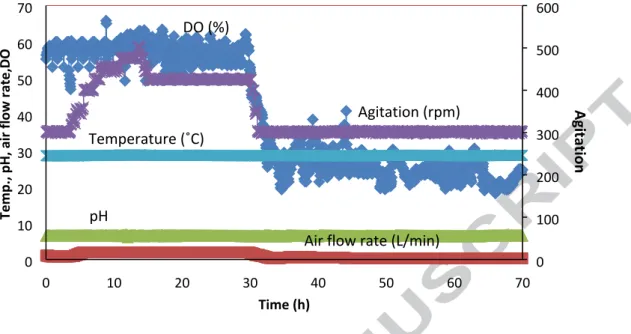
0 10 20 30 40 50 60 70 0 10 20 30 40 50 60 70 0 100 200 300 400 500 600 Te mp., p H, ai r flo w rat e,DO Time (h) Agit ati on DO (%) Agitation (rpm) Temperature (˚C) pH
Air flow rate (L/min)
Fig. 2. The conditions of the fermentation with DO level of 50%-60% followed by 20%-30% with glycerol addition (Temp. presents temperature)
0 10 20 30 40 50 60 70 0 10 20 30 40 50 60 Time (h) Bi omass, l ip id, a nd gl yce rol con c. ( g/ L) l ipi d cont en t( % ) 50-60% DO 20-30% DO glycerol lipid content
biomass lipid concentration
Fig. 3. The fermentation at different DO level for enhancing lipid accumulation 1. Crude glycerol generated from biodiesel production was circulated to produce biodiesel. 2. The optimal DO level for cell division and lipid accumulation was different.
3. Around 41% of energy saving was observed after DO level optimization in lipid production. 4. The cost was reduced around one time in the optimized DO level process.